Rushton’s evolutionary tree

Tags

, , , ,

The following is the abstract from J.P. Rushton’s original 1989 paper that launched him to international controversy:

Genetic distance estimates calculated from DNA sequencing indicate that in years since emergence from the ancestral hominid line, Mongoloids = 41,000, Caucasoids = 110,000, and Negroids = 200,000. Data also show that this succession is matched by numerous other differences such that Mongoloids > Caucasoids > Negroids in brain size and intelligence (cranial capacity = 1448, 1408, 1334 cm3; brain weight = 1351, 1336, 1286 gm.; millions of excess neurons = 8900, 8650, 8550; IQ = 107, 100, 85); maturational delay (age to walk alone, age of first intercourse, age of death); sexual restraint (ovulation rate, intercourse frequencies, sexually transmitted diseases including AIDS); quiescent temperament (aggressiveness, anxiety, sociability); and social organization (law abidingness, marital stability, mental health). This pattern is ordered by a theory of r/K reproductive strategies in which Mongoloids are posited to be more K-selected than Caucasoids and especially more than Negroids. (K-selected reproductive strategies emphasize parental care and are to be contrasted with r-selected strategies which emphasize fecundity, the bioenergetic trade-off between which is postulated to underlie cross-species differences in brain size, speed of maturation, reproductive effort, and longevity.) It is suggested that this pattern came about because the ice ages exerted greater selection pressures on the later emerging populations to produce larger brains, longer lives, and more K-like behavior. One theoretical possibility is that evolution is progressive and that some populations are more “advanced” than others. Predictions are made concerning economic projections and the spread of AIDS.

One especially interesting part of Rushton’s theory was the idea that later emerging populations are more advanced than early emerging populations, but Rushton never fully elaborated, beyond saying that Negroids emerged 200 kya, Caucasoids 110 kya and Mongoloids 41 kya.

Rushton’s source for these dates has always come from one 1988 paper from CB Stringer and P Andrews. Nowhere in the paper do they explicitly state that Negroids emerged 200 kya, so Rushton must have infered it from this paragraph:

If mtDNA changes are assumed to accumulate at a steady rate, genealogical trees constructed by minimizing genetic changes (through maximum parsimony analysis) distinguish two main branches. One leads exclusively to a number of African (or African origin) individuals, whereas the other leads to all other individuals of African or non-African origin. Dates for the branching points of the tree can be estimated from rates of mtDNA evolution in other organisms. This gives a date for the origin of the mtDNA of Homo sapiens at between 140,000 and 290,000 years ago, assuming constant rates of change at 2 to 4% per nucleotide site per million years…

Nowhere in the paper do they state that Caucasoids and Mongoloids emerged 110 kya and 41 kya respectively, but Rushton must have infered it from this paragraph:

Protein analyses, however, show a consistent split between “negroids” and the other groups, in accordance with most results from mtDNA and nuclear DNA. There mav be stronger selection on blood group types, and there is a less clear relationship between blood group phenotype and nucleotide sequence. Since the body of data from protein systems is also larger, the results from protein analyses are probably the most relevant here, and support the recent African origin model. These have been used to calibrate divergence times (again assuming selective neutrality and absence of gene flow) of about 110,000 years ago for the African-non-African split and about 41,000 years for the EuropeanAsian split (38).

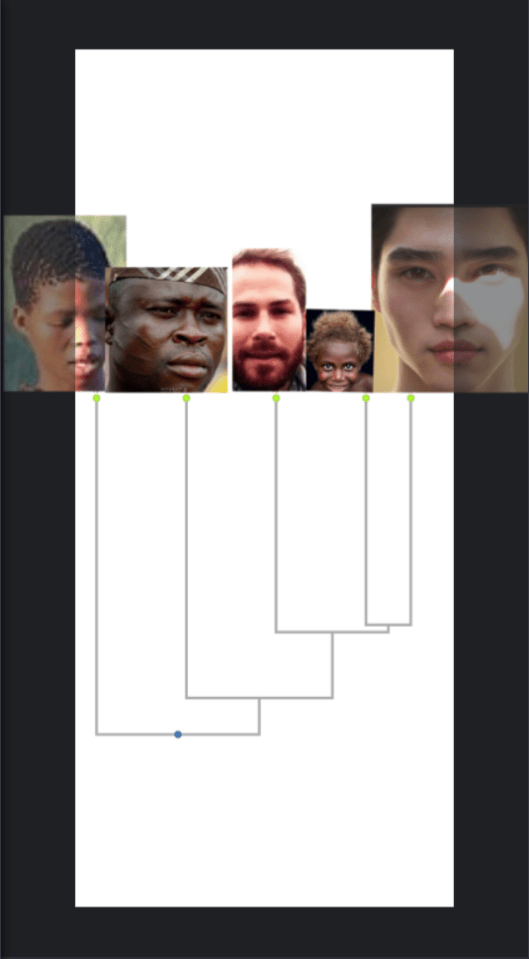
In short, the paper seems to be saying the following:

From left to right: Archaic Homo, Negroids, Caucasoids, Mongoloids

So it seems that Rushton would have interpreted the above tree as showings Negroids emerged 200 kya, Caucasoids emerged 110 kya, and Mongoloids emerged 41 kya.

My reading of the tree would be Negroids emerged 110 kya and Caucasoids and Mongoloids both emerged 41 kya, if emerged is defined as branching off the main trunk of the human evolutionary tree.

Rushton once told me that he believed “Mongoloids branched off from Caucasoids in a superior form”, but his citation only claims a Mongoloids and Caucasoids split from each other, not that one split off the other.

Nonetheless Rushton was probably right. The last common ancestor of Mongoloids and Caucasoids probably looked and behaved more like a Caucasoid than a Mongoloid. If so, it seems reasonable to say Mongoloids branched off from Caucasoids.

A principal component analysis of human populations

Tags

, , , , ,

Principal Component Analysis (PCA) is a mathematical technique by which many data points get reduced to a smaller number of more manageable data points.

Cavali-Sforza lumped humans into nine major populations. The following shows his phylogenetic tree of these nine populations followed by a matrix showing the genetic distance between them:

Because I wanted to see if these nine populations could be objectively reduced to a smaller number, I made all the distances negative and then entered the genetic distance matrix into a minitab spread sheet.

The reason I made the distances negative is because PC analysis is usually done on correlation matrices where the higher the value, the more similar. In a genetic distance matrix, it’s the opposite, hence the negative signs I added.

The principal component analysis gave the following result.

C1=Africans, C2= Non-European Caucasoid, C3=European Caucasoid, C4= Northeast Asian, C5=Arctic Northeast Asian, C6= Amerindians, C7= Southeast Asian, C8= Pacific Islander, C9= New Guinean & Australian

To determine how many principal components to retain, mathematicians use what’s called the eigenvalue > 1 rule, which in this case means only three components.

The first component explains 54% of genetic variation and since Northeast Asians have the highest loading on this component (0.432), it can be thought of as a measure of Northeast Asianness. Africans are the only group to load negatively on Northeast Asianness (-0.376).

The second component explains 26% of the variation and since Europeans have the highest loading on this (0.526), it can be considered a measure of whiteness.

The third component explains 12% of the variation and since Native Americans have the highest score on this (0.527) it can perhaps be considered a measure of “New Worldliness”.

Now when I plot each of the nine populations in three-dimensional space (x axis = Northeast Asianness, y axis = whiteness, z axis = New Worldliness) with their loadings multiplied by 10 to make differences visible, we find all of the nine populations fit into three major clusters.

made using Graphing Calculator 3D

These three clusters are extremely similar to the three major races of physical anthropology: Mongoloids on the back wall, Negroids on the side wall, and Caucasoids on the floor.

No disrespect to Caucasoids (I’m 100% pure Caucasoid myself). The graph can be reoriented so any group is on the floor.

One anomaly is that New Guineans & Australian aboriginals cluster with Mongoloids, even though they are morphologically closest to Negroid. Of course such anomolies are not uncommon in taxonomy. Birds for example genetically cluster with reptiles, even though they’re not reptiles. Humans cluster with apes, even though we’re not apes.

Such anomalies occur because most of our DNA is junk, so it groups us based on how recently we share common ancestors, not by how much of that common ancestor we shared.

Did the Caucasoid race start in India?

Tags

, , , , ,

Wikipedia has a fabulous tree showing how human populations are all related on the Y chromosome. Trees based on just the Y chromosome might give better results than trees based on the entire genome because the latter is confounded by interbreeding between lineages. By contrast the Y chromosome is only passed on the male line and since men did not interbreed with each other, we get a clean separation of branches.

In addition, mutations on the Y chromosome tend to be neutral, so it serves as a more reliable molecular clock.

source: wikipedia

Moving from left to right, you get an interesting transition from Negroid to Caucasoid to Mongoloid phenotypes.

I suspect the Caucasoid race evolved in India. The first modern humans to leave Africa were almost certainly morphologically Negroid and were drawn to India because it resembled the African climate they were adapted to.

Then among the indigenous Indians, there was likely a split between the proto-Island Indians (ancestors of Andaman Islanders) who remained Negroid, and mainland Indians (who started evolving Caucasoid hair and beards),

The race known as Australoids may simply be Negroids evolving into Caucasoids

Some of the proto-Caucaoids stayed India where they remain as relic isolated tribes, others headed to Australia where they are known as Australian aboriginals, while others headed Northwest where they evolved into proto-Arabs and eventually whites,

Men are autistic

Tags

, , , ,

[update, June 2, 6:01 pm EST) a previous version of this article cited data that mixed cognitive empathy with emotional empathy. This error has since been corrected]

A study proves what women have known and exploited for centuries: men are autistic.

A sample of over 670,000 individuals took a battery of tests and questionnaires measuring autism quotient, empathy quotient, systemizing quotient, and sensory perception quotient.

The most interesting find was that on the eye test, a measure of cognitive empathy (ability to read what others are thinking), neurotypical men scored 25.54 (SD 4.57) and neurotypical women scored 27.42 (SD 3.43). From this I estimated the sex-combined neurotypical mean and SD are 26.48 and 3.92, respectively. Converting the sex-combined mean and SD to the familiar IQ scale (mean 100, SD 15), we get the following hierarchy of social intelligence:

Neurotypical women: social IQ 104 (SD 13.13)

Neurotypical men: social IQ 96 (SD 17.5)

Autistic men: social IQ 89 (SD 25.4)

Autistic women: social IQ 88 (SD 27)

Autism can be defined as the hyper-masculinization of certain parts of the brain, and people exposed to more testosterone during a critical period of brain development are more likely to be autistic, according to Simon Barron Cohen.

Also interesting is the incredible variability in each of the groupings. Nearly the full range of social intelligence is found in both sexes and in both autistics and neurotypicals. Even some autistics will be social geniuses and even some female neurotypicals will be socially retarded.

But on average, neurotypical females are about 8 IQ points more socially intelligent than men, which makes sense because men evolved to be useful idiots who work 48 hours a week to provide for their wives who stay at home watching Oprah, and then taking half the man’s money in divorce, and live five years longer.

Because females (on average) lacked the spatial and logical IQ to hunt food and build shelter, they evolved the social IQ to find a man who could these things for them.

However it should be noted that because of their greater variance (at least in this study), we’d expect social geniuses to be more likely to be male than female.

Genetic distance & the cophenetic correlation

the genetic relationship between five human populations, expressed as a family tree. From left to right: San, Yoruba, French, Papuan, East Asian

I would like to thank everyone for the incredible reaction to my first dendrogram and a special thanks to the great James Thompson who tweeted it out to his thousands and thousands of twitter followers.

Although the vast majority of people enjoyed the dendrogram, there were a few people who were mocking it. Luckily I was tipped off by a quick thinking blogger. Not to namedrop but it was HBD Chick).

One of the critics asked why I had not calculated the cophentic correlation, because if I had, I would have known that human “races” don’t fit a tree like structure.

Alan R. Templeton writes:

The cophenetic correlation measures how well the observed genetic distances fit the predicted genetic distances from an evolutionary tree model and provides a heuristic goodness of fit to treeness…  The cophenetic correlations for various data sets that have been used to portray human population trees vary from 0.45 to 0.79 (Templeton, 1998a). A tree-like structure of genetic differentiation requires a cophentic correlation greater than 0.9, and any value less than 0.8 is regarded as a poor fit (Rohlf, 1993)

Source: Biological races in Humans

So what’s the cophenetic correlation of my dendrogram?

0.99333828

Why did my dendrogram achieve such a cophenetic correlation when others failed to do so? There are several possible reasons.

  1. incompetence? perhaps I didn’t follow the correct procedures?
  2. luck. With only a 5 modern human populations, a high correlation may have occurred by chance.
  3. pure samples: perhaps the genomes in the data-set were less hybridized than previous data-sets which contained mixed groups like Southeast Asians
  4. genome thoroughness: perhaps my data being newer, sampled more of the genome than previous research and thus gave more accurate results.

Genetic distance between humans, neanderthals & other primates

Tags

, , , , , , , ,

About a year ago I wrote:

The following chart (created by some scientist(s) led by David Reich) shows the genetic divergence between hominin samples as a fraction of the human-chimp difference.  So for example, all the human groups have just over a 0.12 genetic divergence with Neanderthals, meaning that the genetic difference between humans and Neanderthals is only 12% as great as the genetic difference between humans and Chimps (source: supplement of Genetic history of an archaic hominin group from Denisova Cave in Siberia.)

distance4

The purpose of the chart is to estimate how long ago the different populations diverged from a common ancestor.  So since the fossil record tells us that Neanderthals and chimps diverged about 6.5 million years, then humans and Neanderthals should have diverged roughly 0.8 million years ago (12% of 6.5 million) assuming genetic divergence maps to chronological divergence in a linear way.

I transformed the genetic distance matrix into a dendrogram, which looks at all the distances and creates the most parsimonious family tree:

Dendogram showing genetic relationship between 8 groups. From left to right: chimps, san, Yoruba, French, Papuan, East Asian, Denisovan, Neanderthals

What’s cool about dendrograms is they let you determine the number of categories and subcategories in a very objective way.

Of course dendrograms are only as good as the data you put into them, and I don’t endorse basing taxonomy simply on genetic relatedness, but if I did, here’s how I’d interpret the above tree:

The first major split is between chimps & everyone else. This is consistent with two well recognized genera of hominins : Pan (i.e. chimps) and Homo (humans and near-humans).

Now within the Homo genus, we see another major split in the tree. Anatomically Modern Humans (AMH) vs Archaic Humans. Thus we can divide the homo genus into at least two major species.

Within the Archaic Humans we can further subdivide into major races: Denisovans and Neanderthals.

Now within our own species, AMH, the dendrogram shows three major races: Capoids, Congoids and Non-Africans.

I’m not saying I agree with this taxonomy since it was only based on genetic distance (much of which is junk DNA) but what’s great about using dendrograms is almost everyone looking at them will assign groups to the same categories and subcategories, even if they don’t use the same words (race, species, genus) to describe them. It’s wholly objective.

But what is needed is a dendrogram based on polygenic scores of actual phenotypes. That way people who have the same phenotypes caused by the same genomic architecture could be grouped together.

Unlike the above dendrogram, which groups based on how recently we share a common ancestor, we need to group based on how much of the common ancestor we share.

[update may 26, 2019: an earlier version of this article misspelled dendrogram]

[2nd update may 26, 2019: an earlier version of this article contained bragging that has since been removed]

Tulsi Gabbard tries to stop a war with Iran

Tags

, , , , , ,

In the following video Tulsi Gabbard warns America NOT to invade Iran.

However not even Oprah could stop the war with Iraq, despite hosting a series of anti-war shows to it in the few months before it began:

Why are these wars so hard to stop? And why do even Presidents like Trump , Obama, and George W. Bush, who campaigned against them, suddenly start supporting them once they get into office?

Commenter philosopher believes there’s a secret elite he calls “Master” who orders the Presidsent around once he gets into power. So why do people run for President if they’re just going to be bossed around once they get there? Perhaps they think that by getting elected President, they’ll be in charge, but only once they get there does Master reveal himself.

Master reminds me of the mysterious “Man in Black” who controls Michael Myers in Halloween 6

While this may sound like a psychotic delusion, there are similar theories to explain the Fermi Paradox. In the fabulous after-on pocast, it was suggested that the reason we’ve never been visited by aliens is that a Master species of aliens has ordered all advanced life in the galaxy to leave us alone, and if we too become technologically advanced enough to visit distant planets, these Master aliens will reveal themselves to us too, and tell us what the rules are.

It could work the same way in American society. You never find out about the secret elite running things until you gain enough power for Master to reveal himself to you.

Do I actually believe this? Not in the literal way philosopher does. I believe “Master” is better understood as a metaphor for the huge lobbying groups that buy politicians, but I don’t believe there are any independent individuals ordering most recent presidents around. But it would make a great horror film!

What Makes People Want To Bet?

Tags

, , , , ,

Guest post by Ralph S. Walter

The psychological question of what makes people want to play casino games has never been too much of a mystery. Casino environments are basically built to give us little surges of adrenaline and dopamine. There are exciting sounds and visuals on gaming machines signifying victory; there’s a thrill in raking in a small stack of chips at a poker table, even if you’ve lost your previous 10 hands; somebody is always winning somewhere, effectively giving you continual previews of the joy and excitement you too could feel. The incentive, so to speak, is right there in front of you (or rather, all around you).

When it comes to sport and event betting, however, motivation and incentive are a little bit murkier. Next to casino play, this side of the gambling business is positively dull: casino sportsbooks are essentially more depressing versions of sports bars, and betting slips are about as bland to look at as grocery store receipts. Nothing jingles or flashes if you win, and you aren’t immediately gifted with colorful tokens representing your winnings. So what exactly makes people want to bet? We’re digging into some of the psychological motivators and reasons below.

The Same Old Reasons

There are actually some fairly academic looks into the psychology of sports betting, and really they turn up the same old reasons behind gambling that most of us are at least vaguely familiar with – the things that are somewhat foundational, impacting us before the excitement of a casino environment even comes into play. Most notably, it’s risk and reward. The risk of gambling produces adrenaline in and of itself; we almost inherently like putting something on the line and not knowing if it will pay off (though interestingly, men seem to enjoy this more than women, based on studies). As for reward, it’s fairly self-explanatory. We also enjoy gambling not because of the activity itself, but because we like the possibility of the rewards it could bring about. The most basic way to understand this psychology is just to think about why people keep buying lottery tickets – but it factors into sports betting as well.

Belief In Knowledge

With more specific regard to sports betting, there is also an element of the psychology that ties into people’s knowledge of the subject at hand. We tend to bet on sports (or events, politics, etc.) that we’re familiar with – that we think we know, and by extension, can predict. Studies have actually indicated that having greater knowledge of a given subject doesn’t necessarily correlate to more success betting, but that’s a hard thing for us to tell ourselves. If we feel like experts about something, we want to put that expertise to use in a practical, rewarding manner – just as we would in everyday life or with a work-related skill.

Game-Like Nature

More and more we’re also seeing betting twisted into something resembling a game, which in turn allows bettors to feel as if knowledge and skill are playing a role. It’s no accident that the budding online gambling culture in New Jersey is compared and in some cases directly tied to the existing daily fantasy sports industry in the U.S. Before betting legalization started, daily fantasy was effectively taking advantage of legal loopholes and allowing people to gamble on outcomes within the boundaries of fantasy sports. This is a game, to most people – one that we at least perceive is decided to some extent based on our skills, knowledge, and decisions. The more opportunities we have to bet in this fashion, the more likely competitive instincts are to come into play. Simply put, we bet because we feel like we’re just playing games we know how to win.

Desire To Improve

There is also an element of loss aversion present in the psychology of sports betting. It may not get us to start betting in the first place, but it can certainly get us to keep at it once we’ve started, just as it’s so often responsible for keeping someone sitting at a poker table for too long. The idea, for those who aren’t familiar, is simply that the pain of losing is greater than the joy of winning. We care more when we lose a bet than when we win one. And because losing is essentially inherently more likely in betting, we have an easy recipe for staying interested. The more bets we lose, the less we want to walk away, and the surer we become that the next one will be a winner.

The evolution of behavioral modernity

Tags

,

Commenter Nehemiah writes:

It is implausible that the Bushmen populations (which once occupied a much larger range than today) lived in total isolation from non-Bushmen populations. Presumably the mutation or mutations that facilitated the emergence of grammar appeared or came together in one population first. This development was so valuable that the relevant genes had a high chance of being preserved and spreading to fixation if even a small amount of interbreeding occurred with a neighboring population. Thus, even if Bushmen (and Pygmies, BTW) split off between 200kya and 300kya, that would not have prevented the spread of an especially valuable mutation from any one human population to all the rest. I argue that a limited vocabulary already existed in all sapiens populations (and probably some non-Sapiens populations as well), but the appearance of the “grammar gene(s)” made vocabulary immensely more useful so that it was now worthwhile to coin many more words, and the more intelligent band members could master the use and comprehension of this expanding vocabulary much better than the less intelligent. The grammar mutation should have spread relatively rapidly from any human population to all the rest. If we backcrossed with Neanderthals and Denisovans, I cannot imagine that there was not also gene flow to (and from) Bushmen (and Pygmies) as well. Further, I know of no reason to presume that grammar did not first emerge in Bushmen and spread to non-Bushmen rather than vice versa. We simply do not know.

Neanderthals possessed our FOXP2 gene and a hyoid bone that facilitate speech, but the larynx was still in a more anterior position, as in an infant of our species, which restricted the number of vowel sounds that could be formed, and therefore the number of words that could be created. I argue that if Neanderthal has possessed grammatical language at an earlier date, there would have been evolutionary selection for a larynx positioned so that a larger number of words could be formed. Thus, I also argue that grammar evolved sometime after Neanderthals split from the lineage that led to sapiens, and our sudden and rapid colonization of the world in the last 70ky suggests that the grammatically structured use of vocabular evolved shortly before we exploded suddenly over the world’s surface, since the appearance of grammatical language is the most likely advantage that allowed us to expand rapidly and to quickly displace our rivals who were longer established and better adapted to the local environment.

The notion that a small number of genetic mutation(s) gave rise to behavioral modernity and the upper Paleothic revolution is associated with paleontologist Richard Klein:

But geneticist David Reich is having none of it:

Expanding our analysis to the whole genome, we could not find any location–apart from mitochondrial DNA and the Y chromosome, where all people living today share a common ancestor less than 320,000 years ago. This is a far longer time scale than the one required by Klein’s hypothesis. If Klein was right, it would be expected that there would be places in the genome, beyond mitochondrial DNA and the Y chromosome, where almost everyone shares a common ancestor within the last hundred thousand years. But these do not in fact seem to exist.

Our results do not completely rule out the hypothesis of a single critical genetic change. There is a small fraction of the genome that contains complicated sequences that are difficult to study and that was not included in our survey. But the key change, if it exists, is running out of places to hide….

From Who are we and how we got here by David Reich, pg 18

But while Reich largely rejects the idea of a single (or small number) of genetic mutations giving rise to behavior modernity, he seems open to the possibility that “…coordinated natural selection on combinations of many mutations simultaneously–did enable new cognitive capacities…”

See also: The importance of brain shape

Edward Dutton & Michael Woodley discuss Jordan Peterson

Tags

, ,

I’m enjoying this critical yet fair discussion of Jordan Peterson. Dutton as you may recall is best known for his scathing biography of J. Phillipe Rushton and Woodley is best known for his theory that genetic IQ has declined by 15 points since the Victorian era.