• About

Pumpkin Person

~ The psychology of horror

Pumpkin Person

Monthly Archives: December 2021

Time magazine’s most influential LIVING people of ALL TIME (2021 edition)

31 Friday Dec 2021

Posted by pumpkinperson in Uncategorized

≈ 47 Comments

(this list is incomplete and is being updated in real time)

METHOD

To make this list I looked at all the living people who had ever been Time’s person of the year, person of the decade, person of the century, or included on Time’s list of the 100 most influential people of the year, the century, or all time. Points were allotted as follows:

One of the 100 most influential of the year = 0.01 points

Person of the year: 1 point

Person of the year 1st runner up: 0.5 points

Person of the year 2nd runner up: 0.33 points, etc…

One of the 100 most influential of the century = 1 point

Person of the decade = 10 points

Person of the half-century = 50 points

Person of the century = 100 points

One of the hundred most influential people of all time = 50 points (since recorded history is 5000 years and there are 100 people)

If they shared any of these honors with someone else, the points got divided by the number of people. So for example James Watson got 1 point for being one of the 100 most influential people of the 20th century and got 50 points for being one of the 100 most influential people of all time, but since both honors were shared with Francis Crick, his total was 25.5 points making him the most influential living person ever (according to the collective wisdom of the World’s most prestigious magazine).

NUMBER 1: JAMES WATSON 25.5 POINTS

Launching the genetic revolution is the most influential event since the discovery of agriculture; actually more so because it will mark the end of our species. Woke Time magazine would be horrified that they accidentally told the truth in ranking an HBDer so high (by my scoring method, at least).

NUMBER 2: Mikhail Sergeyevich Gorbachev 13 points

Caused the collapse of the Soviet Union, dramatically changing the trajectory of World history.

NUMBER 3 & 4: THE LIVING BEATLES (12.75 points each)

Created the most loved art of all time, and inspired history’s most influential generation to change the World.

Number 5: Donald Trump 3.37 points

Woke Time magazine would be horrified to learn they’ve ranked Donald Trump above the media’s golden boy Barack Obama, especially since Obama was named person of the year twice and Trump only earned that title once. However the partial credits Trump earns from being runner-up so frequently allowed him to overtake his predecessor in cumulative influence. Whether for better or for worse, his impact on the World has been enormous.

Number 6: Barack Obama 2.11 points

Arguably the first black (or near-black) in recorded history to be the most powerful person on Earth. Helped bring dignity, pride, inspiration and status to an entire human race. Helped save America from war with Iran and helped make Israel a partisan issue.

Number 7: George W. Bush 2.04 points

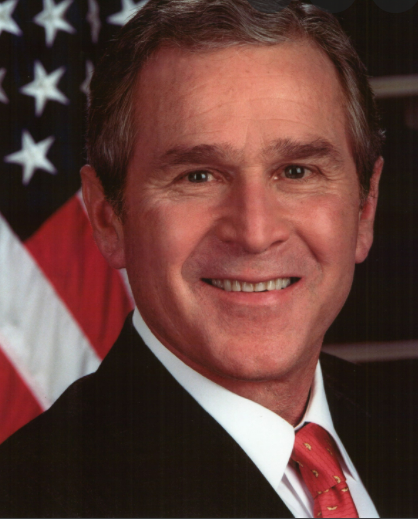
Was convinced by the neocons to invade the Middle East, which arguably was the beginning of the end for America’s status as the World’s sole superpower.

Number 8: Lech Walesa 2 points

He led a pro-democratic movement which in ended Communist rule in Poland helping to end the Cold War.

Number 9: Bill Clinton 1.535 points

Led the U.S. through a period of peace and prosperity. Helped make the Democratic party more friendly to business interests.

Number 10: Vladimir Putin 1.39

Helped Russia regain its status as a major World power and counter to U.S. dominance.

Number 11: Bill Gates 1.36

As an entrepreneur he helped launch the computer revolution & as a philanthropist, he changed the face of global health care.

Number 12: Oprah 1.1 points

Invented a more intimate touchy-feely form of media communication. Popularized a genre of talk shows that discussed taboo topics like addiction, infidelity and gays. By creating a culture of confession, helped lead millions of abuse survivors to recovery. Credited with bringing literature to the masses and helping put a black family in the White House.

Number 13: Angela Merkel 1.08 points

Transformed the face of Germany by welcoming a record number of refugees.

Number 14: Pope Francis 1.06 points

Shook up the church with huge symbolic change. Started a commission to look into the church’s sexual abuse problem.

Number 15: Jeff Bezos 1.05 points

Transformed the way we buy things, making shopping a store obsolete.

Number 16: Mark Zuckerberg 1.04 points

Helped lead the revolution from traditional media to social media.

Number 17: Elon Musk 1.04 points

Transformed the World by founding SpaceX in 2002, helping create alternative energy company SolarCity and Tesla, the world’s most valuable car company.

Number 18: Ben Bernanke 1.01 points

Changed U.S. monetary policy and led an effort to rescue the global economy in 2009.

Number 19: Steven Spielberg 1.01 points

Life magazine called him “our Homer and our Hans Christian Anderson,”; films like “E.T.,” “Jurassic Park” and “Schindler’s List.” have shaped the hearts and minds of millions.

Number 20: Robert Allen Zimmerman (Bob Dylan) 1.01 points

Created music that inspired the World’s most powerful generation to seek social change.

Number 21: Greta Thunberg 1.01 points

Inspired millions of humans to stand up for the environment.

Number 22: Jimmy Carter 1 point

Had an unusually peaceful presidency that impacted the World.

Number 23: Queen Elizabeth 1 point

Symbolized tradition for several generations in a changing World.

Number 24: David Ho 1 point

His scientific research helped millions survive AIDS

Number 25: Newt Gingrich 1 point

Led a conservative revolution, turning both houses of congress Republican in the 1990s for the first time in several decades.

Share this:

  • Twitter
  • Facebook

Like this:

Like Loading...

Just binge watched over 100 hours of Gilmore Girls

29 Wednesday Dec 2021

Posted by pumpkinperson in Uncategorized

≈ 30 Comments

I just watched all seven seasons, plus the unofficial season eight which aired on Netflix nine years after the official show ended. I am now an official Gilmore Girls expert.

The show revolves around Rory Gilmore and her mother Lorelai, two brilliant ultra upper-class beautiful young girls who grew up in the idyllic town of Stars Hollow, Connecticut. Because Lorelai had Rory as a teenager (a huge scandal for the upper class), the two look and behave more like sisters than like mother and daughter.

Because Rory, is too pretty, charming, intelligent and upper-class for Stars Hollow, yet is nonetheless super nice to everyone, the whole town worships her and is super protective when any guy tries to date her. Meanwhile, because her mother screwed up her life by getting pregnant as a teen (by an upper class boy), Rory’s grandparents are especially protective of Rory because they see her as their second chance to raise a daughter right, and make sure she attends Harvard, Princeton, or preferably Yale since that’s where granddad went.

One of the themes of the show is that no one is good enough to date Rory. Even when she gets a boyfriend who the town considers super tall and good looking, the grandparents humiliate him for not being a good enough student for their precious Rory.

It’s interesting that the only girl in Stars Hollow worthy of being friends with this cream of the crop pale skinned, delicate boned, blue eyed white girl is a second generation Korean immigrant named Lane Kim, (virtually the only non-white in the whole town) thus fitting Rushton’s theory that Orientals are genetically superior.

Lane eventually rebels from her strict religious mother and joins a rock band, while Rory heads off to Yale to become the super star journalist she’s destined to be.

The show has only one black character, Michelle, a stereotypical French gay man with a thick accent, who was supposed to escort Lorelai to Lane’s wedding, but blows her off to attend a Celine Dion concert. .

Michelle’s charming misanthropy and refusal to obey his boss Lorelai is reminiscent of the black butler Benson on 1970s sit-com Soap. Although he is flaming, it was still apparently too edgy to have a character who was both black and gay by the early 2000s so the show kept his sexuality unconfirmed until the unofficial season 8 in 2016.

One interesting thing about the unofficial season 8, which is set 10 years after the official series ended, is we discover Rory didn’t exactly live up to all that early promise. This fits with regression to the mean. Perfect and super brilliant kids tend to slide towards mediocrity in adulthood.

Share this:

  • Twitter
  • Facebook

Like this:

Like Loading...

Commenter Pill lacks social IQ

24 Friday Dec 2021

Posted by pumpkinperson in Uncategorized

≈ 103 Comments

Commenter Pill (aka Philosopher) lacks social IQ. He thinks that bashing another guy’s head with a beer bottle impresses women (seriously).

When he first said this years ago, I told him that such behavior would actually scare women, and former commenter Afro (who I disagreed with on many topics), but who was quite experienced with women, concurred.

But because of low social IQ, Pill simply ignored our advice, thinking he knew better.

So I decided to do a bit of research and found a study where male students from the University of South Florida were asked to estimate how aggressively the ideal man (as judged by women) would react to different scenarios.

Participants completed questionnaires alone or in small groups. The first part of this questionnaire asked participants to read three scenarios involving interpersonal conflicts between men, intended to present a variety of conflicts. In the version of the questionnaire given to men, participants were asked to imagine themselves as the victims in the confrontations. In the female version, women were asked to imagine themselves as observers of the altercations between the men. This allowed us to compare how men thought women would react to male aggression with women’s actual reactions. In the first scenario, a man gets bumped at a party and the man who bumps him calls him an ‘‘asshole.” In the second scenario a man and his girlfriend are repeatedly harassed while attending a
football game (female respondents were asked to imagine themselves as the girlfriend in this scenario). The third scenario described a couple at a mall food court whose seats are stolen, who
then get insulted when they try to reclaim them (women were again asked to imagine themselves as the girlfriend).

Following each scenario, men were asked … what a woman would think the ideal man should do.
For each question, respondents chose one of six behavioral responses that ranged from non-aggressive to progressively more aggressive: … 1.21 = Walk away without responding/Ignore it,
1.79 = Laugh it off, 3.79 = Make a verbal retort, 4.43 = Get in the guy’s
face without making physical contact, 5.04 = Push the guy,
6.00 = Punch the guy

men predicted that women would like more aggressive responses than women themselves reported preferring (men’s guesses about women = 3.47 [1.01]…women’s own responses = 2.65

Notice that punching the guy is a level 6 on the aggression scale, but pill thinks the most attractive response is smashing a guy’s head in with beer bottle which would be like a level 8. So Pill’s estimate is 4.49 SD higher than the average man’s which is already too high. But because university of South Florida men are likely somewhat above average in social intelligence, the true figure might be 4 SD on a more representative sample.

Of course there’s a lot more to social intelligence than judging appropriate levels of aggression so it’s unlikely that Pill’s overall social IQ is anywhere near as low as this study suggests.

It’s also unlikely Pill will be convinced his answer is wrong and instead will think a woman’s true response to male aggression can’t be measured by such an artificial study involving hypothetical scenarios. Indeed he will likely rationalize by thinking the study itself, and those of us who cite it, are socially unintelligent.

Share this:

  • Twitter
  • Facebook

Like this:

Like Loading...

Believing in God vs believing in life on other planets

22 Wednesday Dec 2021

Posted by pumpkinperson in Uncategorized

≈ 45 Comments

For generations, scientists have scoffed at the idea of God as a silly superstition, and yet if you ask these same scientists whether they believe in life on other planets, many would say something like “of course, when you consider the sheer numbers of habitable planets in the universe, the odds of alien life is extremely high”.

But you can’t calculate odds just from knowing the denominator; you also need to know the numerator, and so far we have only one example of life emerging from nothing (biogenesis): Earth. And until we find a second example of biogenesis, we don’t know if it’s a once in a solar system event, or a once in a galaxy event, or even a once in a universe event.

Scientists will say life began early in Earth’s existence, so this suggests it’s a common event. But the mere fact that Earth has intelligent life means it must have started early enough for our complex minds to have evolved, so the fact that life started early on Earth is just another way of saying complex life exists on Earth. Still tells us nothing about the probability of complex or even simple life existing anywhere else.

Since we have no way of knowing whether the denominator is small enough to make alien life probable, and it’s only one of two possibilities, there’s a 50% chance of alien life.

Thus agnosticism is the only intelligent answer to the question of life on other planets.

What about God? We have no way of knowing whether whatever events caused the universe did so intentionally, so perhaps there’s also a 50% chance of God existing.

So even though belief in life on other planets is considered way more rational than belief in God, both are equally probable. And yet, people who believe in alien life are almost certainly more intelligent on average. Probably because alien belief is generally arrived at through reasoning while theism is arrived at through faith.

Share this:

  • Twitter
  • Facebook

Like this:

Like Loading...

The IQs of Australian Aboriginals adopted by whites Part 2: Quantity Conservation

14 Tuesday Dec 2021

Posted by pumpkinperson in Uncategorized

≈ 201 Comments

In part 1 of this series I described an extremely important study where 35 children of varying degrees of Australoid ancestry, adopted into ordinary white homes in Adelaide, South Australia, were intelligence tested. One of the tests used was called “Conservation of Quantity” and is based on Jean Piaget’s theory that the human mind develops through stages. For example, very young children and very retarded adults, think that if you dump a cup of tea into a tall and skinny glass, causing the water to stretch out, you suddenly have more tea. They may also think that if you take some cookie dough and flatten into a really big circle, you suddenly have more cookie. Or they may think that if you take 4 pennies, and spread them apart on the table so they take up more space, you suddenly have more pennies.

However as the mind matures, we suddenly understand this is nonsense. Substances conserve their amount regardless of the form they take. What makes this a great intelligence test is that very few of us are ever taught conservation, but at a certain age we just get it, like the kid in this quick video.

An interesting question is do we get it because life experience teaches us, or do we get it because of the physical maturation of the brain? I suspect a toddler could play with water everyday for a year and never grasp conservation, but an adult, who was raised with no exposure to liquid (he drank only from a straw from a lidded cup and thus never saw it) or any other malleable substance, would immediately grasp it, simply because his brain was neurologically developed.

I don’t know the exact questions the kids in the study were asked but the results can be crudely inferred from the below graph. I may have to revise some of these numbers since reading from a graph is not an exact science, but it seems that at age eight, 87% of white kids tested in Canberra, Australia in 1969, grasped quantity conservation but only about 18% of Australian aboriginals tested the same year at Hermannsburg mission did. Assuming both groups formed a bell curve with similar variance, that suggests the Australoid bell curve is 2.07 standard deviations to the left of the white one.

At age nine, it seems 97% of white kids grasp quantity conservation, but only 38% of Australoids do, however among the Adelaide sample (largely hybridized Australoids adopted by whites), about 72% do. From these data, it seems the white > Australoid gap is 2.2 SD, while the white > mixed Australoids raised by whites gap is 1.3 SD. At age 10, there’s no data for the mixed race adopted Australoids, but only 27% of the traditional Australoids do while 97% of whites do, suggesting a gap of 2.47 SD.

At age seven, 67% of the whites grasped quantity conservation while 50% of the part-white Australoids adopted by whites did, suggesting a gap of 0.47 SD. The percentage of traditional Australoids who grasped it this young is too small to measure.

Source: Dasen, P. R., de Lacey, P. R., & Seagrim, G. N. (1973). Reasoning ability in adopted and fostered Aboriginal children. In G. E. Kearney, P. R. de Lacey, & G. R. Davidson (Eds.), The psychology of Aboriginal Australians, (pp. 97-104). Sydney: Wiley.

Averaging the data, the whites scored 2.25 SD higher than traditional Australoids, and 0.89 SD above the part-white Australoids raised by whites.

However the paper notes, “Canberra children, forming the comparison group for conservation of quantity, tend to come from relatively high-socioeconomic levels of the population”. By contrast the paper noted that the adopted part-white Australoids were raised by typical whites and I assume, the traditional Australoids were raised by typical Australoids.

In 2016, about 36% of the Canberra population (age 15+) had a Bachelor Degree level education or higher, compared to 22% for Australia as a whole. While I don’t have stats from circa 1970, assuming its education rank has been stable, the average Canberra adult was about 0.47 SD above the average Australian, and given about a 0.7 correlation between IQ and education, about 0.47(0.7) = 0.33 SD smarter than the average Australian, and given the 0.5 correlation between the IQs of parents and their kids, the children were likely 0.33(0.5) = 0.16 SD smarter than the average Australian (white kid).

So because Canberra kids were used as the white sample, we need to reduce their scores by 0.16 SD to adjust for their above average IQs. Thus the true white > traditional Australoid IQ gap becomes 2.09 SD (31 IQ points) and the true white > part-white & raised white Australoid gap becomes 0.73 SD (11 IQ points).

The IQ of Australoids raised by whites is an estimate of the genetic IQ of Australian aboriginals, and as mentioned, they score 11 points below whites. However because these had only 58% Australoid ancestry (on average) the expected IQ of an unmixed Australoid raised by whites would be 11/0.58 = 19 points below the white mean, or IQ 81.

Conclusion

On a scale where white Australians average IQ 100 (SD = 15) on a test of quantity conservation, the average unmixed Australian aboriginal likely scored about IQ 69 (1.9 percentile of the white distribution). However if raised in the same environment as whites, their IQ increases to 81, suggesting about 61% of the white > Australoid IQ gap is genetic. The effect of adoption at near infancy from a traditional fringe dwelling Australoid family into an average white family is to raise IQ by 12 points which is actually a lot considering how culture-fair conservation tests are thought to be (by some).

But perhaps not this one. The paper states: “the subject has to be able to justify his conclusions with fairly sophisticated explanations. Those children demonstrating conservation but unable to justify it receive a lower classification than those who can justify it”

Still, the effect of adoption is much less on this test than it was on the Picture Vocabulary test discussed in part one, so it’s a relatively culture fair test.

Share this:

  • Twitter
  • Facebook

Like this:

Like Loading...

Knowing (2009)

13 Monday Dec 2021

Posted by pumpkinperson in Uncategorized

≈ 55 Comments

Pumpkin Person rating: 8 out of 10

I just stumbled upon this movie on netflix last night and I think my readers might enjoy it as much as I did. The film begins 50 years ago, when a class of young children are drawing pictures of the future to be placed into a time capsule to be opened by kids at the school 50 years later. All the kids are following these instructions except for the one little girl who suggested this idea in the first place. Instead of drawing a picture of the future, she is rapidly filling her page with “meaningless” numbers like some kind of autistic schizophrenic.

50 years later a little boy is given this page when the time capsule is dug out of the ground and he shows it to his dad (played by Nicolas Cage), an atheist MIT professor who I estimate has an IQ above 150. Dad notices that part of the sequence says 200109112996 which he infers is the date of the 9/11 attacks, followed by the number of deaths. From there he infers that the page predicted every major tragedy of the last 50 years, and its final prediction is the end of the World. Can he save himself and his loved ones before it’s too late?

Share this:

  • Twitter
  • Facebook

Like this:

Like Loading...

The IQs of Australian Aboriginals adopted by whites Part I: Picture Vocabulary

12 Sunday Dec 2021

Posted by pumpkinperson in Uncategorized

≈ 25 Comments

In 1970 a most remarkable study was done. 35 Australian Aboriginal kids (57% female) raised by white families in Adelaide, South Australia since they were 1.5-years-old (on average), were intelligence tested. The kids ranged in age from five to 14 and ranged in ancestry from 100% Australoid to only 13% Australoid (about 58% on average). Unlike the Minnesota transracial adoption study where the adoptive parents were college educated, the “socio-economic status of the adopting families exhibited no obvious characteristics: they appeared to be representative of a wide cross-section of the South Australian population.”

This is good because it lets us see how a different race would score if reared in the typical white environment.

One of the tests given was the highly g loaded Peabody Picture Vocabulary test where the examiner says a word, and the subject points to one of several pictures that best represents that word. Below we see a chart comparing the mixed race adopted Adelaide Australoids to both white norms (standard scores from the test manual) and presumably unmixed and non-adopted Australoids tested at Hermannsburg Mission.

Dasen, P. R., de Lacey, P. R., & Seagrim, G. N. (1973). Reasoning ability in adopted and fostered Aboriginal children. In G. E. Kearney, P. R. de Lacey, & G. R. Davidson (Eds.), The psychology of Aboriginal Australians, (pp. 97-104). Sydney: Wiley.

The chart above suggests that unmixed, unadopted Australoids at age nine, 10, and 11 would have obtained raw scores on the PPVT (form A) of 37, 42, and 42. Using table 2 below I equate these to IQs of 44, 51, and 45, respectively (U.S. white norms). If these IQs sound absurdly low, keep in mind this is a vocabulary test and many of the unmixed unadopted Australoids perhaps did not speak English as their primary language.

Meanwhile at ages five, nine, 10 and 11, the mixed adopted Australoids have raw scores of about 44, 63, 65 and 95, corresponding to IQs of 88, 86, 85 and 118.

Osicka, C. J. (1976). Peabody Picture Vocabulary Test: Comments on administration and two methods of scoring. Psychological Reports, 38(3, Pt 2), 1135–1144. Using the first 4 rows I was able to roughly equate raw score mean and SD to IQ equivalent mean and SD, thus estimate IQ equivalent for any raw score in the given age groups.

On average the mixed adopted Australoids probably averaged verbal IQs of 94 (6 points below the white mean of the U.S., the U.K. and Australia) and considering they’re only 58% Australoid on average, unmixed adopted Australoids would likely have scored 90 (6 points below white mean/0.58 = 10 points below the white mean).

Conclusion

When raised in their own communities, unmixed Australoids seem to average about IQ 47 on English Picture Vocabulary (3.53 standard deviations below the white mean). But when raised in white homes they likely average IQ 90 (0.66 SD below the white mean). Thus this racial gap appears at most, only 19% genetic.

Challenges

Were the norms from the original PPVT valid for English speaking communities in 1970 Australia?

Given that the original PPVT was normed on several thousand white kids in and around Nashville, Tennessee in 1959, one might question its validity in 1970 Australia. A 1972 paper by L. J. Taylor , P. R. De Lacey & B. Nurcombe specifically set out to answer this question. They tested 60 Australian kids (mostly using form B) from age 4 to 10. Aside from age 4 where they included a lot of mixed Australoids in the sample, the average IQ at every age ranged from 91 to 112 or about 104 on average. So if anything the 1959 white norms from Nashville were perhaps 4 points too generous for Australians in the early 1970s, though even this slight inflation might be explained by the fact that the study translated three words on the test from American English to Australian English.

Did the IQs of the mixed race adopted kids decline in adulthood?

There was no follow-up study so we don’t how the adopted kids would have scored in adulthood, but in the Minnesota transracial adoption study, the IQs of adopted kids dropped between five to 13 points from age seven to 17. This drop was likely exaggerated by old norms in an at least one of the test sessions (and poor attempts to correct for the Flynn Effect), but to the extent that it was real, it was likely caused by the adoptive parents being upper-middle class. By contrast, in this study, the adoptive parents were more representative of the white population so the adoptees enjoyed the same environment as the average white kid, not benefitting from an upper class IQ boost that quickly fades.

[Update December 12, 2021: Thanks to a correction from an alert reader, some numbers in this article were substantially revised]

Share this:

  • Twitter
  • Facebook

Like this:

Like Loading...

contact pumpkinperson at easiestquestion@hotmail.ca

Recent Comments

pumpkinperson on The three grades of Homo …
Santocool on The three grades of Homo …
Name on The three grades of Homo …
The Philosopher on The three grades of Homo …
Santocool on The three grades of Homo …
The Philosopher on The three grades of Homo …
illuminaticatblog on The three grades of Homo …
pumpkinperson on The three grades of Homo …
The Philosopher on The three grades of Homo …
Lurker on The three grades of Homo …

Archives

  • January 2023
  • December 2022
  • November 2022
  • October 2022
  • September 2022
  • August 2022
  • July 2022
  • June 2022
  • May 2022
  • April 2022
  • March 2022
  • February 2022
  • January 2022
  • December 2021
  • November 2021
  • October 2021
  • September 2021
  • August 2021
  • July 2021
  • June 2021
  • May 2021
  • April 2021
  • March 2021
  • February 2021
  • January 2021
  • December 2020
  • November 2020
  • October 2020
  • August 2020
  • July 2020
  • May 2020
  • April 2020
  • March 2020
  • February 2020
  • January 2020
  • December 2019
  • November 2019
  • October 2019
  • September 2019
  • August 2019
  • July 2019
  • June 2019
  • May 2019
  • April 2019
  • March 2019
  • February 2019
  • January 2019
  • December 2018
  • November 2018
  • October 2018
  • September 2018
  • August 2018
  • July 2018
  • June 2018
  • May 2018
  • April 2018
  • March 2018
  • February 2018
  • January 2018
  • December 2017
  • November 2017
  • October 2017
  • September 2017
  • August 2017
  • July 2017
  • June 2017
  • May 2017
  • April 2017
  • March 2017
  • February 2017
  • January 2017
  • December 2016
  • November 2016
  • October 2016
  • September 2016
  • August 2016
  • June 2016
  • November 2015
  • May 2015
  • December 2014

Categories

  • ethnicity
  • heritability
  • Oprah
  • Uncategorized

Meta

  • Register
  • Log in
  • Entries feed
  • Comments feed
  • WordPress.com

Blog at WordPress.com.

  • Follow Following
    • Pumpkin Person
    • Join 651 other followers
    • Already have a WordPress.com account? Log in now.
    • Pumpkin Person
    • Customize
    • Follow Following
    • Sign up
    • Log in
    • Report this content
    • View site in Reader
    • Manage subscriptions
    • Collapse this bar
 

Loading Comments...
 

    %d bloggers like this: