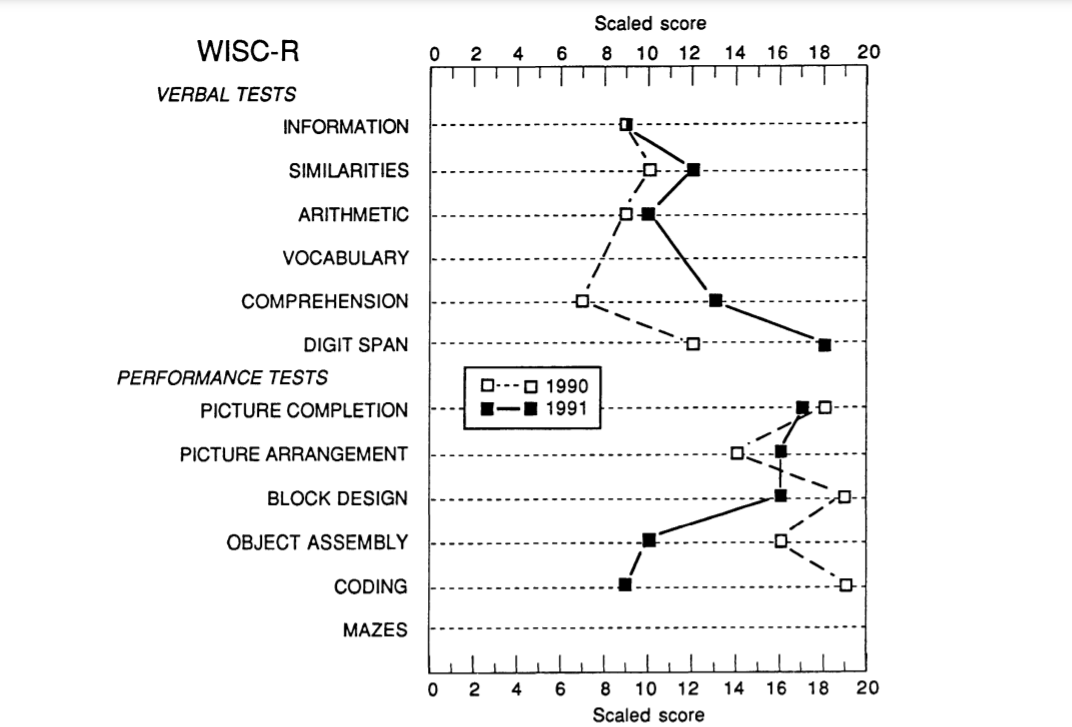
Interesting study about a girl with a 54 point gap on the WISC-R’s verbal and performance scale. When tested at 11, her verbal IQ was 96 and her performance IQ was 150! But when re-tested at age 12, her verbal IQ had jumped to 114 and her performance IQ had tumbled to 126, for only a 12 point gap.
Source: Lapierre, D., Braun, C. M. J., & Le Pailleur, L. (1992). A 54-Point Verbal-Performance IQ Discrepancy on the WISC-R: Cognitive Functioning of a Child from an Alternative School. Behavioural Neurology, 5(2), 97–106.
Interestingly, despite this massive change in cognitive profile, her full-scale IQ was virtually identical at both times (124 the first time, 122 the second time). This shows the incredible stability of the Wechsler full-scale IQ, even in the face of massive sub-test change. Probably because error in both directions cancels out when you have 10 diverse subtests.
The lesson is, whenever you see someone with a huge verbal-performance gap, it’s probably been exaggerated by error and the true gap is less extreme.
[update 2022-02-09: An earlier version of this article contained flawed logic which has been removed]
[update 2022-02-09: turns out the only flaw in my logic was thinking it was flawed; it appeared flawed but only because it was so subtle]
Many people do not understand why, if IQ is so genetic, the children of high IQ parents, regress to the mean. In fact, I was once told by a commenter on Lion’s blog that if IQ were 100% genetic, no regression to the mean would occur. His logic was we inherit 100% of our genes from our parents, so we should have the exact same genetic IQ as our parents.
But there also might be gene-gene interactions, so some genes might only boost IQ when they’re combined with other genes, so you might inherit only one of these genes from a parent, but without the other, it’s useless.
Below our my best estimates of the genetic IQs of many populations. Given the lack of precision, all estimates rounded to multiples of 5.
As one can see, there seems to be a pretty strong negative correlation correlation between IQ and skin colour. Those at the top of the totem pole are all light skinned. Those at the bottom are mostly dark skinned. This is likely because skin colour is a proxy for how far ones ancestors were able to migrate from the tropics and this likely would have selected for the cognitive ability to adapt to an environment unsuited to our African bodies.
It’s interesting that Arctic people have both lower IQs and darker skin than their ancestral climate predicts.
There also seems to be a negative correlation between antiquity and IQ. For example apes appear in the fossil record 25 million years ago and they average IQs of only 15. Ashkenazi Jews appeared only about 800 years ago and they average about 105.
Back in September I noted that Jewish children in Israel average Raven IQs of about 92 (U.K. norms) but by age 14.5 these increase to 95. Since it’s thought that Jewish IQ increases post-puberty, I take 95 as a good estimate for Israel’s adult Jewish IQ.
Unfortunately the data was not disaggregated by type of Jewish ancestry. An analysis by Hanna David and Richard Lynn found that in Israel, European Jews score about 14 IQ points higher than Oriental Jews though the gap is bigger on verbal tests. For example on the Israeli WISC, the gap was 1.1 standard deviations (SD) (17 IQ points) on verbal IQ but only 0.93 SD on Performance IQ (14 IQ points). It’s unclear what the Raven IQ gap would be more like verbal, performance or full-scale, but let’s split the difference and say 15 points.
Assuming 31.8% of Israeli Jews are Ashkenazi and they score 15 points higher than the non-Ashkenazi, then what would they need to score for the average IQ of all Israeli Jews to be 95? The answer is 105.
[Update 2022-02-06: Commenter Mug of Pee found a different source claiming 44.2% of Israeli Jews are Ashkenazi. Applying the same math to this figure put’s the Ashkenazi IQ at 103.]
So it seems at least in Israel and probably Serbia, Ashkenazi Jews have Raven IQs identical to those of East Asians. I can’t find any data on Ashkenazi Raven data in the United States, except for a small group of Ashkenazi prisoners who scored about 19 IQ points higher than the Gentile prisoners.
Just as Ashkenazim score 10 points higher than the average Israeli Jew, there is another group that scores 11 points lower. In his analysis of the Israeli military IQ data, James Flynn noted:
Recall that those not usually tested are predominantly from Orthodox homes of Eastern European origin, and they are known to have a lower IQ profile than the rest of the Jewish population (Judy Goldenberg, personal communication, 25 April 1993). Should there not be a large IQ gap between the usually tested and the usually not tested? In reply, that is exactly what the projection shows…The IQ gap between the usually tested and the usually not tested is a robust 10·7 points
Not usually tested by the military is what Flynn means. He’s referring to those who escape service through pregnancy or religious devotion. However they likely would be included in the age 14 Israeli Jewish average of IQ 95, I assume.
So to summarize there are three types of Jews in Israel: Ashkenazi IQ 103- 105, Middle eastern IQ 88 -90, and ultra-Orthodox IQ 84 (11 points below the military sample, which since it’s 98% Jewish, presumably scored 95). Of course these groups are not mutually exclusive because Orthodox can be either Ashkenazi or Middle easter though the group Flynn describes is of Eastern European ancestry.
[Update 2022-02-06: I crossed out my estimate for Orthodox IQ because I simply don’t believe they score that low. I may have made a logical error: Just because the people who are usually not tested are primarily Orthodox Jews, doesn’t mean the Orthodox Jews are primarily usually not tested, so I can’t necessarily infer the IQ of one from the other]
At least five years ago, I became perhaps the first person to try to estimate the IQ of Bushmen from the IQs of the races that gave rise to South Africa’s Coloureds. Commenter Someguy has also tried this but I assume he was inspired by me, but he’s so bright he may have thought of it independently.
But commenter Mug of Pee made an important point:
south africa’s coloreds in general aren’t the same as cape coloreds.
are they?
“colored” under apartheid did not just mean cape coloreds.
did it?
interesting that “kaffir” (a word borrowed from muslim slavers) is now like “[n word redacted by pp, 2022-02-05]”. but colored is still socially acceptable. just like in the US referring to blacks as “coloreds” had become offensive, but now non-whites are referred to with more than twice as many syllables with “people of color”.
it’s the stupidity stupid.
it’s the cape coloreds who are plurality bushman. the reason why the cape coloreds are koi-san is because when the dutch landed there were no bantus for like 500 miles in all directions.
and “khoesan” should be hyphenated. there’re two peoples, the koi and the san.
So who are the Coloureds who scored IQ 85 in K Owen’s 1992 paper on Raven IQ in South African standard seven school kids? “The coloured sample consisted of 778 pupils drawn from 20 coloured schools in the Cape Peninsula” he wrote.
The most authoritative source I could find on Coloured genetic admixture is Uren et al. 2017 which gives the following data:
Population structure and infectious disease risk in southern Africa. Mol Genet Genomics. 2017 Jun;292(3):499-509.
Ignoring the first study because it failed to separate Bushmen from other Blacks and averaging the most recent three, we get the following admixture levels: 30% Bantu, 34% Bushmen, 15% White, 7% Chinese and 14% South Asian. We know from Owen’s study (after I adjusted for 1991 HDI) that South African Bantu, Whites and South Asians had IQs of 80, 98 and 92 respectively.
The Chinese are usually said to have IQs around 105, however the Chinese ancestors of Coloureds were likely indentured labourers. Lynn (2006) noted that in the United States, the descendants of Chinese who arrived as labourers had IQs of only 101 so I’m adopting this as the best estimate for South Africa’s Chinese.
So contra Richard Lynn, it seems Bushmen are roughly as intelligent as the rest of sub-Saharan Africa. Their socio-economic disadvantage was caused by physical inferiority and distance from the civilized Arab World, and not from low genetic IQ.
In my last post I cited evidence showing South African Coloureds are 19% Bantu, 20% White, 8% East Asian, 22% South Asian, 28% Bushmen and 3% Southeast Asian. From this data I estimated Bushmen have a genetic IQ of 67 (UK norms), which if true, would be the lowest racial mean ever discovered.
However commenter “Some guy” provided alternative ancestry estimates which made me want to replicate my results using a different dataset.
…nearly 75,000 autosomal SNPs that could be compared with populations represented in the International HapMap Project and the Human Genome Diversity Project. Analysis by means of both the admixture and linkage models in STRUCTURE revealed that the major ancestral components of this population are predominantly Khoesan (32-43%), Bantu-speaking Africans (20-36%), European (21-28%) and a smaller Asian contribution (9-11%), depending on the model used. This is consistent with historical data.
Using the midpoint of each of these ranges, Coloureds genetic IQ = 0.375(Bushmen genetic IQ) + 0.28 (Bantu genetic IQ) + 0.245(White genetic IQ) +01(Indian genetic IQ)
Substituting my estimates for the genetic IQ of each of these South African ethnic groups (except for Bushmen which is least known):
This is much higher than the IQ 67 I reported based on somewhat different admixture levels. Of course in this study the data was directly reported while in the other one, I had to estimate it from a chart, though I did so very carefully.
More research is needed to determine whether Bushmen are a uniquely challenged population (genetic IQ 67) or whether they are just typical sub-Saharans (IQ of roughly 80) or somewhere in between. Answering this question is the closest we have come to knowing how smart the very first members of our species were.
The Bushmen are one of the most unique populations in the human species, having been genetically and culturally isolated from most other humans for tens, perhaps hundreds of thousands of years. And yet despite their incredible uniqueness and ancient splitting off date, almost nothing is known about their intelligence level; indeed political correctness prevents scientists from even asking the question.
Given that Bushmen split from the rest of our species before behavioral modernity appeared, their IQs hold the answer to questions that scientists have been asking for decades. Was the Upper Paleolithic Revolution (the sudden explosion of art and advanced tools some 70 to 40 kya) a cultural change or a genetic change?
With Bushman on the verge of extinction and political correctness only growing stronger, we may never be able to test more Bushmen, let alone raise them in white upper class homes and see if their scores improve, let alone scan whole genomes for IQ variants.
But fortunately the genetics of Bushmen are preserved in the South African Coloureds and the IQs of these have been well studied. They have a phenotypic IQ of 82 and, I estimate, a genetic IQ of 85.
Based on the above graphic, Coloureds are are 19% Bantu, 20% White, 8% East Asian, 22% South Asian, 28% Bushmen and 3% other. The other is probably Southeast Asians. In their book, The Intelligence of Nations, Lynn & Becker cite a 1996 study by Hadidjaja et al. in which samples of Indonesian kids obtained Raven IQs (corrected for Flynn effect) of about 80 to 86, or roughly 83. Given Indonesia’s 0.529 HDI in 1991, I used a technique to estimate their genetic IQs at 93. Meanwhile, I’ve estimated that South African Whites, Indians, and Blacks have genetic IQs of 98, 92 and 80 respectively. Armed with the genetic IQ of Coloureds (85) and the genetic IQs of five of the six races that compose their ancestry, and their relative proportions, solving for the fifth race (Bushmen) is simple algebra:
Coloureds genetic IQ = 0.19(Bantu genetic IQ) + 0.2(White genetic IQ) + 0.08%(East Asian genetic IQ) + 0.22(South Asian genetic IQ) + 0.28(Bushman) + 0.03(Southeast Asian IQ)