Since today is Halloween, I thought I’d discuss the IQ of the king of horror, Stephen King; probably the most successful writer in the history of the genre. When asked what his SAT scores were King replied, in the 1300s. During the the 1960s (when King would have taken the test) the SAT was much more difficult than today. I estimated that if the SAT had been given to all American 17-year-olds in the 1960s (and not just the college bound elite), the mean would have been 760 and the standard deviation about 245; thus a score in the 1300s implies an IQ of anywhere from 133 to 139 (U.S. norms). Let’s split the difference and say 136. That’s higher than over 99% of Americans and speaks to the powerful connection between IQ and creativity, even in a field as non-academic as horror.
To put King’s score in perspective, the average SAT score at Harvard (the most elite school in the World) in 1960 was 1373 equating to an IQ of 138, however Harvard students by definition scored high on the SAT or they wouldn’t be Harvard students so their IQs would likely regress to the 120s (on average) on a randomly selected test. By contrast, for King the SAT was a random test so his 136 would likely not much regress, leaving him to tower not only above 99% of Americans, but even above the average Harvard student!
How does King compare to other super successful writers? When Amy Tan, author of The Joy Luck Club was asked her SAT scores, she replied 1150, which, also in the 1960s, would have equated to an IQ of 124. Based on his memories of taking the WAIS-R I estimated that journalist, author and Fortune Magazine editor Daniel Seligman would have clocked in at IQ 128. JD Salinger scored 104 on an IQ test according to his biography though many find this hard to believe.
So on a scale where Americans average IQ 100 with an SD of 15, great writers seem to average around 119 with an SD of 13. Thus even in a field of creative super achievers, King is a king.
Great scene from Stephen King’s Creepshow (note the kid in the scene is played by King’s real son):
Twin studies predict that within a given (Western) country, up to 80% of the variation in IQ is heritable. And yet finding genes for intelligence appears to be analogous to finding intelligent life on other planets. We suspect they’re out there given the massive number of places for them to hide, but detecting them is the hard part. So far, out of the billions of genetic variants in the human genome, about 2,411 IQ “genes” have been found (with only about 127 of them being causal) and these explain only about 10% of the IQ variation within a Western country (not 80% like twin studies promised).
But these numbers should greatly increase as we use better measures of IQ (so far the largest studies use education level as a proxy for IQ since administering a million people a hour IQ test is much harder than just asking them their highest degree) and as genetic measures improve (so far the largest studies have only looked at a small fraction of the human genome).
Correlations: Individual vs group level
Currently polygenic scores correlate about +0.3 with IQ in Western countries (about the same as the correlation between IQ and brain size). While this correlation is not large, small correlations among individuals can become huge correlations among groups. For example, while the correlation between IQ and brain size is only about +0.3, the correlation between the average IQ and the average brain size of the 10 “races” studies by Richard Lynn in his 2006 book clocks in at 0.83! The reason for this is that as you move from individual to group level data, all the individual exceptions to a given trend tend to cancel one another out, and the underlying relationship becomes much more stark.
Applying the same concept to IQ “genes”, Davide Piffer found that the average polygenic scores of different races correlate about 0.9 with the average IQ of said “races”. So even though we’re a long way from being able to guess the IQ of an individual from his DNA alone, we can already make very reliable guesses about the average IQ of entire populations, or at least what their IQs would be if they were reared in contemporary America.
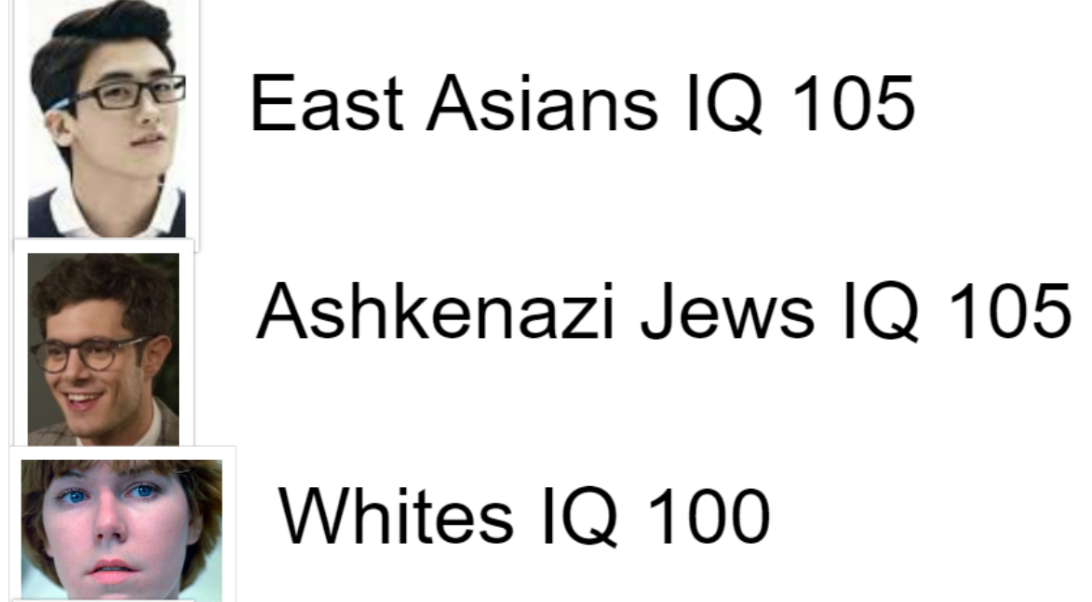
I turned to table 5 of one of Piffer’s paper (see appendix below) and noted the PGS GWAS sig scores of Northwest Europeans (IQ 100) and African Americans (IQ 85). Since the IQ gap between these two groups is thought to be 100% genetic (Lynn 2006), I simply equated their polygenic scores to their IQs, and using linear extrapolation, crudely assigned assign IQs to other groups in table 5. For example, since the polygenic scores of East Asians and Ashkenazi Jews were both about a third as far above Northwest Europeans as Africans Americans are below, I assigned them IQs that were as a third as much higher than the White mean defined as 100, as Black Americans are below (105 vs 85 respectively).
But since Black Americans are 15 IQ points below whites but only 75% bantu genetically, I assigned the congoid race an IQ 20 points below the white mean (15/0.75 = 20) which is 80, since they’re virtually 100% bantu. Then using Figures 5 and 11, I assigned Yoruba an IQ of 80 (since they’re Congoid) and the French an IQ of 100 (since they’re white) and by equating the polygenic scores of these groups to their IQs, I could linearly extrapolate to Arabs (Palestinians), Native Americans (indigenous Columbians), pygmies (mbuti), Australoids (Papuans) and Capoids (San). This method often gave wildly disparate IQs for the same race depending on whether I used figure 5 or 11 (perhaps because unlike table 5, these samples are low coverage genomes and thus unreliable) so I increased reliability by averaging. For example Papuans had an IQ of 81 using figure 5 but only 58 using figure 11, so I split the difference and assigned them IQ 70.
The first thing we notice is that the three light skinned races (East Asians, Ashkenazi Jews, and Whites) all have triple digit genetic IQs and the four dark skinned races (Pygmies, Congoids, Australoids and Capoids) all have genetic IQs below 90. The medium coloured races (South Asians, Arabs, Native Americans) are in between.
The next thing we notice is the geographically isolated races (Native Americans, Australoids, and Capoids) score lower than their skin color would predict while races that border a dark Caucasoid race (Arabs or South Asians) do not.
Conclusion
When modern humans first evolved a few hundred thousand years ago, we probably had (genetic) IQs around 70 (capoid level). Then when we finally left Africa about 70,000 years ago, IQ began to increase the further North we went, peaking at around 85 for those who reached Siberia (Native American level). Then sometime after the Native Americans colonized the New World about 15,000 years ago, there was a 10 to 20 point increase in IQ for everyone who bordered the Middle East or South Asia. This included the Congoids of sub-Sahara who jumped from 70 to 80 and the East Asians who jumped from 85 to 105. We don’t know specifically what selection pressures improved IQ by about 1 SD in the last 15,000 years but it looks like Native Americans (isolated in the New World), Australoids (isolated in Oceania) and Capoids (isolated on Africa’s Southern tip) were just too far away from the action, and that action was near the Middle East.
Whether it’s the birth of agriculture, the birth of civilization, or the start of Christianity and Islam, the Middle East has long been the contact place of different races and the land where history was written. Even today, wars in the Arab World, tensions over Iran, and the Israeli-Palestinian conflict dominate the news. It’s thus not surprising that our genetic history was written there too.
For years I’ve been defending Lynn’s rule (that cold winters selected for intelligence at least in humans) and people would find one or two exceptions (Ashkenazi Jews being smarter than Eskimos despite the latter evolving in a much colder climate) and declare the whole thing pseudoscience.
Yet these same people believe in Bergmann’s rule (cold winters selecting for bigger animals). And even when these people would admit that cold adapted people are smarter, they would give all the credit to Bergmann’s rule, insisting they’re only smarter because the cold selects for big brains, with intelligence just being a byproduct rather than having adaptive value in its own right.
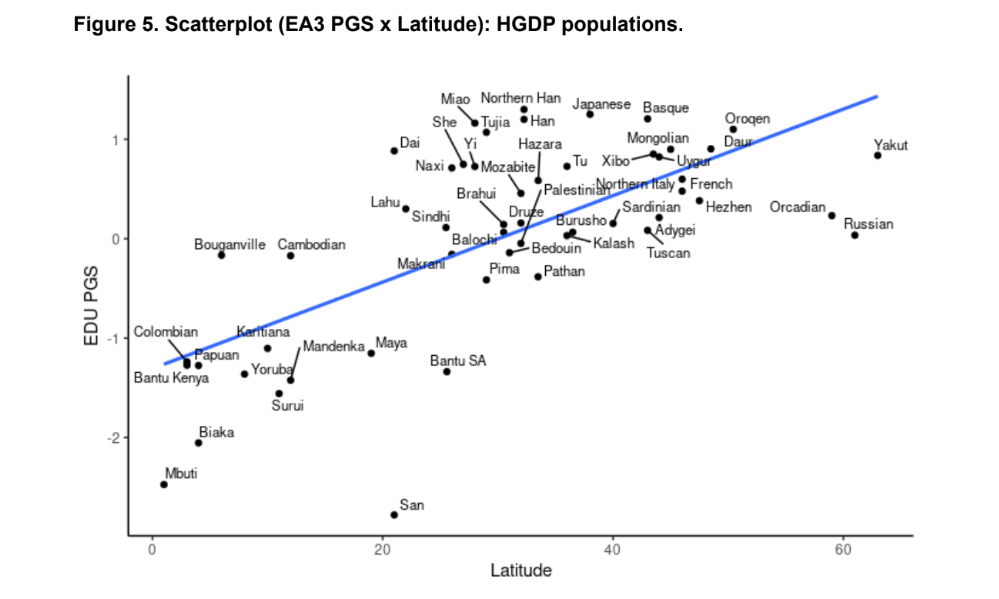
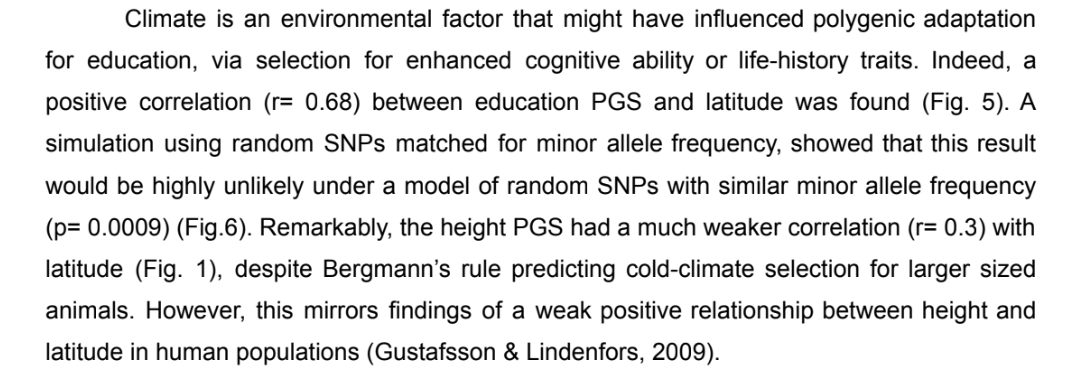
However Davide Piffer found that not only are education genes (a proxy for genetic IQ) strongly correlated with latitude at the population level, but they’re more than twice as so correlated as height genes!!! Piffer writes:
This shows that the high IQs of cold adapted people can not be explained by bigger bodies keeping us warm, and since bigger bodies have bigger brains, IQ is just a bonus. If that were the case, body size would better correlate with latitude than cognition does since it would be the direct cause. Instead it’s just the opposite! Surviving the cold requires intelligence, and since intelligence requires brain size which requires body size, big bodies are just a bonus.
In fact when it’s comes to the cold, there’s no evidence that body size has any adaptive value in its own right, and that’s because unlike other animals, we have intelligence which is your ability to adapt. When you yourself can adapt, you don’t need your body to do likewise. We didn’t need to evolve morphologically to survive the cold because we evolved culturally, except for that aspect of morphology that allows culture: brain size.
Of course this only undermines Bergmann’s rule (in humans). It’s still possible that Allen’s rule, which predicts that surface area to volume declines as a function of latitude, has some relevance in humans but don’t hold your breath.
For one brief moment in the late 1990s, Microsoft stock reached ridiculously high levels, and the media reported that Bill Gates was worth $100 billion USD making him the World’s first centibillionaire. So freakish was Gates’s achievement that It would take nearly 20 years years before another centibillionaire would appear when Jeff Bezos made the cut in 2017 (I’m ignoring Putin in this analysis because there’s no reliable info about his individual wealth).
However by circa 2020, Bezos was eclipsed by Elon Musk who became the first multi-centibillionaire (someone worth several hundred billion) when his net worth briefly his $340 billion.
Thus it’s interesting to ask who was richer? Gates in the late 1990s or Musk circa 2020. At first glance it would appear to be Musk because if you adjust for inflation, $100 billion in the late 1990s equals almost $163 billion circa 2020, which is less than half of Musk’s fortune of $340 billion.
However adjusting for inflation is just a crude way to compare buying power across time. It doesn’t really tell you the respective economic status each man had at his respective peak. For example, in 1982 Daniel Ludwig was the richest American with a net worth of $2 billion but adjusted for inflation that would be less than $6 billion circa 2020, which is less than 2% of Musk’s then fortune. And while it’s true that a 43% increase in U.S. population meant Musk had more competition to become the richest American than Ludwig did, that comes nowhere near explaining the 50 fold difference in wealth,
Commenter Philosopher once suggested using percentile ranks to compare wealth across time which is a good idea, but since both Gates and Musk were each the richest person in their respective eras, by definition they were both at the 100th percentile so this can’t break the tie.
Z scores
What is needed is the wealth Z score of each man: the number of standard deviations (SD) each man was from the mean of his era. A standard deviation is just a measure of inequality (a small standard deviation means most people cluster closely around the average while a large one means they are spread quite apart). It’s quite literally the standard amount people deviate.
It’s a fascinating statistic because it allows you to compare apples and oranges. For example if a weight lifter and a sprinter wanted to compare who was better at their respective sports, this would be hard to do because one sport measures success in weight lifted and the other measures success in seconds spent running. But if performance in both sports is converted into Z scores, such comparisons can be made. Or for example, if the average Canadian man and woman are 5’10” and 5’5″ with SDs of 3 and 2 respectively, a 5’9″ woman can claim to have a higher sex adjusted height than a 6’1″ man because the former is +2 SD for her sex (Z score = +2) while the latter is only +1 SD for his sex (Z score = 1).
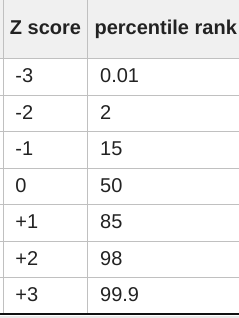
When variables are normally distributed (a bell curve) Z scores can be directly converted into percentile ranks, so for example:
For those who are new, the IQ scale is simple Z score * 15 + 100.
Natural logs
Now when it comes to net worth, there are problems with calculating Z scores because the distribution is so abnormal. For example in 2017, the three richest Americans had more wealth than the bottom 50% of the country. Thus it’s almost impossible to calculate how much the average American is worth because unless you do a census of the entire country, the inclusion or omission of just one centibillionaire will skew you’re sample’s average by orders of magnitude and unlike a normal curve where the mean and median are the same, the average American is actually orders of magnitude richer than the median American.
Now one solution statisticians use to deal with this problem is they transform net worth into its natural logarithm using calculators like this. Natural logs tend to fit the bell curve far better than raw wealth data. Let’s apply this concept to Gates and Musk.
The next step is to transform these natural logs into Z scores. To do this we must estimate the mean and SD for U.S. wealth natural logs in the years when Gates and Musk made wealth history. If we assume that natural wealth logs are roughly normally distributed, at least within 3 SD from the mean, then we simply assign the natural wealth logs at the 50th and 99th percentile the Z scores they would have on a normal curve: 0 and +2.33 respectively.
On a normal curve, a Z score of 0 is by definition the mean and by dividing the difference between the mean wealth log and the 99th percentile wealth log by 2.33, we can estimate the SD.
From here we can estimate that Gates, who had a natural wealth log of 25.33 in the late 1990s had a wealth Z score of +8.32 (8.32 SD above the mean) while Musk who had a wealth log of 26.55 circa 2020 had a wealth Z score of +7.65.
While both men have freakishly high Z scores, Gates was clearly far richer for his time than Musk was for his. To put it in perspective, Musk would need $1.25 trillion to be as rich circa 2020 as Gates was in the late 1990s.
Recently Musk’s SAT scores were reportedly revealed and while they equated to an extremely high IQ, like 99.9% of Americans, he was still in the biologically normal IQ range of 50 to 150 which is why he has lots of worshipful fan boys who can relate to him. Outside this range, people tend to be mutants.
Lucky for us normal humans, the high IQ mutants have their own freaky interests and so the richest and most powerful people tend to come from the pinnacle of the normal range (IQ 135 to 150): Musk, Bezos, Buffet, Soros, etc.
However once in a while, one of the 170 IQ mutants gets bored writing computer programs in his mom’s basement and with enough luck and hard work, decides to compete with the mere mortals and like an invasive species entering an eco-system not evolved to them, even the brightest normal humans are no match for the mutant who absolutely slaughters them at their own game because his IQ is just so much higher, and that is what we saw with Gates in the late 1990s, allowing him to become a centibillionaire nearly two decades before anyone else and be the richest American for 23 years .
Last Christmas I asked for the book Straight Talk about Mental Tests by Arthur Jensen and today was so beautiful I just sat by the lake all day reading it. I highly recommend this book to my readers. Unlike Jensen’s other books which are written for people with graduate degrees, this book is written for laymen, and while some readers may want something a lot more up to date, it’s remarkable how little the science has changed since 1981..
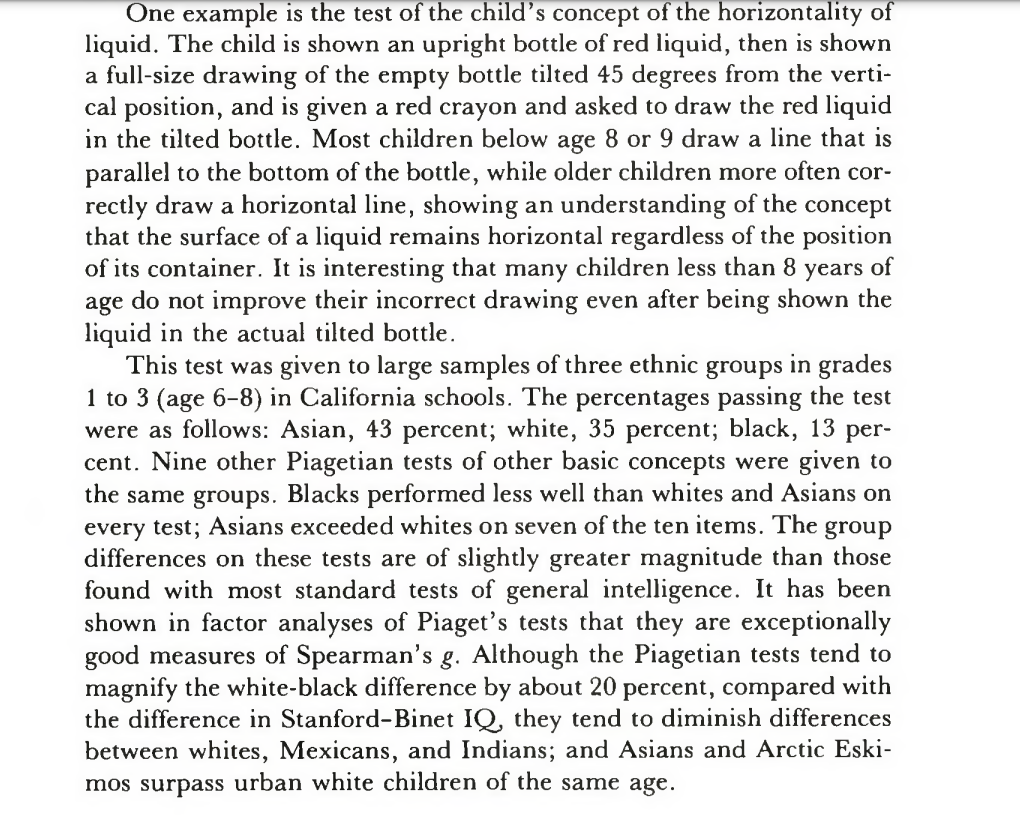
But one passage in particular caught my attention. It was about racial differences in Piaget tests. Piaget tests are remarkably good tests of IQ even though they come from a totally different branch of psychology and were not created with IQ in mind. Jensen writes:
This is the first time I ever heard of Arctic people scoring higher than whites on Piaget tests. Why didn’t Lynn mention this in his book? Instead he claimed that on a scale where whites average 100, Northeast Asians average 105 and Arctic people average 91. However if what Jensen says is true about Piaget tests, they would seem to be right up there with their Northeast Asian cousins and averaging 105 which makes sense given their huge brains and cold ancestral environment.
If true, this is excellent news because it suggests that an average IQ of 105 was present in the common ancestor of Arctic people and Northeast Asians which would mean the fully modern human mind pre-dated civilization.
This is the exact opposite of what scholars like Cochran, Harpending, John Hawks, and Peter Frost argue, which is that adaptive evolution increased a hundred fold in the last 10,000 years or so. Instead it is more consistent with what Gould and Richard Klein’s view that important evolution essentially stopped in the Upper Paleolithic.
From an Ayn Randian perspective, I find it far more romantic to think that after thousands of years ice age, triumphant man emerged fully modern from the wilderness to create civilization, then to think we were savages transformed into humanity by the modern world.
I like the idea of biological evolution reaching an end point and then cultural evolution taking over, but until Jensen’s uncited claims are verified, no strong conclusions are justified either way.