
[PLEASE PLACE ALL OFF-TOPIC COMMENTS IN THE MOST RECENT OPEN THREAD. THEY WILL NOT BE POSTED IN THIS THREAD]
[WARNING: THIS ARTICLE IS NOT AN ENDORSEMENT OF THE OLD SAT AS AN IQ TEST, IT SIMPLY EXPLAINS WHAT YOUR IQ ON THE OLD SAT WOULD BE IF THE SAT WERE AN IQ TEST. THE LINE BETWEEN IQ AND ACHIEVEMENT TESTS IS PARTLY SEMANTIC]
Many high IQ societies accept specific scores from the pre-1995 SAT for admission, as if all SATs taken before the infamous recentering in April 1995 had the same meaning. And yet Mensa, which only accepts the smartest 2% of Americans on a given “intelligence test” makes a curious distinction. Prior to 9/30/1974, you needed an SAT score of 1300 to get into Mensa, yet from 9/30/1974 to 1/31/1994, you needed a score of 1250.
Well, that’s odd I thought, since all SAT scores from the early 1940s to 1994 are supposedly scaled to reflect the same level of skill, why did it suddenly become 50 SAT points easier to be in the top 2% in 1974? And if such an abrupt change can occur in 1974, why assume stability every year before and since? It didn’t make any sense.
And I wasn’t the only one who was wondering. Rodrigo de la Jara, owner of iqcomparisonsite.com, writes:
If someone knows why they have 1300 for scores before 1974, please send an email to enlighten me.
The mean verbal and math SAT scores, if ALL U.S. 17-year-olds had taken the old SAT
To determine how the old SAT maps to IQ I realized I couldn’t rely on high IQ society cut-offs. I need to look at the primary data. Now the first place to look was at a series of secret studies the college board did in the 1960s, 1970s, and 1980s. These studies gave an abbreviated version of the SAT to a nationally representative sample of high school juniors. Because very few Americans drop out of high school before their junior year, a sample of juniors came close to representing ALL American teens, and then scores were statistically adjusted to show how virtually ALL American teens would average had they taken the SAT at 17. The results were as follows (note, these scores are a lot lower than the actual mean SAT scores of people who take the SAT, because they also include all the American teens who usually don’t):
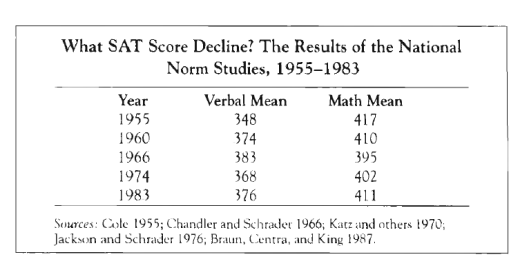
Table I
The verbal and math standard deviations if ALL U.S. 17-year-olds had taken the old SAT
Once I knew the mean SAT scores if ALL American teens had taken the SAT at 17 in each of the above years, I needed to know the standard deviations. Although I knew the actual SDs for 1974, I don’t know them for other years, so for consistency, I decided to use estimated SDs.
According to the book The Bell Curve, since the 1960s, virtually every single American teen who would have scored 700+ on either section of the SAT, actually did take the SAT (and as Ron Hoeflin has argued, whatever shortfall there’d be would be roughly balanced by brilliant foreign test takers). This makes sense because academic ability is correlated with taking the SAT, so the higher the academic ability, the higher the odds of taking the SAT, until at some point, the odds likely approach 100%.
Thus if 1% of all American 17-year-olds both took the SAT and scored 700+ on one of the subscales, then we know that even if 100% of all U.S. 17-year-olds had taken the SAT, still only 1% would have scored 700+ on that sub-scale. By using this logic, it was possible to construct a graph showing what percentage of ALL U.S. 17-year-olds were capable of scoring 700+ on each sub-scale, each year:
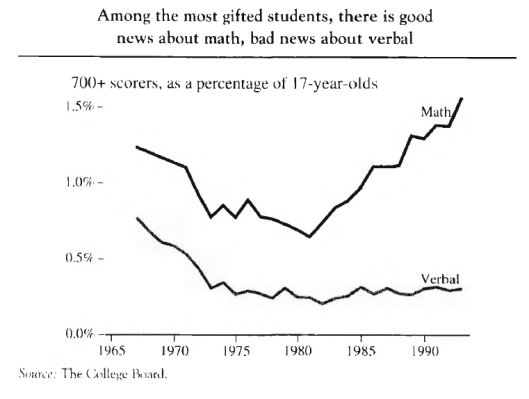
Figure I
What the above graph seems to show is that in 1966, a verbal score of 700+ put you in about the top 0.75% of all U.S. 17-year-olds, in 1974 it put you around the top 0.28%, in 1983 about the top 0.28% and in 1994 about the top 0.31%.
Similarly, scoring 700+ on math put you around the top 1.25% in 1966, the top 0.82% in 1974, the top 0.94% in 1983, and the top 1.52% in 1994.
Using the above percentages for each year, I determined how many SDs above the U.S. verbal or math SAT mean (for ALL 17-year-olds) a 700 score would be on a normal curve, and then divided the difference between 700 and each year’s mean (table I) by that number of SDs, to obtain the estimated SD. Because table I did not have a mean national score for 1994, I assumed the same means as 1983 for both verbal and math. This gave the following stats:
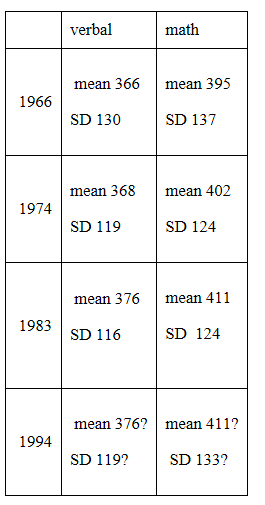
Table II: Estimated means and SD for the pre-re-centered SAT by year, if all U.S. 17-year-olds had taken the SAT, not just the college bound elite. NOTE: these are not ACTUAL SDs. These are the SDs you’d expect if the distribution were normal, given the mean score & the top 1% score.
Calculating verbal and math IQ equivalents from the old SAT
Armed with the stats in chart III, it’s very easy for people who took the pre-recentered SAT to convert their subscale scores into IQ equivalents. Simply locate the means and SDs from the year closest to when you took the PRE-RECENTERED SAT, and apply the following formulas:
Formula I
Verbal IQ equivalent (U.S. norms) = (verbal SAT – mean verbal SAT/verbal SD)(15) + 100
Formula II
Math IQ equivalent (U.S. norms) = (math SAT – mean math SAT/math SD)(15) + 100
Calculating the mean and SD of the COMBINED SAT if all U.S. 17-year-olds had taken the test
Now how do we convert combined pre-recentered SATs (verbal + math) into IQ equivalents. Well it’s easy enough to estimate the theoretical mean pre-recentered SAT for each year by adding the verbal mean to the math mean. But estimating the standard deviation for each year is trickier because we don’t know the frequency for very high combined scores for each year, like we do for sub-scale scores (see Chart II). However we do know it for the mid 1980s. In 1984, 23,141 people scored 1330+ on the combined SAT. Of course most American teens never write the SAT, so we’ll never know precisely how many could have scored 1330+, but Hoeflin argued that virtually 100% of teens capable of scoring extremely high on the SAT did so, and whatever shortfall there might be was negated by bright foreign test-takers.
Thus, a score of 1330+ is not merely the 23,141 best among nearly one million SAT takers that year, but the best among ALL 3,521,000 Americans who were 17 in 1984. In other words, 1330 put you in the top 0.66% of all U.S. 17-year-olds which on the normal curve, is +2.47 SD. We know from adding the mean verbal and math for 1983 in Chart I, that if all American 17-year-olds had taken the SAT in 1983, the mean COMBINED score would have been 787, and if 1330 is +2.47 SD if all 17-year-olds had taken it, then the SD would have been:
(1330 – 787)/2.47 = 220
But how do we determine the SD for the combined old SAT for other years? Well since we know the estimated means and SD of the subscales, then Formula III is useful for calculating the composite SD (from page 779 of the book The Bell Curve by Herrnstein and Murray):
Formula III

r is the correlation between the two tests that make up the composite and σ is the standard deviation of the two tests.
Formula III requires you to know the correlation between the two subscales. Herrnstein and Murray claim that for the entire SAT population, the correlation between SAT verbal and SAT math is 0.67 however we’re interested in the correlation if ALL American young adults had taken the old SAT, not just the SAT population.
However since we just estimated that the SD of the combined SAT if all 17-year-olds took the SAT in 1983 would have been 220, and since we know from Chart III that the 1983 verbal and math SDs if all 17-year-olds had taken the SAT would have been 116 and 124 respectively, then we can deduce what value of r would cause Formula III to equal the known combined SD of 220. That value is 0.68 (virtually the same as in the SAT population)*
Now that we know the correlation between the verbal and math SAT if all U.S. 17-year-olds had taken the SAT would have been 0.68 in 1983, and if we assume that correlation held from the 1960s to the 1990s, using the sub-scale SDs in chart III, we can apply Formula III to determine the combined SDs for each year, and of course the combined mean for each year is just the sum of the verbal and math means in chart III.

Table III: Mean and estimated SD if all U.S. 17-year-olds had taken the SAT, not just the college bound elite. NOTE these are not real SDs, but derived from the reverse engineered SDs in table I
Calculating full-scale IQ equivalents from the old SAT
Armed with the stats in Chart IV, it’s very easy for people who took the pre-recenetered SAT to convert their COMBINED scores into IQ equivalents. Simply locate the means and SDs from the year closest to when you took the PRE-RECENTERED SAT, and apply the following formula:
Formula IV
Full-scale IQ equivalent (U.S. norms) = (combined SAT – mean combined SAT/combined SD)(15) + 100
*Note: the IQ equivalent of SAT scores above 1550 or so will be underestimated by this formula because of ceiling bumping. See below for how to convert stratospheric scores.
Was Mensa wrong?
Based on chart IV, it seems Mensa is too conservative when it insists on SAT scores of 1300 prior to 9/30/1974 and scores of 1250 for those who took it from 9/30/1974 to 1/31/1994. Instead it seems that the Mensa level (top 2% or + 2 SD above the U.S. mean) is likely achieved by scores of 1250 for those who took the SAT close to 1966, and 1216 for those who took it closer to 1974. For those who took the pre-recentered SAT closer to 1983 or 1994, it seems Mensa level was achieved by scores of 1227 and 1249 respectively.
Of course all of my numbers assume a normal distribution which is never perfectly the case, and it’s also possible that the 0.68 correlation between verbal and math I found if all 17-year-olds took the SAT in 1983 could not be generalized to other years, so perhaps I’m wrong and Mensa is right.
And in Mensa’s defense, they were probably erring on the conservative side (better to turn away some Mensa level scores, than accept non-Mensa level scores). But it would be nice to know how they arrived at their numbers because it’s obviously way too simplistic to have only two Mensa cut-offs (one before and one after 9/30/74) for all the decades the pre-re centered SAT was used, given the fluctuations that occurred from the 1960s to the 1990s.
Extreme SAT scores in the mid 1980s
The above conversions were based on the assumption that the SAT would have a roughly normal distribution in the general U.S. population, which is likely true for 99% of Americans but likely false at the extremes.
Below is incredibly rare data of the total number of people in 1984 who scored high on the combined SAT.
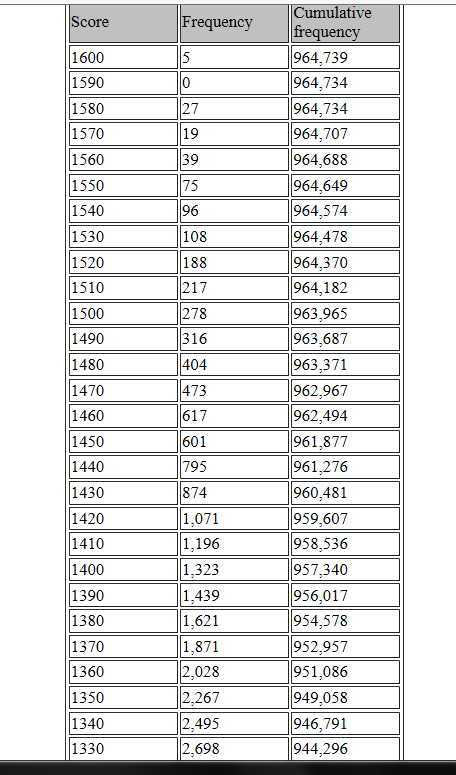
Table IV
We see that of the 3,521,000 Americans born in 1967, roughly 964,739 would grow up to take the SAT at age 17 in 1984. And of those who did, only 20,443 scored above 1330. If one assumes, as the great Ron Hoeflin does, that virtually all the top SAT talent took the SAT in 1984 (and whatever shortfall was madeup for by foreign students), then those 20,443 were not just the best of the 964,739 who actually took the SAT, but the best of all 3,521,000 Americans their age. This equates to the one in 172 level or IQ 138+ (U.S. norms).
Meanwhile, only five of the 3,521,000 U.S. babies born in 1967 would grow up to score 1590+ on the SAT, so 1590+ is one in 704,200 level, or IQ 170+. However above I claimed that in the mid 1980s, the combined SAT had a mean of 787 and an estimated SD of 220, which means 1590 is “only” +3.65 SD or IQ 155. Clearly the SAT is not normally distributed at the high extreme, so Z scores start to dramatically underestimate normalized Z scores, and modern IQ scales only care about the latter.
Thus, for extremely high SAT scores obtained in the mid 1980s, please use table V and not formula IV:
Table V:
| 1984 sat | iq equivalent(u.s. norms) based on normalized Z scores
(sd 15) |
| 1600 | 170+ |
| 1590 | 170 |
| 1580 | 164 |
| 1570 | 163 |
| 1560 | 161 |
| 1550 | 159 |
| 1540 | 157 |
| 1530 | 156 |
| 1520 | 154 |
| 1510 | 153 |
| 1500 | 152 |
| 1490 | 150 |
| 1480 | 150 |
| 1470 | 148 |
| 1460 | 147 |
| 1450 | 146 |
| 1440 | 146 |
| 1430 | 145 |
| 1420 | 144 |
| 1410 | 143 |
| 1400 | 142 |
| 1390 | 141 |
| 1380 | 141 |
| 1370 | 140 |
| 1360 | 139 |
| 1350 | 139 |
| 1340 | 138 |
| 1330 | 137 |
What if you scored extremely high on the old SAT in the 1990s, 1970s, or 1960s?
No precise solution is possible for these people until I get more data, but my tentative advice is to map your scores to the mid 1980s distribution and then use table V. For example, Bill Gates took the SAT circa 1973 and reportedly scored 1590. According to table III, 1590 was +3.68 SD in the mid 1970s, since the mean and estimated SD were 770 and 223 respectively . But in the mid 1980s, the mean and estimated SD were 787 and 220 respectively, so +3.68 SD would be 1597 which converts to an IQ of 170+ according to table V.
By contrast Chuck Schumer reportedly scored a perfect 1600 in the mid-1960s (though Steve Sailer is skeptical) which would put him at +3.43 SD according to table III. +3.43 equals 1542 in the mid 1980s according to table III, and that equates to IQ 157 in table V.
I am not suggesting that a 1600 in the mid-1960s reflects the same level of academic skill as 1542 in the mid-1980s, (the college board worked very hard to keep old SAT scores equal over the decades) but they may reflect the same percentile, relative to the general U.S. population of 17-year-olds, assuming the shape of the distribution stayed roughly constant, and the correlation between verbal and math did too. Because IQ is never an absolute measure of intelligence, only a measure of where one ranks compared to his age mates in a specific population (typically the general population of the U.S. or U.K. or just the white populations thereof)

It’s weird to think the SAT used to have such a high ceiling. Was the old SAT the hardest standardized test of all time? The old SAT was harder than the modern GRE or LSAT.
They keep renorming the test to make it easier. They last renormed in 2015.
I think the reason its ceiling is so high is that in the early 1940s, it was scaled such that the average test taker had a mean and SD of 500 and 100 respectively on both verbal and math. In those days SAT takers were pretty elite (only 5% at the most of young adults) and common vocabulary included a lot of words we today consider obscure. You combine these two factors (test taker selectivity & obscure old vocabulary) and you have a test that only one in a million U.S. young adults could score perfect on by the 1970s. I’m not suggesting people took the exact same test from 1942 to 1995, but I am suggesting that the college board tried to equate for difficulty over all that time.
However I do worry that I’m overestimating how high the ceiling is. I am following in the tradition of Ron Hoeflin, Murray & Herrnstein in assuming 100% of teens who would have scored super high on the SAT actually took the test (and whatever shortfall would be roughly balanced by foreign test takers) but I’ve also read that in the Midwest and the South, people take the ACT instead of the SAT, so perhaps a lot more people could have aced the SAT had they not taken the ACT instead.
But maybe people capable of acing the ACT almost always take the SAT too since it’s the more prestigious test.
I don’t think that many people took the ACT before the 1980s.
I took the SAT in 1984 (that chart above). Until the mid 1990’s the SAT was a way for extremely smart people to really show what they had. Getting above 1350 meant you were ready for the Ivies. With 1400+ you could shoot for the best ivies and 1420+ you could do MIT and Caltech. Someone with a 1440+ was flat out amazing in math and with great logical /verbal skills as well. They’re going to be doing PhD’s at MIT /Caltech etc or maybe a top medical school.
I recall one school mate scored 1600 in 1971. Dean was/is a brilliant guy.
I was pleased to score a 1400 combined result as a junior. It resulted in early acceptance
at several of my choices of colleges.
At that time one was required to put in a certain amount of days to receive a diploma,
so I goofed around with projects and a little tutoring to get my attendance requirement.
My SAT-IQ should be 148 even if I am just 113 on the wais.
I found out that processing speed is necessary for playing real-time strategy games with 50-100 characters on screen. I prefer slow open-ended games.
I recently had about augment (again) that “computers only follow rules, computes cannot be intelligent”.
I have a self-model of myself, I point inward into myself and I change model better myself and the world acting in both.
This person was able to learn computer programming but I am dumb and slow, I do not know how to program computers. I do not know how to draw comic books. But I understand from limited experience what drawing can ultimately look like and what program complexity in video games can ultimately be. I am creative in my abstraction. Some people are just robots and so they say computers only follow rules. They would say paint cannot create The Birth of Venus because the paint is only chemicals. Art does not come from chemicals. Art is impossible.
Intuition was seen as transcendent because it gave man the ability to create things that did not exist. A fully formed creations on its own that could not have come from experience but only deep within the unconscious born from inception.
An idea fully formed pop into your head that never existed but is unique original different from anything there ever was. A movie or painting that blows your mind. how the hell could this have been created, impossible? This is Intuition. These are my dreams sometimes.
Robots are robots but I can point inward and I see impossible invisible things.
I can conceive machines with code that visually swirl with glowing energy in directions that allow directional pointing inward that fold in such complex ways now doubts it would be sentient. Like a Hindu God with a thousand arms but nested inwards nonlinearly acting together.
Am I IQ 148 yet? or High on acid? or just has the kitty autisms?
Crystalized intelligence 145?
Fluid intelligence 105?
Cat, where are you getting that your SAT IQ is 148? You’re way too young to have taken the Old SAT.
My score 1470
Verbal 702
Math 769
http://www.iqcomparisonsite.com/greiq.aspx (1470 = 148)
Question.
Does an SAT IQ even make you smart at all since Gates is likely still by his age a real IQ of 170 but by my age a real IQ of 125? (by SAT conversion to real IQ)
1471*
all the SAT talk literally has 0 relevance to non-americunts, dont understand a thing about this
If you don’t understand then why be a troll? Just stay off the board.
Can you elaborate on your /2400 SAT to IQ chart? According to the chart if you have a combined M+R of 1130 you’d have an IQ of 116. 1130 barely breaks average, 116 seems a bit high.
Not sure what article you’re referring to.
What is the correlation between verbal reading section on the late 2000s SAT and WAIS verbal? I scored around 560 on the verbal reading on the SAT in 2009 but a 125 verbal on the WAIS.
that specific correlation is not known
By the old test (mid-1970’s), I scored in the 96th percentile and it correlates to an IQ 0f 132-133. I was an NMSQT finalist in CT. Today, a student needs 190 points more to qualify. Either kids today are brilliant, or the scoring has been watered-down so that 1400s are commonplace today.
Interesting to note that this is also correlated to Yale’s mean entrance SAT score. I would be in the 50% percentile. Too many people who are not college material are taking the SAT when they should be at community college retaking Algebra and Precalculus.
What was the SAT composite score that was in the 96th percentile?
what IQ is associated with a combined score of 1250 on the 1962 SAT?
My guess is IQ 130
I took the SAT in 1983 and acecdotally the numbers above correlate v well with actual IQ tests (I took official one that same year). Also the SAT was a very clear delineator of ability among the many classmates, friends and family members. Note that most of the people I’m referring to were *better* than me: it is not self serving to mention this but rather an analytical observation.
Hi Pumpkin,
One wrinkle to your high score correction factor: during my Freshman Week at Harvard (1982), in SAT conversations I was the only person who had only taken the test once. I was also reasonably unusual in not having had any kind of test prep (poor student from the boondocks). I’m willing to bet that the vast majority of your high scorers took the test multiple times, and that the vast majority of those beneath them did not. Your ‘ultra high scorers’ tend to have a lower true test result then you give them credit for. If you assumed (just for fun), that they each took the test three times and that this was their highest score, it would be interesting to know how much that would shift your iq conversion.
Congrats on getting into Harvard!
The research I’ve seen suggests test prep has little effect so it probably doesn’t matter whether the 5 people who scored 1590+ on their SAT in 1984 did so on their first, second or third try or with or without test prep. The real test prep was probably the schools they’ve attended all their lives and the parents they were raised by (since parents still have some effect on test scores by 17, especially vocabulary).
Now where this might be an issue is when the mean/median SAT score at Harvard gets reported. If Harvard let students cherry pick their best score from multiple attempts, then that mean/median might be misleading. On the other hand if they simply averaged across attempts, then not so much.
Thank you, pumpkin. It was life-changing. But yes, the multiple sittings was my main point. Harvard (I believe all schools) only takes your highest score and tosses the rest. The are (were) quite explicit about this, encouraging applicants to take the test multiple times. I was considered quite strange in having only taken it once.