• About

Pumpkin Person

~ The psychology of horror

Pumpkin Person

Monthly Archives: January 2019

A closer look at the Minnesota Transracial Adoption Study

30 Wednesday Jan 2019

Posted by pumpkinperson in Uncategorized

≈ 112 Comments

Tags

adoption, IQ, race

In the Minnesota Transracial Adoption study, white babies, black babies, and mixed babies (biological father black; biological mother white) were adopted into white upper middle-class homes when they were 19 months, 32 months, and nine months respectively. The purpose of the study was to determine how much of the 15 point black-white IQ gap in the United States is genetic.

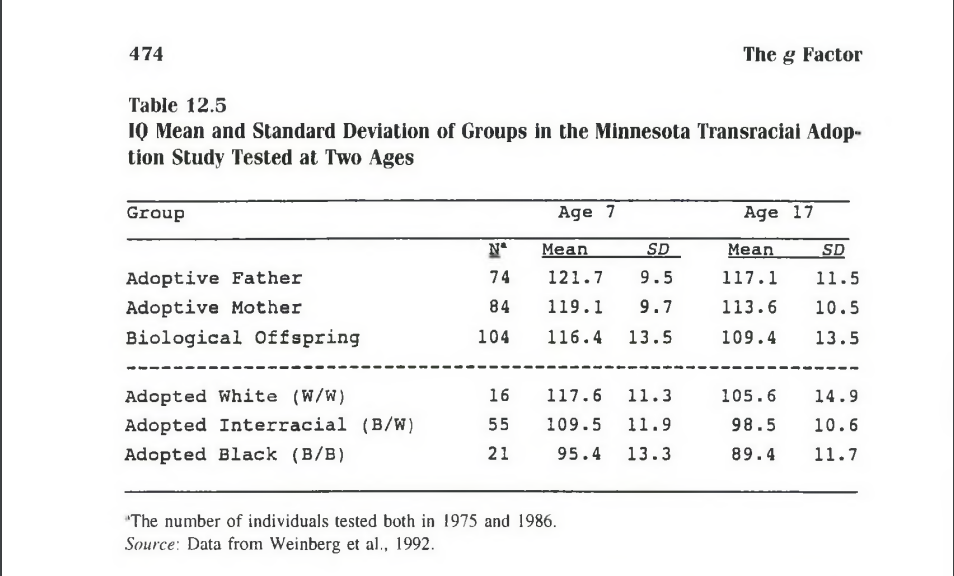
In 1975, the children and adoptive parents were IQ tested on at least an abbreviated versions of the Stanford Binet/WISC/WAIS (depending on age), and then retested in 1986 on the WISC-R/WAIS-R depending on age. Here are the results:

Source: page 474 of The g Factor by Arthur Jensen

Because the norms on all the tests were out-dated at the time of testing (especially in 1975), John Loehlin attempted to correct all scores for the Flynn effect.

Source: wikipedia

But many people ignore the IQs themselves, and instead just focus on the IQ differences. They see that at age 17, adopted whites scored 7.1 points higher than adopted mixeds in the unadjusted data, and 16.2 points higher than the adopted blacks, and conclude that the 15 point black-white IQ gap in the United States is roughly 100% genetic.

One problem with this is that black babies were adopted later than the non-black babies. Another problem is they were born to black mothers, while the non-black babies were all born to white mothers, so the prenatal and perinatal environments may have been quite unequal.

Thus I have always been more intrigued by the 7.1 IQ gap between the adopted whites and adopted mixeds. Since the adopted mixeds presumably had only half as much black ancestry as the typical U.S. black, it’s interesting that there’s roughly half the infamous 15 point black-white IQ gap, despite being gestated in white wombs and raised in white homes. Does this point to the importance of genetics?

Physicist Drew Thomas argues that the comparison between the adopted whites and adopted blacks is misleading because in the tables posted above, at both ages we only see data for the adopted kids who remained in the study for the follow-up testing in 1986. He argues that several low IQ adopted white kids dropped out of the study, and had they remained, the IQ gap between the adopted whites and adopted mixeds would have perhaps been only 3.5 points at age 17.

However this argument is starting to feel a little post-hoc. When you do a study, your data is what it is. You can’t adjust it for what it would have been had people you wished remained in the study. Almost any study can be debunked if we imagine how it would have turned out in a parallel universe where different people took part.

That’s not to deny that adjusting for attrition can be important in some cases, but in this study, Thomas argues attrition only increased the IQs of adopted whites and not the adopted non-whites. An effect that only affected one demographic sounds to me like random error, not a systematic bias that needs to be adjusted for. And if the error was random, one could just as easily argue the IQs of adopted whites were too low before the attrition rather than too high after the attrition.

Indeed if the adopted white sample is so easily skewed by a few kids dropping out of the study, then maybe that sample is too small to begin with, and instead we should compare the much larger sample of adopted mixeds not to the adopted whites, but to the general U.S. white population.

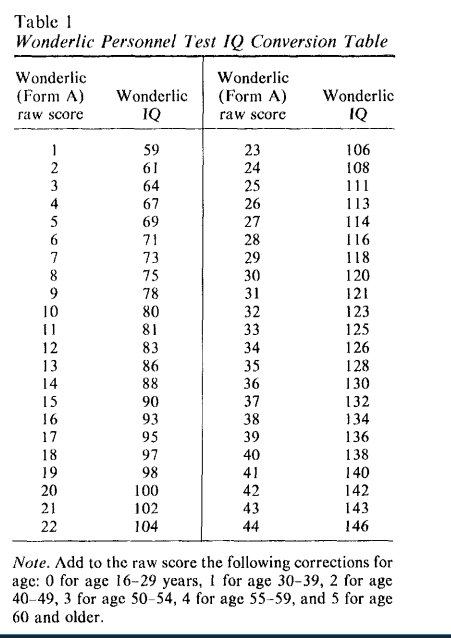
At an average age of 17, the adopted mixeds took the WISC-R and WAIS-R depending on age, and averaged 98.5 (93.5 after adjustments for the Flynn effect, since WISC-R and WAIS-R norms were 14 and 8 years old respectively at the time of testing).

However some top-secret research I’ve been slowly doing over the past decade suggests the Flynn effect has been wildly exaggerated, so while I don’t think their average IQ was as high as 98.5, I also doubt it was as low as the Flynn corrections say. Let’s split the difference and say 96 (U.S. norms).

By contrast, the whites in the WISC-R and WAIS-R standardization samples averaged 102.2 (standard deviation (SD) = 14.08) and 101.4 (SD = 14.65) respectively. Let’s split the difference and say 101.8 (SD = 14.4).

Thus converting to the more traditional scale where the U.S. white mean and SD are set at 100 and 15 respectively, the adopted mixed mean of 96 becomes ((96 – 101.8)/14.4)(15) + 100 = 94.

In other words, despite being gestated in white wombs and raised in upper-middle class white homes, having just one U.S. black biological parent appears to have reduced IQ by 6 points, suggesting that having two U.S black biological parents would reduce IQ by 12 points, suggesting that 80% of the 15 point black-white IQ gap in the U.S. is genetic. 80% squared is 0.64 which is similar to the 0.69 heritability of the WAIS full-scale IQ found in Thomas Bouchard’s study of identical twins reared apart, consistent with Jensen’s default hypothesis which claimed that IQ gaps between U.S. races are caused by the same nature-nurture mix that occurs within them.

To paraphrase President Obama, there is no black America or white America; from a nature-nurture perspective, there’s just America.

While this analysis seems to have controlled for the prenatal and family environment, it’ does not control for peer groups. Maybe as mixed kids raised in white homes, they were unmotivated on IQ tests because of the racist stereotype that being smart = acting white. On the other hand, they did better on scholastic tests than they did on formal IQ tests, suggesting motivation was not a problem.

If the genetic part of the U.S. black-white IQ gap is indeed 12 points and black Americans are only about 74% black on average it implies that 100% West African ancestry would reduce IQ by 16 points below the U.S. white mean (at least if we assume U.S. black ancestry is representative of West African ancestry).

And at least if we assume the Phenotype = Genotype + Environment model

Some readers invoke a reaction norm model where genotype A is higher IQ than genotype B in environment A, but lower than genotype B in environment B. Assuming such norm crossing occurs with IQ, my sense is that it would be limited to individual cases and cancel out in group level comparisons like the black-white IQ gap.

Some might argue that it’s inappropriate to compare adopted mixeds to the general U.S. white population because adopted mixeds might not be genetically representative of their parent populations. In The g Factor, Jensen states that the parents of the mixeds averaged 12.5 years of schooling (page 473) while just the mothers averaged 12.4 (page 478). From here we can deduce that the fathers averaged 12.6.

In 1975 America, white women and non-white men age 25+ had a median of 12.3 and 11.3 years of schooling respectively (see table 4 of this document). Comparable figures in 1986 were 12.6 and 12.5. So using education as a proxy, there’s no reason to think the mixed kids were selected to have lower IQs than the mean of their parent races. If anything, their biological fathers averaged more education than age 25+ non-white men throughout the full duration of the study and their biological mothers averaged about the same education as age 25+ white women.

Of course it would help to know the exact ages of the parents, rather than just lumping them in with everyone over 25. I can’t find the age of the biological parents of the mixeds specifically, but the bio moms and dads of all the kids who took part in at least part of the study (see table 3 of this paper) averaged 21.6 and 26.3 at the time the kids were born, and thus were about 29 and 33 in 1975 and about 39 and 43 in 1986, thus they were likely near the median age of the 25+ cohort by the end of the study.

Although this study shows the black-white IQ gap is highly genetic, several similar studies beg to differ. Tizard (1974) compared black, white and mixed-race kids raised in English residential nurseries and found that the only significant IQ difference favored the non-white kids. A problem with this study is that the children were extremely young (below age 5) and ethnic differences in maturation rates favor black kids. A bigger problem with this study is that the parents of the black kids appeared to be immigrants (African or West Indian) and immigrants are often hyper-selected for IQ (see Indian Americans).

A second study by Eyferth (1961) found that the biological illegitimate children of white German women had a mean IQ of 97.2 if the biological father was was a white soldier and 96.5 if the biological father was a black soldier (a trivial difference). Both the white and mixed kids were raised by their biological white mothers. One problem with this study is that the biological fathers of both races would have been screened to have similar IQ’s because at the time, only the highest scoring 97% of whites and highest scoring 70% of blacks passed the Army General Classification Test and were allowed to be U.S. soldiers. In addition, 20% to 25% of the “black fathers” were not African-American or even black Africans, but rather French North Africans (non-white caucasoids or “dark whites” as they are sometimes called). In addition, there was no follow-up to measure the adult IQ of the children.

A third study by Moore (1986) included a section where he looked at sub-samples of children adopted by white parents. He found that nine adopted kids with two black biological parents averaged 2 IQ points higher than 14 adopted kids with only one biological black parent but the sample size was quite small, I don’t know anything about the bio-parents and again, no followup when the kids were older.

Share this:

  • Twitter
  • Facebook

Like this:

Like Loading...

CNN special about triplets separated at birth tonight

28 Monday Jan 2019

Posted by pumpkinperson in Uncategorized

≈ 55 Comments

Watch on Sunday 9 pm Eastern, Jan 27.

Heritability is a major theme of this blog, so I’ll be watching, and live blogging in this post.

9:05 pm- one of the triplets bobby attends community college, everyone recognizes him as eddy, even though he has no idea who eddy is. so despite being separated at birth, end up at identical schools, suggesting education level is heritable

9:10 pm – discovers eddy is his long lost brother he never knew he had. meets brother and the look identical, suggesting looks are virtually 100% heritable

9:17 pm–third triplet david reads about bobby and eddy reuniting. they look just like him, so he realizes they’re his brother too. the three 19-year-olds meet and immediately hit it off.

9:19 pm__triplets go on Donahue circa 1981. answer questions in unison using same words.

9:26 pm —-bobby’s adoptive family upper class. dad a medical doctor and mom attorney and living in one of the most prestigious area of the country. eddy’s adopted dad a teacher in middle class neighborhood. david’s adoptive parents were blue collar with little store, little education, and immigrants with little english, but jewish?. none of the adoptive parents knew the boys they were adopting had clones.

9:35 pm–separated at 6 months. separation anxiety caused holding breath and banging head on crib. adopted from louise wise services, run by new york’s elite and the top east coast adoption agency for jewish babies.

9:41 pm__agency did not tell adoptive parents because they felt no one would want to adopt triplets so easier to place as singletons. adoptive parents furious, but boys didn’t care. were happy to be reunited and loving their celebrity and the party scene in NYC in the early 80s. Appeared in a madonna movie.

9:48 pm–met their genetic mother. disappointed that she was a drunk. moved on. started a restaurant called triplets to capitalize on their fame.

9:52-in the 90s they find out shocking truth by reading about a secret study! the real reason they were separated was scientific research. psychologists would spy on them and visit their house to give them IQ tests and film them! adoptive parents were told only that they were part of a study of adopted kids, but never told the real reason was it was a heritability study . Austrian holocaust refugee named peter heading study, ordered identical siblings to be separated and then watched and tested. results of study kept top secret.

10:10 pm__peter’s research assistant defends study, saying that in the 1950s and 60s it was consider okay to separate identical siblings. she was shocked to learn how heritable traits are.

10:19 pm __ all three brothers were mentally ill in their teens.

10:29 pm___eddy grows a beard, starts calling old friends he hasn’t spoken to in years at 2 am, and then shoots himself. david and bobby are devastated.

10:34 pm- dr. peter claimed study was funded by private charities and washington. 66 boxes of archives sealed at yale university until 2066. only way to access them is through the extremely powerful jewish board of family and children services. Adopted kids phone the board but are just transferred from one department to another without getting answers.

11:00 pm—as a result of this documentary, a 1000 pages of study released, but all the relevant info was redacted. some participants in the study may still not know they’re twins, that could be why study can’t be published.

11:01-documentary over and repeating.

Share this:

  • Twitter
  • Facebook

Like this:

Like Loading...

More thoughts on converting Wonderlic to IQ

21 Monday Jan 2019

Posted by pumpkinperson in Uncategorized

≈ 148 Comments

The Wonderlic is a 50 question test. Although most people find many of the questions easy, you only get 12 minutes which makes getting a perfect 50/50 almost impossible.

To my surprise, the Wonderlic correlated 0.9+ with the big kahuna of IQ tests, the WAIS, in a general population sample, which is really quite incredible for such a short test. In fact it seems too high to be true (maybe it’s an outlier; another study found a much lower correlation among the mentally ill, though the old WAIS was especially good at penalizing the kind of mental illness we find in my comment section ).

I recently cited data from page 6 of this article from no later than the 1970s, suggesting white Americans average 23.32 (SD = 7.5) on the Wonderlic Personnel Test (WPT).

However I worried that the average today might be much higher because of the Flynn effect.

However a 2006 study of production worker applicants found the white mean to be 21.81 (SD = 6.0). This convinced me that scores have not been going up on the Wonderlic in the general population (maybe they’re making the test harder to negate any Flynn effect?). I don’t think they’ve been going down either, but white production workers might be less intelligent than the general white population.

Thus I endorse the following formula for converting Wonderlic scores into IQ (U.S. white norms):

IQ (U.S. white norms) = [(wonderlic score – 23.32)/7.5][15] + 100

For those who prefer general U.S. norms I endorse the following formula:

IQ (U.S. norms) = [(wonderlic score – 21.75)/7.6][15] + 100

The second formula is based on a recent academic paper which states:

The average for working adults in the United States is 21.75, with a standard deviation of 7.6 (Wonderlic, 2000)

Some research suggests WPT scores should be adjusted for age in the following way before converting to IQ:

age 16 to 29: Add 0 points to your raw WPT score

age 30-39: Add 1 point

age 40-49: Add 2 points

age 50-54: Add 3 points

age 55-59: Add 4 points

Age 60+: Add 5 points

If you’re well over 60 you’re probably not taking the Wonderlic anyway, but you can extrapolate how many bonus points to add.

Of course some may question whether people taking the WPT are truly representative of Americans or white Americans. I would argue that they’re close enough. Yes, the sample excludes unemployed people who tend to have lower IQs but it also excludes students and rich people who tend to have high IQs, so it perhaps cancels out. And even gold standard IQ tests like the WAIS do not have perfectly representative samples since they exclude the institutionalized and those with psychiatric or substance abuse problems from their norms.

Though the WPT sampling bias might skew the results when estimating the scores of marginalized subgroups where unemployment is high.

Share this:

  • Twitter
  • Facebook

Like this:

Like Loading...

Converting Wonderlic scores to IQ

20 Sunday Jan 2019

Posted by pumpkinperson in Uncategorized

≈ 12 Comments

Commenter caffeine withdrawals writes:

You should do a post on NFL Wonderlic test scores, PP. And also come up with a Wonderlic-IQ conversion. Curious to see what you think the ceiling is.

The first thing I found was this:

Source:
An economical method for the evaluation of general intelligence in adults.

Carl B. Dodrill
Published 1981 in Journal of consulting and clinical psychology

Apparently these IQs were largely derived from very old data. Dodrill (1981) writes:

By using the detailed information on Wonderlic’s (1973) sample of 251,253 job applicants, Wonderlic raw scores were first converted to IQ scores having a mean of 100 and a standard deviation of 15 to conform to the distribution of WAIS Full Scale IQs. A preliminary IQ conversion table was set up… First of all, the Wonderlic IQ scores were low in comparison with the WAIS Full Scale IQ when the latter was about 90 or more. Corrections were therefore made in the IQ conversion table. Second, it was noted that there was no correction for age, so Wonderlic’s (1973) suggested corrections for various age groupings were followed. The result of these two types of corrections constituted the final IQ conversion table (Table 1).

Unfortunately, Dodril should not have corrected the Wonderlic scores because they were low compared to the WAIS. The WAIS was normed circa 1953 and the Wonderlic norms were from 1973, so people taking both tests in 1981 would be expected to score higher on the former than the latter, but no one knew about the Flynn effect in those days so it’s understandable.

However I found a paper by Arthur Jensen stating that in a nationally representative sample taking form IV of the Wonderlic Personnel Test (circa 1972?) whites had a mean of 23.32 with a standard deviation of 7.5. So using white norms (which were also used by the original WAIS):

IQ = [(wonderlic score – 23.32)/7.5][15] + 100

So assuming raw scores are normally distributed, the test’s ceiling should have been IQ 153 for a perfect 50/50 and the test’s floor should have been IQ 53 for 0/50. One might even add the age bonuses suggested in table 1 and say that a 60-year-old who scored 50/50 actually scored 55, so she would have an IQ of 163!

However my formula is based on circa 1972 norms and may not give valid IQs for people today. If this data can be trusted, the scores of Quarterbacks seem to be improving rapidly. A regression line predicting Wonderlic score as a function of year suggests that at least among QBs, raw scores have been increasing by 0.35 points per year. Either this test is extremely sensitive to the Flynn effect, or they’re recruiting from smarter demographics, or they’re using an easier version of the test, or cheating/test prep/lying/selective disclosure is increasing.

Share this:

  • Twitter
  • Facebook

Like this:

Like Loading...

Massive cheating on the SAT?

15 Tuesday Jan 2019

Posted by pumpkinperson in Uncategorized

≈ 71 Comments

I’ve blogged a lot about how Ivy League students regress precipitously to the mean when they go from the SAT to official IQ tests like the WAIS. The obvious explanation for this is that the correlation between these tests is far from perfect, but now I’m wondering if some of them even scored high on the SAT in the first place.

Several years ago 60 minutes did a story about one boy fraudulently writing the SAT for at least 16 other students, and the security was so poor that some of the students he impersonated were girls.

I wonder what percentage of Ivy League students got into their schools by having someone else write the SAT for them.


Share this:

  • Twitter
  • Facebook

Like this:

Like Loading...

Bill Gates might reclaim his throne as World’s richest human

14 Monday Jan 2019

Posted by pumpkinperson in Uncategorized

≈ 4 Comments

Recently, Jeff Bezos dethroned Bill Gates as the World’s richest human, however Lion of the Blogosphere writes:

It should be noted that Bezos got married one year before he started Amazon.com, so all of the stock in Amazon.com is community property. 50/50 split. No theatrics. Shares in a publicly traded company are pretty easy to split 50/50. The two parties could argue about the values of Bezos’ various mansions, but they probably won’t. When you’re getting almost 70 billion dollars worth of stock, why worry about whether one mansion is worth a few million more than the other?

As of today Gates is reportedly worth $94.9 billion while Bezos is worth is reportedly worth $135.3 billion, however if his wife takes half, Bezos will be left with only around $68 billion (depending on the value of Amazon stocks on the day she takes his money).

Bill Gates is probably the single best example of the SAT measuring real world intelligence, because here we have someone with a one in a million SAT score (equating to an IQ of 170) becoming the richest human on the planet for decades, and then even after giving away the title through incredible philanthropy, reclaiming it without even trying.

Meanwhile Oprah is probably the single best example of brain size measuring real world intelligence, because here you have a woman with a one in several billion head circumference (+6.3 SD above the female mean) climbing out of extreme adversity to become the World’s only black billionaire (from 2004 to 2007) and the World’s most influential woman.

And part of their success was their ability to avoid costly mistakes. As J.P. Rushton once stated:

All of us have success, all of us have failures; but high IQ people tend to end up further ahead in part because they make fewer mistakes.

Just as Bill Gates scored near-perfect on the SAT because he didn’t make many mistakes, in real life he avoided the mistake of having a costly divorce perhaps by choosing a woman of substance over a flashy trophy wife. Oprah too avoided that mistake simply by never marrying long-time live-in partner Steadman Graham, instead simply showing him as arm candy at award shows.


Photo / Kristina Bumphrey/ startraksphoto.com

Although Jeff Bezos likely has a slightly higher IQ than even Oprah (145 vs 140) and will always have far more wealth (though never as much influence or status) he made a HUGE mistake.

Share this:

  • Twitter
  • Facebook

Like this:

Like Loading...

The importance of brain shape

13 Sunday Jan 2019

Posted by pumpkinperson in Uncategorized

≈ 71 Comments

Today all human populations have the genetic potential to average IQs in the 85 to 105 range, with a species mean of say 97 (Euro norms). Scientists claim living humans have an average cranial capacity of around 1350 cc, but I believe this is way off, because unlike our well nourished ancestors, most modern humans have been malnourished since the neolithic transition. Even today, virtually everyone outside the developed World has sub-optimum nutrition.

Perhaps the best estimate of living human brain size under First World conditions is the average brain size in the U.S., since the racial diversity of this country mirrors the species as a whole.

The average young American has a cranial capacity of at least 1418 cc, with a within-sex standard deviation of 91 cc. The average is probably closer to 1438 cc since the data comes from the army who tend to be smaller than their civilian counterparts.

The correlation between IQ and brain size (among members of the same sex and country) is anywhere between 0.25 and 0.4, with 0.32 being my current best guess (it changes all the time). This means that for every one standard deviation (91 cc) difference in brain size, IQ differs by 0.32 standard deviations on average (the IQ scale has a standard deviation of 15).

If we extrapolate this logic to chimps, who average cranial capacities of 400 cc, which is 1032 cc or 11.34 SD less than the average human (under First World conditions) we’d expect an IQ that is 0.32(11.34 SD) = 3.63 SD less than 97 (the human mean under well nourished conditions).

In other words, chimps should have an average IQ of 43.

And yet that’s not what we find. Last March I wrote:

In 2007 there was a fascinating study that compared human 2.5 year-olds to chimps and other apes on a battery of intelligence tests.  With the exception of social intelligence, where the human toddlers were way ahead, the apes and toddlers had the same intelligence.

In other words, chimps have the same intelligence as a 2.5 year old (white) human.

What adult IQ does a mental age of 2.5 equate to?  The question is a lot trickier than it seems.  One could define adult mental age as 16+ and then use the age ratio method to conclude that since 2.5 is 16% of 16, a mental age of 2.5 equates to an adult IQ of 16.  The problem with this method is it assumes intelligence develops as a function of age in a linear way, which is an oversimplification.

What is needed is an actual intelligence test that’s been given to both adults and to toddlers and one where scores increase on an interval scale.

One such test is digit span.  Since the earliest days of intelligence testing (digit span has virtually no Flynn effect) it’s been known that by the age of three, a white child can repeat two digits, which probably means a 2.5 year old can repeat one digit.

By contrast U.S. adults average a forward digit span of 6.645 with a standard deviation of 1.35 and since races in the U.S. differ very little on forward digit span, this should be taken as the white adult distribution.  This means that an adult who performs like a 2.5 year-old (digit span of 1) is  4.18 standard deviations below the white adult average.

If we assume that most cognitive abilities are like digit span,  then chimps (who score like 2.5 years olds on most tested cognitive functions) perhaps average 4.18 standard deviations below white adults on the average test.

Does this mean their IQs average 4.18 SD below the average white adult?  No, because if you score 4.18 SD below white adults on the average test, your composite score on a battery of tests is actually much lower.  Why?  Because it’s much more rare to average an extremely low score across a battery of tests than it is  to score that low on any one test.  Indeed based on the intercorrelation of WAIS-IV subtests, someone who is 4.18 SD below average on the average subtest, would be 5.73 standard deviations (86 IQ points) below average on the composite score, thus my best guess for the average IQ of chimps is 14 (white norms).

So contrary to what I’ve said in the past, the regression line predicting IQ from brain size in humans, overpredicts chimp IQ by 29 points!

Their expected IQ is 43, but their actual IQ is 14.

This is because apes are not just small brained humans anymore than humans are big-brained apes. No matter how big a chimp’s brain gets, it will never be organized as efficiently as a human’s.

This is because the human brain is spherical which as commenter pumpkinhead noted, is a uniquely efficient shape because it minimizes the distance between any two points, thus maximizing communication between neurons.

This explains why Homo heidelbergensis, (600 ka to 300 ka) despite having a relatively large brain of 1280 cc, was virtually incapable of innovation. In their book The Rise of Homo sapiens: The evolution of Modern Thinking Frederick L. Coolidge and Thomas Wynn write:

…nothing much changed in Africa and Europe between 1.4 million years ago and 300,000 years ago. Hominins made the same types of stone tools they always had-hand axes and cleavers and a range of flake tools…

So despite having a near-human sized brain, Homo heidelbergensis was still an ape in my opinion, and so his expected IQ would fall on the ape regression line, not the human one, and thus his IQ was 29 points lower than an equally big brained human.

And similarly for Neanderthals.

One of these brains is not like the other. If you guessed #5, you’re a sphere brained modern human with the conceptual ability to answer such questions.
Source for image: https://answersingenesis.org/human-evolution/cranial-capacity-and-endocranial-casts/

It was not until 300 ka that incipient forms of H. sapiens appear and only then do we start to see a gradual transformation from ape shaped brains to the globular brains of fully modern humans, paralleled by a few isolated signs of human culture. It’s not until 100 ka to 35 ka is the brain transformation is complete and we get the upper paleolithic revolution, the neolithic transition and the ability to finally leave Africa and rapidly colonize the whole world and beyond.

The simplest explanation for this is that IQ genetically increased 29 points over this period, as we leaped from ape shaped brains to human shaped ones.

Share this:

  • Twitter
  • Facebook

Like this:

Like Loading...

Richard Klein & punctuated equilibrium

12 Saturday Jan 2019

Posted by pumpkinperson in Uncategorized

≈ 6 Comments

Punctuated equilibrium (also called punctuated equilibria) is a theory in evolutionary biology which proposes that once species appear in the fossil record the population will become stable, showing little evolutionary change for most of its geological history.[1] This state of little or no morphological change is called stasis. When significant evolutionary change occurs, the theory proposes that it is generally restricted to rare and geologically rapid events of branching speciation called cladogenesis. Cladogenesis is the process by which a species splits into two distinct species, rather than one species gradually transforming into another.[2]

Punctuated equilibrium is commonly contrasted against phyletic gradualism, the idea that evolution generally occurs uniformly and by the steady and gradual transformation of whole lineages (called anagenesis). In this view, evolution is seen as generally smooth and continuous

____Wikipedia, April 29, 2018

Although I agree with punctuated equilibrium, I sometimes think Stephen Jay Gould (one of the co-authors of this theory) specifically came up with it for the purpose of discrediting HBD.

Richard Klein is a clear believer in the punctuated equilibrium theory.  On pages 23 and 24 of his book The Dawn of Human Culture, he writes:

Each of the three or four punctuation events that we propose led up to the dawn of modern human culture occurred when human populations were small and geographically limited by modern standards. Each apparently occurred in Africa, and on present evidence, each appears to mark a coincidence of major biological and behavioral change. The first event occurred around 2.5 million years ago, when flaked stone tools made their initial appearance. These comprise the earliest enduring evidence for human culture, and their emergence probably coincided closely with the evolution of the first people whose brains were significantly larger than those of apes. The second event took place around 1.7 million years ago. The people this time were the first to possess fully human as opposed to ape-like body proportions, and they invented the more sophisticated stone artifacts that archeologists call hand axes. They may also have been the first to venture out of Africa. The third and most weakly documented event occurred around 600,000 years ago, and it involved a rapid spurt in brain size, together with significant changes in the quality of hand axes and other stone tools. The fourth and most recent event occurred  about 50,000 years ago and it was arguably the most important of all, for it produced the fully modern ability to invent and manipulate culture.  In its wake, humanity was transformed from a relatively rare and insignificant large mammal to something more like a geologic force.

I think Klein is more or less correct, but I might make a few revisions to his model in an imminent post.

Share this:

  • Twitter
  • Facebook

Like this:

Like Loading...

Responding to Nassim Taleb part 1

07 Monday Jan 2019

Posted by pumpkinperson in Uncategorized

≈ 81 Comments

Prestigious black national merit finalist G-man (and others) wanted me to comment on Nassim’s Taleb’s recent tirade against IQ.

It’s amazing how much publicity this issue is getting in the HBD community. Taleb is famous for attacking mathematical models and for attacking “intellectuals”, so it was only a matter of time before he attacked IQ.

But because a lot of Taleb’s fans are high IQ people who love numbers, and thus love IQ, they may be shocked that their hero doesn’t share their enthusiasm.

Taleb writes:

“IQ” is a stale test meant to measure mental capacity but in fact mostly measures extreme unintelligence (learning difficulties), as well as, to a lesser extent, a form of intelligence, stripped of 2nd order effects. It is via negativa not via positiva. Designed for learning disabilities, it ends up selecting exam-takers, paper shufflers, obedient IYIs (intellectuals yet idiots), ill adapted for “real life”. The concept is poorly thought out mathematically (a severe flaw in correlation under fat tails, fails to properly deal with dimensionality, treats the mind as an instrument not a complex system)

Well he’s right that intelligence tests were originally created to identify the learning disabled, not the brilliant, and that the concept was not mathematically well thought out (IQ was originally measured in mental age units, ignoring the fact that the developmental trajectory is not linear, and that newborn babies do not have zero intelligence). However neither of these problems strike me as especially important, especially since IQ testers admit their tests are ordinal scales (or at best interval scales) and not absolute scales. Meanwhile the ceiling on IQ scales have since been extended to better measure giftedness.

But Taleb seems to think the flawed mathematical model of IQ tests is a severe problem under fat tails. I wish he would elaborate on this point. Modern IQ tests are forced to fit a bell curve and when the variable being correlated with IQ does not have a perfectly Gaussian distribution (i.e. income), one can either normalize the distribution as I did here, or one can take the logarithm of income.

But maybe I’m missing the point. Taleb is famous for writing about black swan events:

A black swan is an event or occurrence that deviates beyond what is normally expected of a situation and is extremely difficult to predict. Black swan events are typically random and unexpected.

So maybe Taleb is talking about all the times IQ predictions go wildly wrong, like when when Richard Feynman scores “only” 125 on an IQ test, despite being one of the greatest physicists of all time. Perhaps he’s saying these events are so unpredictable they can’t be foreseen from the correlation between IQ and achievement using the bivariate normal distribution and thus render IQ tests useless in some of the most important cases.

IQ enthusiasts will counter that Feynman’s IQ can easily be explained by the fact that the test may not have measured math ability, however this supports Taleb’s point that test’s fail to “to properly deal with dimensionality”.

Taleb also has a point when he says tests treat “the mind as an instrument not a complex system” if he means what I think he means. Even the best IQ tests like the WAIS measure cognitive abilities in isolation and your final score is just a composite of all your strengths and weaknesses. But in real life, intelligence is a dynamic system that maximizes strengths and minimizes weaknesses. On an IQ test, you’ll lose points for sucking at spatial ability no matter how brilliant you are verbally, but in real life, your spatial disability is irrelevant if you’re smart enough to avoid spatial situations.

Don’t get me wrong; I’m still a huge IQ enthusiast, but IQ testing has room for improvement.

Share this:

  • Twitter
  • Facebook

Like this:

Like Loading...

Answering reader questions part 6

06 Sunday Jan 2019

Posted by pumpkinperson in Uncategorized

≈ 9 Comments

Commenter Mikey writes:

Pumpkin could you do me a solid and calculate my IQ based on my GED score? (I want Pumpkins opinion)

I dropped out of hi school after graduating from,the 9th grade. And was held back one grade, but it should have been 2 (my father convinced the school to let me pass)

I studied evolutionary psychology , along with other general social sciences nearly eery day for the next 4 years straight

I passed the GED exam. On my 1st try.
I was 19,years old,
My scores were

Language arts/writing. 440. 27th percentile rank
Social,Studies. 660. 95th percentile,rank
Science. 520. 58th percentile rank
Language Arts/reading. 550. 69th percentile. Rank
Mathematics. 480. 42nd percentile
Total score. 2650

Passing score is 2250 passing score in each category is 410

I grew up abused and neglected by family members, paternity uncertainty was a big factor for several years,single parent household I’m male but was raised as a woman had my 1st suicidal thoughts in elementary school,. Had to see the psychologist at the school because I wrote my mom only loved me sometimes, when we had to make a letter to our parents. my father was surprised when I told him I was straight at 13, one of the first girls I dated made me take my shirt off to prove I was a boy, I would occasionally be mistaken for a girl during puberty. Not so much after although I still had a “girls voice” My father came out to me saying he is bisexual when I was 19. Everyone in the family new, “hey son do you want to get your nails painted with me?” He asked me that twice when I was 13 ill never forget it.
My aunt is a lesbian, and my uncle has Autism,
At 16 my mom decided that starving me would change my behavior, it did not, I simply adapted to the caloric deficit. I bought multivitamins and supplements and began experimenting with liquid diets In order to survive.
I have been in handcuffs 5 times but never been booked or charged
I have been homeless more than a dozen times as a teenager.
One night was so cold if I had not stolen some gasoline from a nearby garage and made a bonfire out of a couple flower pots and tree leaves I wouldn’t have survived the night.
I took steroids for a few months at 18, because I knew I naturally didn’t have the moxy it would take to make it out of my situation, I ended up injecting myself with more than 10 times the average amount of testosterone as well as trenbolone and other roids in the hope of a long lasting permanent affect. My voice got permanently deeper, my aggression skyrocketed, I grew pecs permanent arm definition my face got wider and more scoelish and I grew a Windows peak. I essentially went thru a second puberty.
I ended up terrorizing my family into submission while holding down a 9 to 5 and got my crush from high school pregnant, and almost ahem “took care of” her whole family and mine too. The juice helped me turn my life around but desperate times had to call for desperate measures.

Despite these problems I never had any difficulty making friends although I do tend to get into a lot of fist fights thru out life even before the juice
I was diagnosed with ADHD at 14, and I really had it. To my surprise I grew out of all,of the Attention Deficit issues over a period of 6 months from age 20 and 6 months going into age 21 (symptoms vanishing into adult hood is actually the most common scenario according to a few studies I have seen) Now I have one of the longest attention spans any one could have. Also I never was a drug addict which I believe is a huge reason,why I grew out of that disorder. I now have an extraordinarily long, i would even say superhuman attention span because my brain is still hyperactive.
Im just laying out all the info maybe you would need for the most accurate analysis.

Well let’s focus on your GED scores where you averaged 530 on the total battery. According to some data I found, GED takers have a mean battery average of 519.9 with a standard deviation of 77.64.

This means you scored 0.13 standard deviations higher than the average GED taker. Of course the GED is not an official IQ test, but if one were to try to crudely map GED scores to IQ, one would need to know the IQ distribution of those who take the test. Those who take the GED are primarily a mix of those who remain high-school dropouts (IQ 88.77 [U.S. norms]) by failing the GED and those who get their GED and seldom more than than that (IQ 97.28).

The chart below shows the average IQ of various education levels:

Source:
WAIS-IV Clinical Use and Interpretation: Scientist-Practitioner Perspectives
edited by Lawrence G. Weiss, Donald H. Saklofske, Diane Coalson, Susan Engi Raiford

So on average, I would guess that people taking the GED average IQ 93 with a slightly restricted standard deviation of 13.5 (typical of people with similar education). Thus, if Mikey scored 0.13 SD above this group, it would equate to an IQ of:

0.13(13.5) + 93 = IQ 95 (U.S. norms) or IQ 92 (U.S. white norms)

Such a score would be higher than 37% of the U.S. population and 30% of the U.S. white population.

An IQ of 92 (white norms) is not low, it’s only 0.53 standard deviation below the white mean. A man who is 0.53 SD below the white mean in sex-adjusted height would be a respectable 5’8.5″.

Of course the GRE is NOT an official IQ test, and given your tumultuous upbringing, it’s quite possible that it dramatically underestimated your ability.

Even Arthur Jensen admitted that black kids raised in extremely deprived environments (i.e. rural Georgia) saw their IQs decline by 15 points. Given the adversity you describe, and given that you have a lot of high IQ interests, your true IQ could be 15 points higher than what your GRE scores equate to, so perhaps 107 (white norms).

On the other hand, if your IQ truly were 92, than a life of adversity is exactly what one would expect you to have, so it’s a chicken and egg problem.

Share this:

  • Twitter
  • Facebook

Like this:

Like Loading...
← Older posts

contact pumpkinperson at easiestquestion@hotmail.ca

Recent Comments

pumpkinperson on The three grades of Homo …
Santocool on The three grades of Homo …
Name on The three grades of Homo …
The Philosopher on The three grades of Homo …
Santocool on The three grades of Homo …
The Philosopher on The three grades of Homo …
illuminaticatblog on The three grades of Homo …
pumpkinperson on The three grades of Homo …
The Philosopher on The three grades of Homo …
Lurker on The three grades of Homo …

Archives

  • January 2023
  • December 2022
  • November 2022
  • October 2022
  • September 2022
  • August 2022
  • July 2022
  • June 2022
  • May 2022
  • April 2022
  • March 2022
  • February 2022
  • January 2022
  • December 2021
  • November 2021
  • October 2021
  • September 2021
  • August 2021
  • July 2021
  • June 2021
  • May 2021
  • April 2021
  • March 2021
  • February 2021
  • January 2021
  • December 2020
  • November 2020
  • October 2020
  • August 2020
  • July 2020
  • May 2020
  • April 2020
  • March 2020
  • February 2020
  • January 2020
  • December 2019
  • November 2019
  • October 2019
  • September 2019
  • August 2019
  • July 2019
  • June 2019
  • May 2019
  • April 2019
  • March 2019
  • February 2019
  • January 2019
  • December 2018
  • November 2018
  • October 2018
  • September 2018
  • August 2018
  • July 2018
  • June 2018
  • May 2018
  • April 2018
  • March 2018
  • February 2018
  • January 2018
  • December 2017
  • November 2017
  • October 2017
  • September 2017
  • August 2017
  • July 2017
  • June 2017
  • May 2017
  • April 2017
  • March 2017
  • February 2017
  • January 2017
  • December 2016
  • November 2016
  • October 2016
  • September 2016
  • August 2016
  • June 2016
  • November 2015
  • May 2015
  • December 2014

Categories

  • ethnicity
  • heritability
  • Oprah
  • Uncategorized

Meta

  • Register
  • Log in
  • Entries feed
  • Comments feed
  • WordPress.com

Blog at WordPress.com.

  • Follow Following
    • Pumpkin Person
    • Join 651 other followers
    • Already have a WordPress.com account? Log in now.
    • Pumpkin Person
    • Customize
    • Follow Following
    • Sign up
    • Log in
    • Report this content
    • View site in Reader
    • Manage subscriptions
    • Collapse this bar
 

Loading Comments...
 

    %d bloggers like this: