
In the chart at the bottom of this article, I estimate the phenotypic and genetic IQs of the 10 “races” described by Richard Lynn (2006). Lynn justified his racial taxonomy by citing the “10” genetic clusters noted by Luigi Luca Cavalli-Sforza.
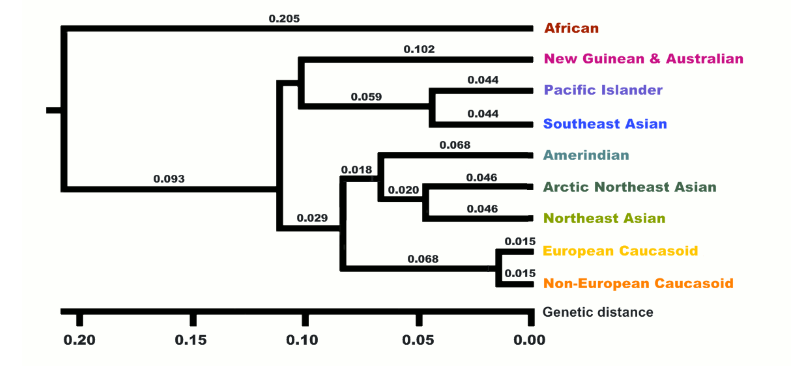
Actually there were only nine but Lynn took the liberty of replacing a single African cluster with two races, which I’ve very roughly labeled Congoids and Capoids respectively.
Locating samples
To estimate the phenotypic IQ of the 10 races, I focused on the country where each race has the most people. So for example, China is the country with the most East Asians, India is the country with the most dark Caucasoids, Nigeria is the country with the most Congoids, Germany is the country with the most Whites, not counting Russia because it’s not fully in Europe. If there was no good data in the country, I settled for the country with the second most people of a given race.
The reason I limited myself to one country per race is that it made it easier to correct the IQs for malnutrition to get the estimated genetic IQ since there are precise estimates of stunting rates in different countries.
Phenotypic IQ
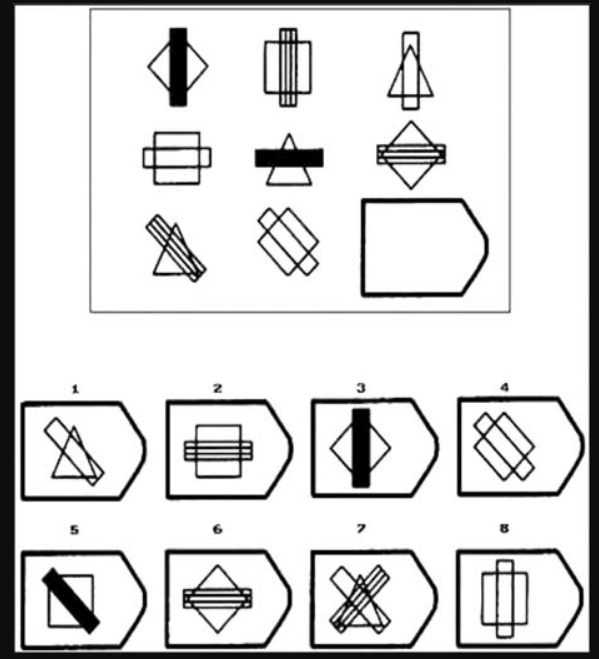
Phenotypic IQ is just one’s score on a an intelligence test that is arguably valid for the person taking it. In other words, phenotypic IQ is just IQ. All IQs are expressed relatives to the norms of whites in countries like Britain, the U.S. and Australia (or something approximating them). I chose the Raven Progressive Matrices (or Wechsler Matrix reasoning) as the most appropriate test because it’s been taken by roughly all 10 races, and is much less culture loaded than most IQ tests. The test is designed to minimize acquired knowledge and emphasize abstract reasoning, so a typical item has you pick which of the 8 choices at the bottom completes the pattern.
There is still some very subtle cultural bias which is why Dutch young adults reportedly gained 7 IQ points a decade for several decades but as Richard Lynn has argued (correctly in my opinion) such suspiciously huge Flynn effects largely vanish when you move from adults to school children where the effect of schooling is largely controlled, and the only gains you see are about 2 points a decade which is small enough to be explained by a genuine rise in biological intelligence (consistent with biological gains caused by nutrition that Lynn noted in other traits like height and brain size over the 20th century). How exactly schooling affects a test designed for even illiterates is unclear but the preponderance of evidence suggests that it does.
For this reason I limited myself whenever possible to IQ scores of school children (age 6 to 15) and from about 1980 to seldom after 2015 (since my main source was Lynn 2015). Prior to 1980 it was hard to analyze the effects of malnutrition because stunting data was scarce.
Another reason matrix tests were chosen is they’re a relatively pure measure of the general factor of intelligence (g). That’s not to say it’s a great test of g but rather it’s to say that it’s not especially biased to verbal or crystalized ability (which favors Jews) or spatial ability (which favors East Asians) or any other broadly defined ability tilt. It does have some spatial loading but it’s small enough that recent editions of the Wechsler scales exclude it from their spatial index score and instead classify it as “fluid reasoning” which many believe is g itself.
Genetic IQ
Just as the Flynn effect proved people got smarter when born in 1990 instead of 1890, people also get smarter when born in a a First World county vs the Third World. This is because as Lynn noted, suboptimum nutrition (including disease which prevents nutrients from being used) suppresses both IQ and height.
Thus genetic IQ is defined here as the IQ one would have if reared with first World nutrition.
Preschool children who are in the bottom 2% of the height distribution of well nourished populations are considered stunted. In rich countries like Germany, about 2% of pre-school kids are stunted but in say Nigeria, 43% were (more details in the chart below).
Thus to calculate the genetic IQ of Nigerians (and other groups afflicted by stunting), I noted that 43rd percentile of their early childhood height distribution matches the 2nd percentile of a well nourished population which implies a 1.8 standard deviation (SD) gap in height caused virtually entirely by nutrition (genetic effects are minimal in preschool kids and studies show that all the most populous races have identical early childhood height potential).
If malnutritioned stunted early childhood height by 1.8 SD, it perhaps did likewise to the developing brain and since brain size correlates close to 0.4 with IQ (Gignac & Bates, 2017) we’d expect Nigerian IQs to be stunted by 0.4(1.8 SD) = 0.72 SD or 11 IQ points. Thus Nigerian school kids average 70 on Raven IQ tests but their genetic IQ might be expected to average 81, which is almost as high as black American school kids score (which makes sense because black Americans are a well nourished sample of the same race).
Vincent 1991 reported three studies of Raven black-white IQ gaps in school kids the United States of 14, 18, and 7 points respectively. Averaging them suggests a gap of 13 points. But assuming that the white SD is only about three percent smaller than the U.S. SD, using the white SD instead of the U.S. SD does not increase the gap, so on a scale where whites average 100 (SD = 15), U.S. blacks average 87. Given that black Americans are 74% black on average, blacks who are 100% black (like those in Nigeria) should average 13/0.74 = 18 points below the white mean and thus average 82.
When we apply my method to Indians we get similarly plausible results. For example, the seven Raven IQ studies of Indian school kids Lynn (2015) cited showed a mean of 82 and the studies had a mean publication year of 1994. In the 1980s (when the kids in the average of these studies were under five), India’s stunting rate was an astonishing 66%. Since, the expected stunting rate if all the mainstream races were well nourished is only 2%, their developing bodies (and presumably their brains) were 2.46 SD below their genetic potential, and since brain size correlates perhaps 0.4 with IQ, their IQs are 2.46 SD(0.4) = 0.98 SD (15 points) below their genetic potential, suggesting their genetic IQ is 97. Lynn (2015) cited a most remarkable study by Mackintosh et al,, (1985) showing Indian school kids with fewer than four years of schooling in Britain had a mean non-verbal IQ of 83 (virtually identical to the mean in India) but those with over four years residence had a mean IQ of 97 (born with First World nutrition?). Assuming this study was not miscited, it further validates my method.
| Raven/Matrix IQs of each race | Psychometric sources | Sources for stunting data |
Pacific Islanders  Phenotypic: 98 Genetic: 98 Phenotypic: 98 Genetic: 98 | Dudley et al. (2022) found Maori 16-20 year-olds averaged a raw score of 19.08 on the Matrix reasoning subtest of the WAIS-IV which equates to a scaled score of 10. Since Canadians have about the same IQ distribution as whites in the U.S., I used them as the reference population, and since their WAIS-IV Matrix reasoning mean and SD is 10.4 and 2.9 respectively, an IQ of 98 is assigned. | Inwood (2016) noted that amoung those born since 1980, natives and white New Zealanders have the same height suggesting Maori in this study reached their genetic potential so no need to adjust their IQs for nutrition |
Whites  Phenotypic: 100 Genetic: 100 Phenotypic: 100 Genetic: 100 | The mean of five German studies of school kids cited by Lynn (2015) | First World nutrition; no adjustment needed |
Congoids  Phenotypic: 70 Genetic: 81 Phenotypic: 70 Genetic: 81 | The mean of three Nigerian studies of school kids cited by Lynn (2015). Mean publication year: 2000 | Nigeria Demographic and Health Survey (NDHS) 1990 found 43% stunting. |
Dark Caucasoids  Phenotypic: 82 Genetic: 97 Phenotypic: 82 Genetic: 97 | Lynn (2015) cites seven studies of school kids from India. Mean publication year: 1994 | In the 1980s (when the kids in the average of these studies were under five), India’s stunting rate was 66% |
Southeast Asians  Phenotypic: 87 Genetic: 99 Phenotypic: 87 Genetic: 99 | One 1998 Indonesian study of school kids cited in Lynn (2015) | According to Indonesia Family Life Survey (IFLS) Wave 1 (1993), about 51% of Indonesian children aged 2.0–4.9 were stunted |
East Asians  Phenotypic: 104 Genetic: 108 Phenotypic: 104 Genetic: 108 | Lynn (2015) cites three Chinese studies of school kids with a mean year of 1995 | the stunting rate in China circa 1990 was 33% (figure 5.2), However if the sample was drawn overwhelmingly from the cities, which seems likely, then the 9.4% stunting rate for urban areas might be more appropriate |
Arctic people  Phenotypic: 80 Genetic: 94 Phenotypic: 80 Genetic: 94 | One 2014 Russian study of school kids cited in Lynn (2015) | In 1995, 61% of Evenki kids were stunted (Leonard et al., 2002) |
Native Americans  Phenotypic: 87 Genetic: 97 Phenotypic: 87 Genetic: 97 | One 1995 study in Peru cited by Lynn (2015) | In 1990, the stunting rate in Peru was 37% |
Australoids  Phenotypic: 85 Genetic: 91 Phenotypic: 85 Genetic: 91 | Chaffey et al., ~2002–2003 tested 79 Aboriginal children in Years 3–5 (roughly ages 8–11) from rural schools in northern New South Wales and found their average raw score was at the 27th percentile on Australian norms (table 2). Although the Australian norms were from 1989, Cotton et al. (2005) found the Raven Flynn effect in children has been nil since 1975 & Flynn (2009) found similar results in Britain. The 27th percentile equates to an IQ of 91, but since Australian norms might be 1 point below white norms, an IQ of 90 is assumed. But because a study by McEvoy et al. (2010) found Australian aboriginals average only 66% aboriginal ancestry (see figure 4) being 10 points below IQ 100 becomes 15 points below 100 in a “pure” sample in the same environment, so 85 | Ruben and Walker (1995) found stunting rates (only stunted + stunted & wasted) in rural Australian aboriginals to be 23% in a hospital sample which implied a minimum of 8% (since only about a third were hospitalized). Splitting the difference between the maximum estimate which assumes the hospitalized have the same stunting rates as all Australian aboriginals and the minimum estimate (assuming only hospitalized Australoids are srunted) gives an estimate of 16% |
Capoids  Phenotypic: 77 Genetic: 85 Phenotypic: 77 Genetic: 85 | A study by Owen (1992) reported Raven scores in South Africa with huge samples of Whites, Indians, Coloureds, and Congoids. Many sources misreport their IQs but my careful analysis found these to be 98, 92, 82, and 69 respectively. Because Indians and Congoids in South Africa score 5 and 12 points below their genetic potential respectively, I estimated Coloureds, who have living standards intermediate between these two likely also underdeveloped to an intermediate degree, implying their genetic IQ is 8 points above 82. In other words 90. Lankheet et al., (2025) reviews studies of Coloureds (mostly from Cape Town) and from the range mid-points made to add to 100%, their ancestry appears to be 30% Capoid, 28% Congoid, 14% Asian (South and Southeast) and 28% White. As we saw above, the latter three have mean genetic IQs of 81, about 98 and 100 respectively so for Coloureds to average a genetic IQ of 90, Capoids must average one of 85. Since their genetic IQ is 5 points below the Coloured genetic IQ, the subset of “Coloureds” who are pure Capoid likely average 5 points below the Coloured phenotypic IQ too, hence phenotypic IQ of 77 | Can’t be directly measured because Capoids (including hybridized Capoids like Coloureds) are too genetically distinct to attribute extreme short stature to malnutrition (even before age five when environment dominates) but in South Africa they were likely less nourished than Indians but more nourished than Congoids |

