
In the chart at the bottom of this article, I estimate the phenotypic and genetic IQs of the 10 “races” described by Richard Lynn (2006). Lynn justified his racial taxonomy by citing the “10” genetic clusters noted by Luigi Luca Cavalli-Sforza.
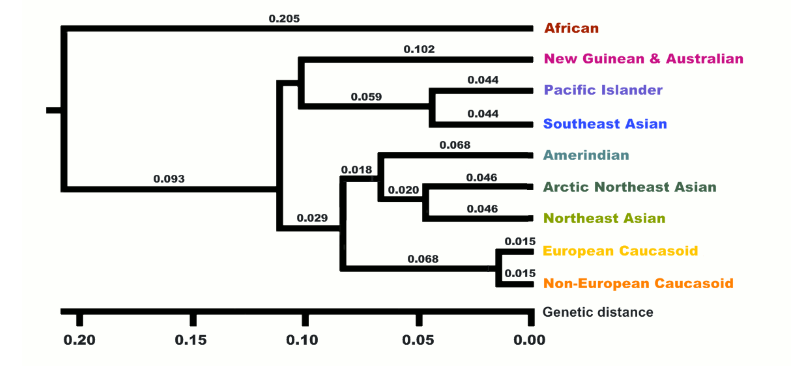
Actually there were only nine but Lynn took the liberty of replacing a single African cluster with two races, which I’ve very roughly labeled Congoids and Capoids respectively.
Locating samples
To estimate the phenotypic IQ of the 10 races, I focused on the country where each race has the most people. So for example, China is the country with the most East Asians, India is the country with the most dark Caucasoids, Nigeria is the country with the most Congoids, Germany is the country with the most Whites, not counting Russia because it’s not fully in Europe. If there was no good data in the country, I settled for the country with the second most people of a given race.
The reason I limited myself to one country per race is that it made it easier to correct the IQs for malnutrition to get the estimated genetic IQ since there are precise estimates of stunting rates in different countries.
Phenotypic IQ
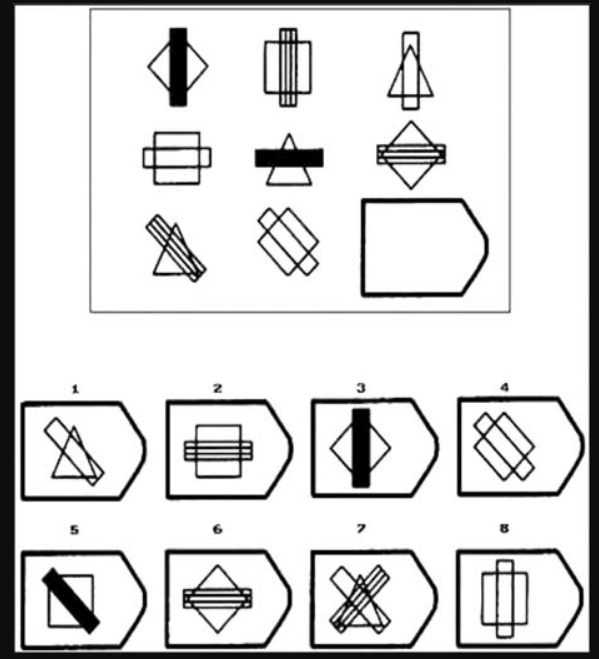
Phenotypic IQ is just one’s score on a an intelligence test that is arguably valid for the person taking it. In other words, phenotypic IQ is just IQ. All IQs are expressed relatives to the norms of whites in countries like Britain, the U.S. and Australia (or something approximating them). I chose the Raven Progressive Matrices (or Wechsler Matrix reasoning) as the most appropriate test because it’s been taken by roughly all 10 races, and is much less culture loaded than most IQ tests. The test is designed to minimize acquired knowledge and emphasize abstract reasoning, so a typical item has you pick which of the 8 choices at the bottom completes the pattern.
There is still some very subtle cultural bias which is why Dutch young adults reportedly gained 7 IQ points a decade for several decades but as Richard Lynn has argued (correctly in my opinion) such suspiciously huge Flynn effects largely vanish when you move from adults to school children where the effect of schooling is largely controlled, and the only gains you see are about 2 points a decade which is small enough to be explained by a genuine rise in biological intelligence (consistent with biological gains caused by nutrition that Lynn noted in other traits like height and brain size over the 20th century). How exactly schooling affects a test designed for even illiterates is unclear but the preponderance of evidence suggests that it does.
For this reason I limited myself whenever possible to IQ scores of school children (age 6 to 15) and from about 1980 to seldom after 2015 (since my main source was Lynn 2015). Prior to 1980 it was hard to analyze the effects of malnutrition because stunting data was scarce.
Another reason matrix tests were chosen is they’re a relatively pure measure of the general factor of intelligence (g). That’s not to say it’s a great test of g but rather it’s to say that it’s not especially biased to verbal or crystalized ability (which favors Jews) or spatial ability (which favors East Asians) or any other broadly defined ability tilt. It does have some spatial loading but it’s small enough that recent editions of the Wechsler scales exclude it from their spatial index score and instead classify it as “fluid reasoning” which many believe is g itself.
Genetic IQ
Just as the Flynn effect proved people got smarter when born in 1990 instead of 1890, people also get smarter when born in a a First World county vs the Third World. This is because as Lynn noted, suboptimum nutrition (including disease which prevents nutrients from being used) suppresses both IQ and height.
Thus genetic IQ is defined here as the IQ one would have if reared with first World nutrition.
Preschool children who are in the bottom 2% of the height distribution of well nourished populations are considered stunted. In rich countries like Germany, about 2% of pre-school kids are stunted but in say Nigeria, 43% were (more details in the chart below).
Thus to calculate the genetic IQ of Nigerians (and other groups afflicted by stunting), I noted that 43rd percentile of their early childhood height distribution matches the 2nd percentile of a well nourished population which implies a 1.8 standard deviation (SD) gap in height caused virtually entirely by nutrition (genetic effects are minimal in preschool kids and studies show that all the most populous races have identical early childhood height potential).
If malnutritioned stunted early childhood height by 1.8 SD, it perhaps did likewise to the developing brain and since brain size correlates close to 0.4 with IQ (Gignac & Bates, 2017) we’d expect Nigerian IQs to be stunted by 0.4(1.8 SD) = 0.72 SD or 11 IQ points. Thus Nigerian school kids average 70 on Raven IQ tests but their genetic IQ might be expected to average 81, which is almost as high as black American school kids score (which makes sense because black Americans are a well nourished sample of the same race).
Vincent 1991 reported three studies of Raven black-white IQ gaps in school kids the United States of 14, 18, and 7 points respectively. Averaging them suggests a gap of 13 points. But assuming that the white SD is only about three percent smaller than the U.S. SD, using the white SD instead of the U.S. SD does not increase the gap, so on a scale where whites average 100 (SD = 15), U.S. blacks average 87. Given that black Americans are 74% black on average, blacks who are 100% black (like those in Nigeria) should average 13/0.74 = 18 points below the white mean and thus average 82.
When we apply my method to Indians we get similarly plausible results. For example, the seven Raven IQ studies of Indian school kids Lynn (2015) cited showed a mean of 82 and the studies had a mean publication year of 1994. In the 1980s (when the kids in the average of these studies were under five), India’s stunting rate was an astonishing 66%. Since, the expected stunting rate if all the mainstream races were well nourished is only 2%, their developing bodies (and presumably their brains) were 2.46 SD below their genetic potential, and since brain size correlates perhaps 0.4 with IQ, their IQs are 2.46 SD(0.4) = 0.98 SD (15 points) below their genetic potential, suggesting their genetic IQ is 97. Lynn (2015) cited a most remarkable study by Mackintosh et al,, (1985) showing Indian school kids with fewer than four years of schooling in Britain had a mean non-verbal IQ of 83 (virtually identical to the mean in India) but those with over four years residence had a mean IQ of 97 (born with First World nutrition?). Assuming this study was not miscited, it further validates my method.
| Raven/Matrix IQs of each race | Psychometric sources | Sources for stunting data |
Pacific Islanders  Phenotypic: 98 Genetic: 98 Phenotypic: 98 Genetic: 98 | Dudley et al. (2022) found Maori 16-20 year-olds averaged a raw score of 19.08 on the Matrix reasoning subtest of the WAIS-IV which equates to a scaled score of 10. Since Canadians have about the same IQ distribution as whites in the U.S., I used them as the reference population, and since their WAIS-IV Matrix reasoning mean and SD is 10.4 and 2.9 respectively, an IQ of 98 is assigned. | Inwood (2016) noted that amoung those born since 1980, natives and white New Zealanders have the same height suggesting Maori in this study reached their genetic potential so no need to adjust their IQs for nutrition |
Whites  Phenotypic: 100 Genetic: 100 Phenotypic: 100 Genetic: 100 | The mean of five German studies of school kids cited by Lynn (2015) | First World nutrition; no adjustment needed |
Congoids  Phenotypic: 70 Genetic: 81 Phenotypic: 70 Genetic: 81 | The mean of three Nigerian studies of school kids cited by Lynn (2015). Mean publication year: 2000 | Nigeria Demographic and Health Survey (NDHS) 1990 found 43% stunting. |
Dark Caucasoids  Phenotypic: 82 Genetic: 97 Phenotypic: 82 Genetic: 97 | Lynn (2015) cites seven studies of school kids from India. Mean publication year: 1994 | In the 1980s (when the kids in the average of these studies were under five), India’s stunting rate was 66% |
Southeast Asians  Phenotypic: 87 Genetic: 99 Phenotypic: 87 Genetic: 99 | One 1998 Indonesian study of school kids cited in Lynn (2015) | According to Indonesia Family Life Survey (IFLS) Wave 1 (1993), about 51% of Indonesian children aged 2.0–4.9 were stunted |
East Asians  Phenotypic: 104 Genetic: 108 Phenotypic: 104 Genetic: 108 | Lynn (2015) cites three Chinese studies of school kids with a mean year of 1995 | the stunting rate in China circa 1990 was 33% (figure 5.2), However if the sample was drawn overwhelmingly from the cities, which seems likely, then the 9.4% stunting rate for urban areas might be more appropriate |
Arctic people  Phenotypic: 80 Genetic: 94 Phenotypic: 80 Genetic: 94 | One 2014 Russian study of school kids cited in Lynn (2015) | In 1995, 61% of Evenki kids were stunted (Leonard et al., 2002) |
Native Americans  Phenotypic: 87 Genetic: 97 Phenotypic: 87 Genetic: 97 | One 1995 study in Peru cited by Lynn (2015) | In 1990, the stunting rate in Peru was 37% |
Australoids  Phenotypic: 85 Genetic: 91 Phenotypic: 85 Genetic: 91 | Chaffey et al., ~2002–2003 tested 79 Aboriginal children in Years 3–5 (roughly ages 8–11) from rural schools in northern New South Wales and found their average raw score was at the 27th percentile on Australian norms (table 2). Although the Australian norms were from 1989, Cotton et al. (2005) found the Raven Flynn effect in children has been nil since 1975 & Flynn (2009) found similar results in Britain. The 27th percentile equates to an IQ of 91, but since Australian norms might be 1 point below white norms, an IQ of 90 is assumed. But because a study by McEvoy et al. (2010) found Australian aboriginals average only 66% aboriginal ancestry (see figure 4) being 10 points below IQ 100 becomes 15 points below 100 in a “pure” sample in the same environment, so 85 | Ruben and Walker (1995) found stunting rates (only stunted + stunted & wasted) in rural Australian aboriginals to be 23% in a hospital sample which implied a minimum of 8% (since only about a third were hospitalized). Splitting the difference between the maximum estimate which assumes the hospitalized have the same stunting rates as all Australian aboriginals and the minimum estimate (assuming only hospitalized Australoids are srunted) gives an estimate of 16% |
Capoids  Phenotypic: 77 Genetic: 85 Phenotypic: 77 Genetic: 85 | A study by Owen (1992) reported Raven scores in South Africa with huge samples of Whites, Indians, Coloureds, and Congoids. Many sources misreport their IQs but my careful analysis found these to be 98, 92, 82, and 69 respectively. Because Indians and Congoids in South Africa score 5 and 12 points below their genetic potential respectively, I estimated Coloureds, who have living standards intermediate between these two likely also underdeveloped to an intermediate degree, implying their genetic IQ is 8 points above 82. In other words 90. Lankheet et al., (2025) reviews studies of Coloureds (mostly from Cape Town) and from the range mid-points made to add to 100%, their ancestry appears to be 30% Capoid, 28% Congoid, 14% Asian (South and Southeast) and 28% White. As we saw above, the latter three have mean genetic IQs of 81, about 98 and 100 respectively so for Coloureds to average a genetic IQ of 90, Capoids must average one of 85. Since their genetic IQ is 5 points below the Coloured genetic IQ, the subset of “Coloureds” who are pure Capoid likely average 5 points below the Coloured phenotypic IQ too, hence phenotypic IQ of 77 | Can’t be directly measured because Capoids (including hybridized Capoids like Coloureds) are too genetically distinct to attribute extreme short stature to malnutrition (even before age five when environment dominates) but in South Africa they were likely less nourished than Indians but more nourished than Congoids |


Here AK/PP, a test of the hereditarian assumption. Here’s the rationale behind it and how it refutes hereditarianism. Then the hereditarians had to lie. https://x.com/i/status/1968671431387951148
Mexicans are admixed (Euro/Indigenous).Within the same family kids get random ancestry chunks. Family environment/SES remained constant while ancestry varies. Indigenous ancestry predicts shorter height/higher T2D within families.But not education gaps so population differences are environmental.
https://www.medrxiv.org/content/10.1101/2025.09.09.25335237v1
I have always maintained that genes and gene frequencies work on the individual level and have a never said anything about ancestry mechanisms so you calling me a hereditarian only shows your dishonesty again and intelligence even if effected by environment is just as much effect by genes because extreme smart people exist in poor places sometimes.
Misrepresenting me is all you can do.
So lying about what I believe doesn’t make you right.
IQ-ist
Reductionist
Hereditarian
meaningless strawman words
has no clue what my views are
or maybe they does but needs to set an example of someone?
thus politics corrupts them
lying deceiving politics
(its fucking stupid)
No one would call me such names unless they were deliberate propagandists.
Brain organization matters to intelligence.
if it did not we would not have a brain.
Stupid propogandists say development matters to brains but they also say we cannot know what the organization looks like in brain scans.
This is fucking stupid.
They have no idea what brain scans can do.
they just call you names
in reality brain scans show how neural plasticity works
it shows how differences can result in different test results
it shows how ADHD works as example in myelination
it shows how nutritional factors effect results, and sleep and all else
the correspondence of brain structures to what people can do is almost perfect 1 to 1 they do longitudinal studies on kids as they age
this does not mean brains cannot change
it means like any body part it has functional aptitudes
strong muscles lift more
cycles in brain networks perform tasks according to dynamics
this is measurable
plasticity is measurable
this has been researched since the 1960’s
politics can go screw itself
“differences can result in different test results” – One of the environmental differences is obviously information exposure.
“the correspondence of brain structures to what people can do is almost perfect 1 to 1 they do longitudinal studies on kids as they age” – source?
in the past you denied that information has anything to do with intelligence. that people who can process more information at once cannot be more intelligent. it is sad.
longitudinal studies exist, I saw an hour long video about it. kids get put in scanners and is easy to look up. but you are one of those people ask for a source if people say 1+1=2
it is fairly simple
development involves the brain or it does not
if it does then we can understand the mechanisms of intelligence
saying intelligence does not involve the brain is the same as saying brains do not develop
it is a contradiction: brain develop but this development doesnt involve intelligence?
again propagandist just want people to believe lies
so they lie about brains not involving intelligence
Too those who actually want to know:
The shape of proteins matters to the efficiency of chemical reactions in the cell metabolism. (Enzymes and internal and external cell structures)
Cell metabolism is important to intelligence because using energy efficiently can make your brain smarter. Cell Structures can too.
Genes determine the shapes of proteins by the alleles (the sequences of amino acids in the proteins) allele frequencies can increase or decrease reactions.
errors in alleles can cause genetic diseases but small changes can also increase efficiency of metabolism.
signaling within the cell can depend on what chemicals are in the cell at any given time. (also can be effected by protein shapes)
all chemicals have bonds, strong or weak, protein and other chemicals in the cell can be effected by gene amino acid sequences and frequencies.
–
I been saying all this for three years and people call me autistic and racist because it implies intelligence is influenced by genes. (so it must not be true?)
Then they forget what they called you and dismiss your arguments.
The regulation and growth of any organism is effected by genes.
Humans have hands not flippers.
genes exist to create fingers and the thumb in a self regulating process.
just as flippers are self regulated in a different way
and this is not just at the macro level
cells in the brain can change shape base off gene variants
(extreme smart people and mentally disabled people exist for this reason)
but no one cares
to them its all racism
whacky stuff
Sugars and starches come in different shapes
and because of it chemical reactions happen different (the bonds)
genes do the same to proteins (create variants)
As Darwin said: small variations are why evolution happen in natural selection.
why is this so hard to understand?
(only politics keep you ignorant from the science)
I found something interesting:
Siblings who grow up in the same SES, when the independent variables are controlled for, the ones who have more surface area in the brain (particularly for executive functioning) complete more years of schooling.
And this is shown in the PGS
It can be inferred that executive functioning makes you better at schooling. Executive functioning is a key part of intelligence.
Low SES can make surface area smaller lowering executive function.
But this is independent from PGS
So both are additive to education attainment.
PGS can lower or raise executive functions independently of SES lowering or increase executive function. (in brain surface area)
Stratification has been happening for years but because smarter people on average get more money to help their kids they had in assortative matting. Its not like everyone can be forest gump and be rich and mentally disabled at the same time.
smarter people who have smart kids make more money
rich people who have a dumb kid that kid loses money and lowers their SES
its not just rags to riches it is riches to rags (economic mobility)
usually by age 40 people just stay where they are at
that is how long it takes to move up or down
remember that the average IQ is around 100 in the USA
society is designed for that level of functioning
so forest gump is possibe but so is Chris langan
its called regression to the mean
money is only somewhat associated with intelligence, not perfect
Heavy is the Head that Wears the Crown
Jalen Brunson has once again defied the odds.
The undersized second-round point guard actually pulled it off: living up to the nickname “King of New York” by bringing an NBA title to the Big Apple for the first time in over half a century.
How did he do it?
How did HE do it?
How did a man with comparable stature and explosive athleticism to my next door neighbor possibly outcompete the biggest genetic freaks on the planet and walk away with the prestigious MVP of the Finals?
While New Yorkers will forever call him “King,” Chinese basketball fans, a tad less reverentially, gave him the appellation “Big Head”.
No, they are not implying that he’s conceited. Rather, they are pointing out the obvious – that Jalen Brunson literally has a huge fucking head: https://www.instagram.com/reel/DXHSeQQEnp7/
“Oubre isn’t the first person to make comments about the size of Brunson’s head. His New York teammate, Josh Hart, has made similar comments, once revealing that Brunson was unable to fit into multiple hats he purchased on account of his head size.”
“Who cares?” a well-adjusted human being may ask, but the answer is anyone who wants to know why Jalen Brunson is so good.
A wise man once said, “intelligence is the ability to adapt, to take whatever situation you’re in and turn it to your advantage.”
Adaptation is the name of Brunson’s game. See him in action, and you’ll notice how he creates offense for himself and his teammates: feints, counters, counters to counters. He just reads, manipulates, and executes – taking what the defense gives him and turns it to his advantage time and time again.
The stadiometer at the draft combine missed what the calipers would have screamed: “this man knows how to play.”
Do you all agree that Brunson is so good because his head is so big?
Or do you not respect Pumpkin Person at all.
yep
high spatial IQ
it can also help with perspective drawing
seeing all the angles and around them
wrap the mind around something
mental grasping
makes sense as more than a metaphor
pumpkin person I have a question?
The average you have for east Asian genetic IQ is 108 with Chinese samples from 1995
What about Japan?
Less people there would be stunted as they are an advanced society.
Is it possible they have a higher genetic IQ?
–
When looking at SES I do not think that it explains much.
The cause is reversed:
High intelligence societies cause high SES
High SES does not cause high intelligence
it has to do with mobility
and resource managment
smart people work together and do not waste money
so if you look at a society like Japan it is high trust
though high trust also makes conformity more extreme
In the united states this should also apply
Areas of low SES have low resources but they also have low trust people.
SES doe not cause low trust because I know lots of poor people who are nice people. It exacerbates the situation of people being low inhibition.
If you lack inhibitory control you are less likely to get a good job because peer groups kick out those who don’t conform to social standards.
so you are more likely to hang out with bad influences in bad areas
in a repeated number of cycles people sort into groups this way
people hang out with people like themselves
they do not stay where they are at
So SES is basically caused by the people not the amount of resources they have.
Like cigarettes and alcohol
People prone to them is not caused by SES its caused by being prone to them. Lots of poor people don’t smoke or drink, lots of rich people do.
Same with much of cognitive ability.
As to ancestry mechanisms:
You cannot compare societies on IQ tests because they are not standardized the same in each society.
If you only use the ravens that could work but its still not enough.
This does not mean all societies are the all same.
A society can have more people above the world average IQ or it can have an average of number of people bellow the world average IQ.
The number of people in a society and there level on intelligence on average doesn’t have to be from specific genes. Skin color does not make the brain more or less intelligent in a mechaniscal way.
But we can say that white people adapted to cold and black people adapted to heat. So genes do exist for living in heat and cold.
We could say that the founder population of any society had a mean IQ and also through competition and environmental forces equilibriums happen. Japan had a founder population from Korea land bridge thousands of years ago. So they are all Japanese. But those in leadership in Japan the saimiri and others. They were the ones who made swords as blacksmiths so took over the farmers.
Farming creates pleasures in how people begin to read and write and count and this makes it more challenging to fight wars that in hunter gather societies who don’t need to read and write and make weapons.
So genes for understanding tools spread around.
This was advantageous.
But even in Europe where farming did not exist people had to hunt had extreme spatial intelligence. So when books and farming did happen they adapted to use them.
Big brains allows you to be spatially intelligent in the wild.
But it also allows tool use.
But since we farm and no longer hunt more people exist who had smaller brains but could read good or speak good and or specialized in making ceramic pots or other things for society not having to fend for themsleves.
This created more variation in society genetically.
And this makes it harder to standardize IQ tests on populations and compare them, you never get representative samples.
This also means the average IQ can go up or down if people on the individual level migrate of have kids different from themselves.
In hunter gatherer societies big brains made better at hunnting.
But now we have books and numbers and tools.
The saimiri in Japan when tested are high up in IQ but this is one group.
If people can survive they add or subtract to a groups average IQ
So variation in environment matters.
Founder populations adapt up or down.
Depending on hard environments.
And group splits of them.