The undersized second-round point guard actually pulled it off: living up to the nickname “King of New York” by bringing an NBA title to the Big Apple for the first time in over half a century.
How did he do it?
How did HE do it?
How did a man with comparable stature and explosive athleticism to my next door neighbor possibly outcompete the biggest genetic freaks on the planet and walk away with the prestigious MVP of the Finals?
While New Yorkers will forever call him “King,” Chinese basketball fans, a tad less reverentially, gave him the appellation “Big Head”.
No, they are not implying that he’s conceited. Rather, they are pointing out the obvious – that Jalen Brunson literally has a huge fucking head: https://www.instagram.com/reel/DXHSeQQEnp7/
“Oubre isn’t the first person to make comments about the size of Brunson’s head. His New York teammate, Josh Hart, has made similar comments, once revealing that Brunson was unable to fit into multiple hats he purchased on account of his head size.”
“Who cares?” a well-adjusted human being may ask, but the answer is anyone who wants to know why Jalen Brunson is so good.
A wise man once said, “intelligence is the ability to adapt, to take whatever situation you’re in and turn it to your advantage.”
Adaptation is the name of Brunson’s game. See him in action, and you’ll notice how he creates offense for himself and his teammates: feints, counters, counters to counters. He just reads, manipulates, and executes – taking what the defense gives him and turns it to his advantage time and time again.
The stadiometer at the draft combine missed what the calipers would have screamed: “this man knows how to play.”
Do you all agree that Brunson is so good because his head is so big?
Or do you not respect Pumpkin Person at all.
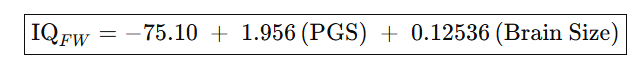
I don’t know what Brunson’s IQ is but he is a metaphor for why brain size tripled in 4 million years of human evolution. Despite being relatively short and unathletic, he dominates men much taller and more athletic thanks to an intelligence linked to his brain size. Similarly, despite our species lacking speed, strength, fur, fangs and claws, our species dominates much bigger, faster, stronger and ferocious animals, thanks to an intelligence linked our brain size. Big brains evolved, because when your situation is disadvantaged, you must turn it around to your advantage and by you, I mean your brain. That’s the essence of who you are.
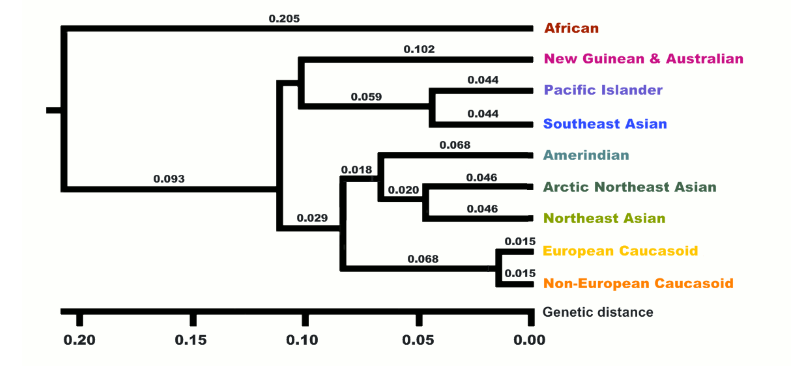
In the chart at the bottom of this article, I estimate the phenotypic and genetic IQs of the 10 “races” described by Richard Lynn (2006). Lynn justified his racial taxonomy by citing the “10” genetic clusters noted by Luigi Luca Cavalli-Sforza.
Actually there were only nine but Lynn took the liberty of replacing a single African cluster with two races, which I’ve very roughly labeled Congoids and Capoids respectively.
Locating samples
To estimate the phenotypic IQ of the 10 races, I focused on the country where each race has the most people. So for example, China is the country with the most East Asians, India is the country with the most dark Caucasoids, Nigeria is the country with the most Congoids, Germany is the country with the most Whites, not counting Russia because it’s not fully in Europe. If there was no good data in the country, I settled for the country with the second most people of a given race.
The reason I limited myself to one country per race is that it made it easier to correct the IQs for malnutrition to get the estimated genetic IQ since there are precise estimates of stunting rates in different countries.
Phenotypic IQ
Phenotypic IQ is just one’s score on a an intelligence test that is arguably valid for the person taking it. In other words, phenotypic IQ is just IQ. All IQs are expressed relatives to the norms of whites in countries like Britain, the U.S. and Australia (or something approximating them). I chose the Raven Progressive Matrices (or Wechsler Matrix reasoning) as the most appropriate test because it’s been taken by roughly all 10 races, and is much less culture loaded than most IQ tests. The test is designed to minimize acquired knowledge and emphasize abstract reasoning, so a typical item has you pick which of the 8 choices at the bottom completes the pattern.
There is still some very subtle cultural bias which is why Dutch young adults reportedly gained 7 IQ points a decade for several decades but as Richard Lynn has argued (correctly in my opinion) such suspiciously huge Flynn effects largely vanish when you move from adults to school children where the effect of schooling is largely controlled, and the only gains you see are about 2 points a decade which is small enough to be explained by a genuine rise in biological intelligence (consistent with biological gains caused by nutrition that Lynn noted in other traits like height and brain size over the 20th century). How exactly schooling affects a test designed for even illiterates is unclear but the preponderance of evidence suggests that it does.
For this reason I limited myself whenever possible to IQ scores of school children (age 6 to 15) and from about 1980 to seldom after 2015 (since my main source was Lynn 2015). Prior to 1980 it was hard to analyze the effects of malnutrition because stunting data was scarce.
Another reason matrix tests were chosen is they’re a relatively pure measure of the general factor of intelligence (g). That’s not to say it’s a great test of g but rather it’s to say that it’s not especially biased to verbal or crystalized ability (which favors Jews) or spatial ability (which favors East Asians) or any other broadly defined ability tilt. It does have some spatial loading but it’s small enough that recent editions of the Wechsler scales exclude it from their spatial index score and instead classify it as “fluid reasoning” which many believe is g itself.
Genetic IQ
Just as the Flynn effect proved people got smarter when born in 1990 instead of 1890, people also get smarter when born in a a First World county vs the Third World. This is because as Lynn noted, suboptimum nutrition (including disease which prevents nutrients from being used) suppresses both IQ and height.
Thus genetic IQ is defined here as the IQ one would have if reared with first World nutrition.
Preschool children who are in the bottom 2% of the height distribution of well nourished populations are considered stunted. In rich countries like Germany, about 2% of pre-school kids are stunted but in say Nigeria, 43% were (more details in the chart below).
Thus to calculate the genetic IQ of Nigerians (and other groups afflicted by stunting), I noted that 43rd percentile of their early childhood height distribution matches the 2nd percentile of a well nourished population which implies a 1.8 standard deviation (SD) gap in height caused virtually entirely by nutrition (genetic effects are minimal in preschool kids and studies show that all the most populous races have identical early childhood height potential).
If malnutritioned stunted early childhood height by 1.8 SD, it perhaps did likewise to the developing brain and since brain size correlates close to 0.4 with IQ (Gignac & Bates, 2017) we’d expect Nigerian IQs to be stunted by 0.4(1.8 SD) = 0.72 SD or 11 IQ points. Thus Nigerian school kids average 70 on Raven IQ tests but their genetic IQ might be expected to average 81, which is almost as high as black American school kids score (which makes sense because black Americans are a well nourished sample of the same race).
Vincent 1991 reported three studies of Raven black-white IQ gaps in school kids the United States of 14, 18, and 7 points respectively. Averaging them suggests a gap of 13 points. But assuming that the white SD is only about three percent smaller than the U.S. SD, using the white SD instead of the U.S. SD does not increase the gap, so on a scale where whites average 100 (SD = 15), U.S. blacks average 87. Given that black Americans are 74% black on average, blacks who are 100% black (like those in Nigeria) should average 13/0.74 = 18 points below the white mean and thus average 82.
When we apply my method to Indians we get similarly plausible results. For example, the seven Raven IQ studies of Indian school kids Lynn (2015) cited showed a mean of 82 and the studies had a mean publication year of 1994. In the 1980s (when the kids in the average of these studies were under five), India’s stunting rate was an astonishing 66%. Since, the expected stunting rate if all the mainstream races were well nourished is only 2%, their developing bodies (and presumably their brains) were 2.46 SD below their genetic potential, and since brain size correlates perhaps 0.4 with IQ, their IQs are 2.46 SD(0.4) = 0.98 SD (15 points) below their genetic potential, suggesting their genetic IQ is 97. Lynn (2015) cited a most remarkable study by Mackintosh et al,, (1985) showing Indian school kids with fewer than four years of schooling in Britain had a mean non-verbal IQ of 83 (virtually identical to the mean in India) but those with over four years residence had a mean IQ of 97 (born with First World nutrition?). Assuming this study was not miscited, it further validates my method.
Raven/Matrix IQs of each race
Psychometric sources
Sources for stunting data
Pacific Islanders Phenotypic: 98 Genetic: 98
Dudley et al. (2022) found Maori 16-20 year-olds averaged a raw score of 19.08 on the Matrix reasoning subtest of the WAIS-IV which equates to a scaled score of 10. Since Canadians have about the same IQ distribution as whites in the U.S., I used them as the reference population, and since their WAIS-IV Matrix reasoning mean and SD is 10.4 and 2.9 respectively, an IQ of 98 is assigned.
Inwood (2016) noted that amoung those born since 1980, natives and white New Zealanders have the same height suggesting Maori in this study reached their genetic potential so no need to adjust their IQs for nutrition
Whites Phenotypic: 100 Genetic: 100
The mean of five German studies of school kids cited by Lynn (2015)
First World nutrition; no adjustment needed
Congoids Phenotypic: 70 Genetic: 81
The mean of three Nigerian studies of school kids cited by Lynn (2015). Mean publication year: 2000
Nigeria Demographic and Health Survey (NDHS) 1990 found 43% stunting.
Dark Caucasoids Phenotypic: 82 Genetic: 97
Lynn (2015) cites seven studies of school kids from India. Mean publication year: 1994
In the 1980s (when the kids in the average of these studies were under five), India’s stunting rate was 66%
Southeast Asians Phenotypic: 87 Genetic: 99
One 1998 Indonesian study of school kids cited in Lynn (2015)
According to Indonesia Family Life Survey (IFLS) Wave 1 (1993), about 51% of Indonesian children aged 2.0–4.9 were stunted
East Asians Phenotypic: 104 Genetic: 108
Lynn (2015) cites three Chinese studies of school kids with a mean year of 1995
the stunting rate in China circa 1990 was 33% (figure 5.2), However if the sample was drawn overwhelmingly from the cities, which seems likely, then the 9.4% stunting rate for urban areas might be more appropriate
Arctic people Phenotypic: 80 Genetic: 94
One 2014 Russian study of school kids cited in Lynn (2015)
Chaffey et al., ~2002–2003 tested 79 Aboriginal children in Years 3–5 (roughly ages 8–11) from rural schools in northern New South Wales and found their average raw score was at the 27th percentile on Australian norms (table 2). Although the Australian norms were from 1989, Cotton et al. (2005) found the Raven Flynn effect in children has been nil since 1975 & Flynn (2009) found similar results in Britain. The 27th percentile equates to an IQ of 91, but since Australian norms might be 1 point below white norms, an IQ of 90 is assumed.
But because a study by McEvoy et al. (2010) found Australian aboriginals average only 66% aboriginal ancestry (see figure 4) being 10 points below IQ 100 becomes 15 points below 100 in a “pure” sample in the same environment, so 85
Ruben and Walker (1995) found stunting rates (only stunted + stunted & wasted) in rural Australian aboriginals to be 23% in a hospital sample which implied a minimum of 8% (since only about a third were hospitalized). Splitting the difference between the maximum estimate which assumes the hospitalized have the same stunting rates as all Australian aboriginals and the minimum estimate (assuming only hospitalized Australoids are srunted) gives an estimate of 16%
Capoids Phenotypic: 77 Genetic: 85
A study by Owen (1992) reported Raven scores in South Africa with huge samples of Whites, Indians, Coloureds, and Congoids. Many sources misreport their IQs but my careful analysis found these to be 98, 92, 82, and 69 respectively.
Because Indians and Congoids in South Africa score 5 and 12 points below their genetic potential respectively, I estimated Coloureds, who have living standards intermediate between these two likely also underdeveloped to an intermediate degree, implying their genetic IQ is 8 points above 82. In other words 90.
Lankheet et al., (2025) reviews studies of Coloureds (mostly from Cape Town) and from the range mid-points made to add to 100%, their ancestry appears to be 30% Capoid, 28% Congoid, 14% Asian (South and Southeast) and 28% White.
As we saw above, the latter three have mean genetic IQs of 81, about 98 and 100 respectively so for Coloureds to average a genetic IQ of 90, Capoids must average one of 85.
Since their genetic IQ is 5 points below the Coloured genetic IQ, the subset of “Coloureds” who are pure Capoid likely average 5 points below the Coloured phenotypic IQ too, hence phenotypic IQ of 77
Can’t be directly measured because Capoids (including hybridized Capoids like Coloureds) are too genetically distinct to attribute extreme short stature to malnutrition (even before age five when environment dominates) but in South Africa they were likely less nourished than Indians but more nourished than Congoids
I’m not a huge sci-fi guy, generally preferring horror, but I was intrigued by the plot of V so I decided to buy the 2009 reboot on Apple TV and was very impressed, especially by the choice of the lead actress who despite her beauty, reminds me so much of a snake.
The plot:
Earth is visited by space ships full of aliens. Each ship hovers over major cities like New York, Paris, Beijing, etc as people look up at bottom of the ships which form a massive TV screen from which the beautiful Anna explains that they come in peace and promises to share their advanced technology.
Because people look up to this huge image of a face constantly talking to them from the sky, Anna is like God. Anna quickly becomes a beloved figure on the World stage, meeting with World leaders and charming the masses with jokes like “not even us Vs can cure the common cold”. She would have towered as the most admired woman in the World on the annual Gallup poll of Americans (or any other nation).
When skeptics ask how it’s possible that aliens on another planet just happened to evolve to look and act identical to humans Anna says “our scientists can explain” which they never do because beneath the cloned human skin they actually look like reptiles and like a snake, Anna can opens her mouth wide enough to swallow her sexual partners after using them to fertilize her thousands of eggs which she needs to build her army, since the rest of her space ships are taking too long to get to Earth.
Sadly the show only lasted two seasons and since this is a reboot of the hit 1983 series by the same name, many fans of the original didn’t give it much of a chance.
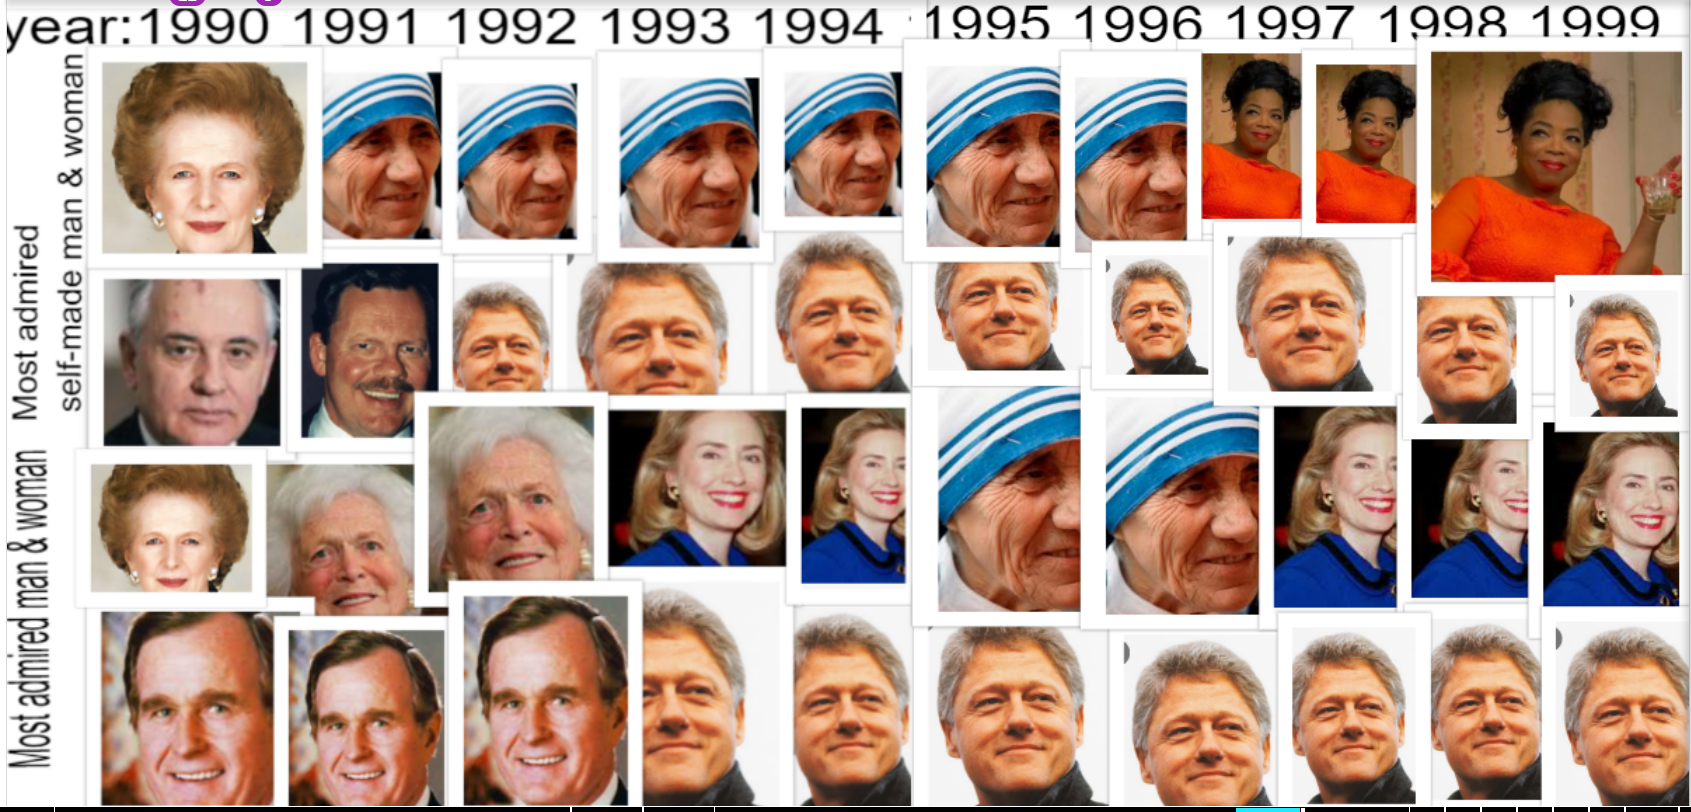
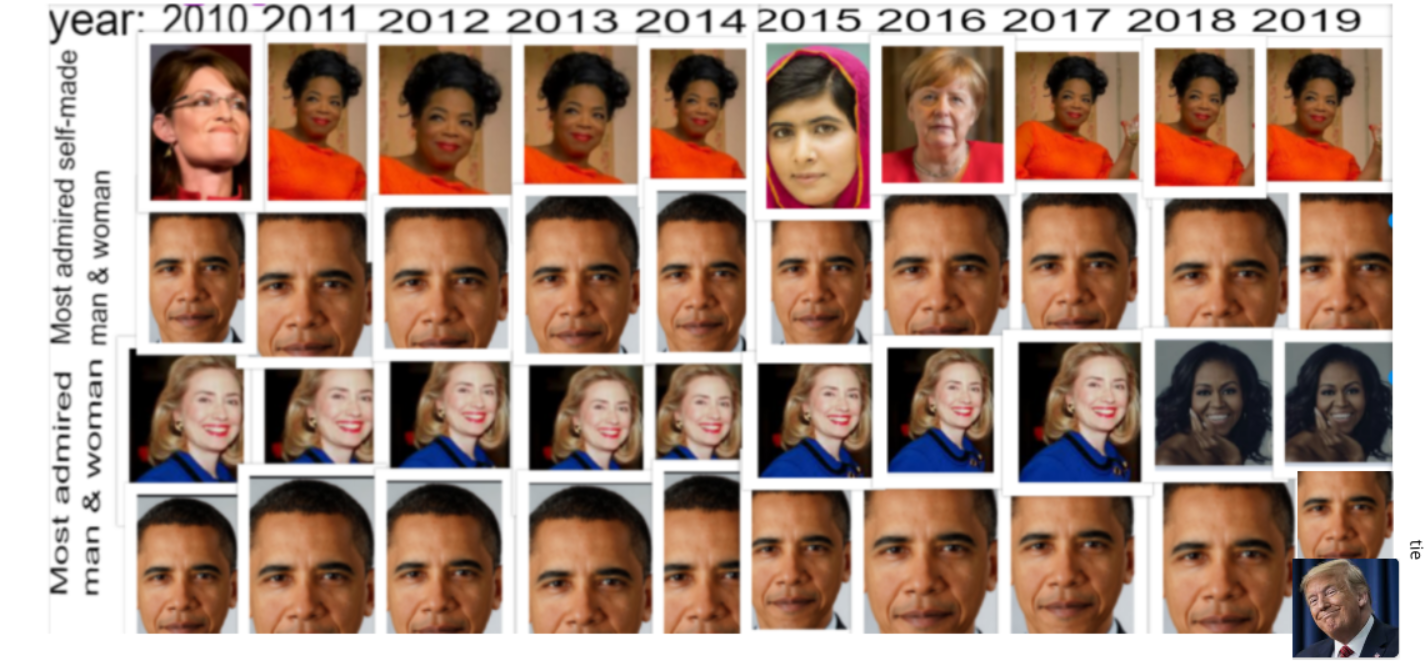
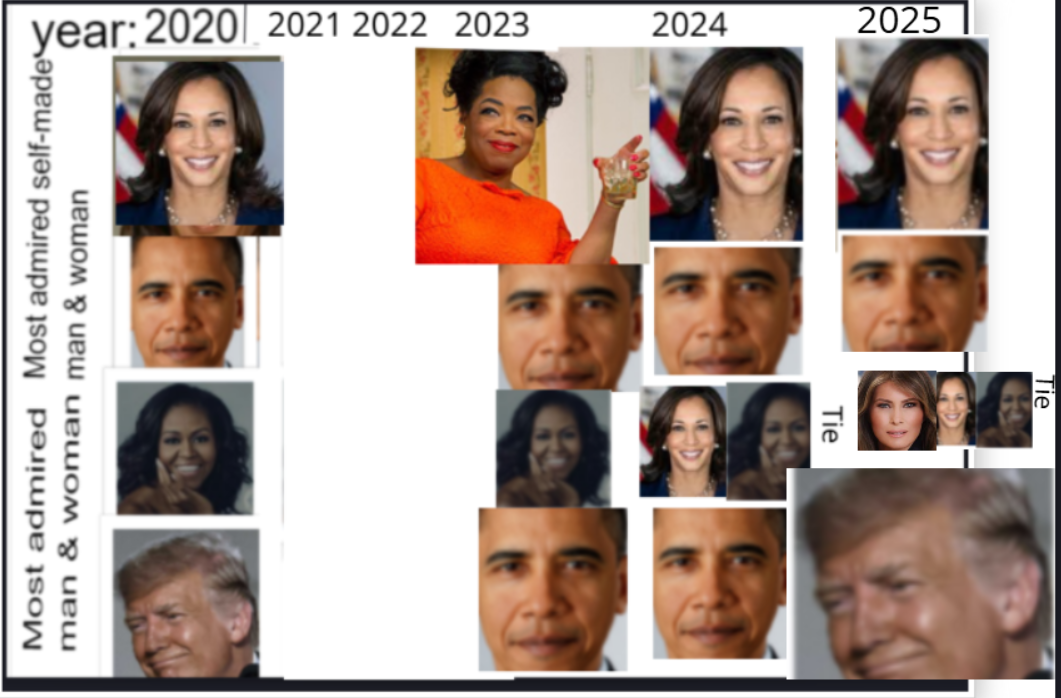
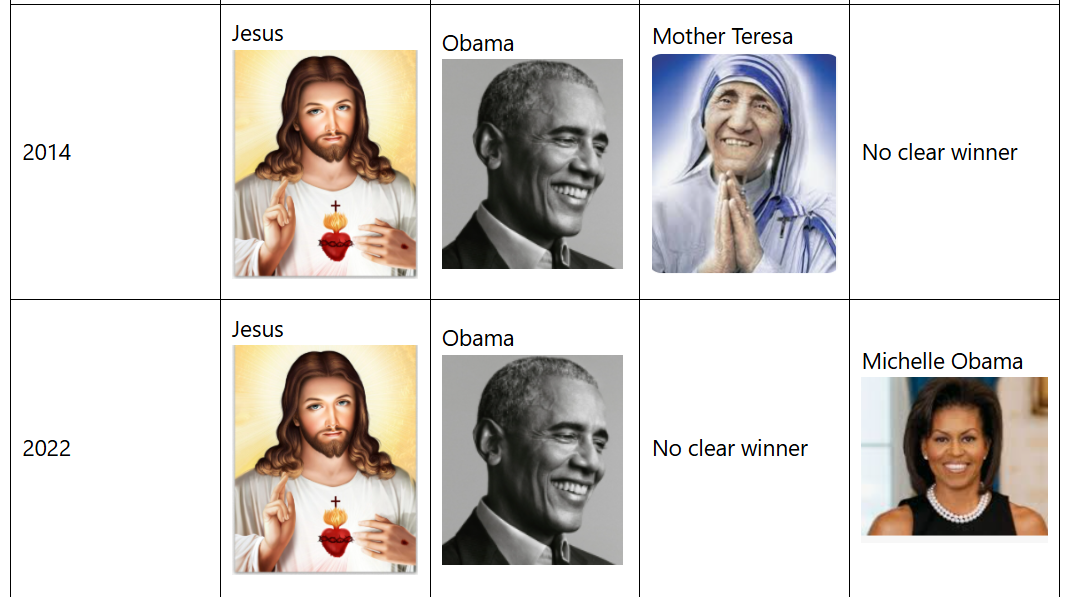
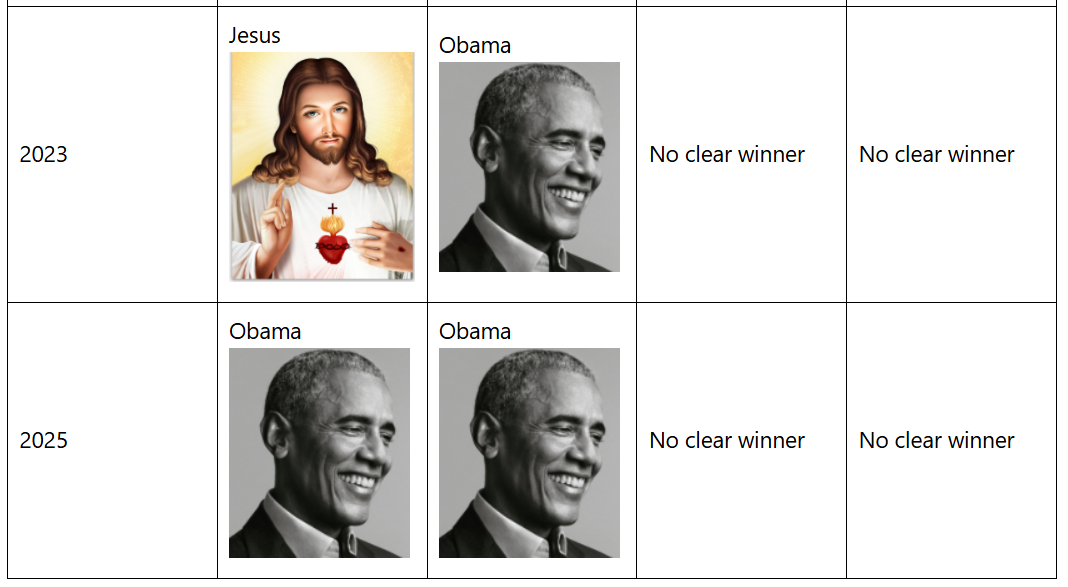
Despite being the most worshipped human ever of 2025, Trump has dethroned Obama as the most worshipped LIVING man according to an annual poll conducted virtually every December since the 1940s. If you think that’s a contradiction note that in polling like in elections, the shape of the field determines the outcome so when people are free to choose among ALL HUMANS (alive or dead, real or fictional) Obama wins, but when the competition is confined to only male humans who are alive, Trump wins, with 13% of Americans naming him (unprompted) as a man they admire, more than triple the 4% who named Obama. However 4% was enough to make Obama the most worshipped self-made man, a title he’s held virtually every year since 2008. Joe Biden has the distinction of being perhaps the only U.S. President in the poll’s 78 year history to never be either the most worshipped man or the most worshipped self-made man.
Meanwhile there was no clear winner on the female side, with Melania Trump, Michelle Obama, and Kamala Harris all locked in a three-way tie with 3% each, but 3% is enough to allow Harris to tower as the most worshipped self-made woman on the entire planet for the second consecutive year, dethroning Oprah who held the title almost every single year since 1997.
Most admired man (Dec 2025)
Most admired man (Dec 2024)
Most admired man (Dec 2023)
Donald Trump 13%
Barack Obama 17% (self-made)
Barack Obama 14% (self-made)
Barack Obama 4% (self-made)
Donald Trump 8%
Donald Trump 9%
Elon Musk 3% (self-made)
Elon Musk 7% (self-made)
Elon Musk 5% (self-made)
Pope Leo 2% (self-made) Warren Buffett 2% (self-made) Johnny Depp 1% (self-made)
Pope Francis 4% (self-made) Joe Biden 4% (self-made)
Jimmy Carter 4% (self-made) Keanu Reeves 4% (self-made)
Ronaldo 1% (self-made) JD Vance 1% (self-made) Joe Rogan 1% (self-made) Bill Gates 1% (self-made) Bernie Sanders 1% (self-made) Volodymyr Zelenskyy 1% (self-made) Keanu Reeves 1% (self-made)
Prior to Oprah breaking the color barrier in 1997, thus normalizing blackness, not a single black face had ever topped the male or female side of the list (self-made or otherwise). It was unthinkable and even today, the only nominal blacks to ever top the male side (Obama and Colin Powell) have been extremely hybridized.
*Note the female half of the poll was not given in 1967, and the entire poll was not given in 1975 & 1976.
*Note 2020 was the last year Gallup conducted the poll but I resurrected it in 2023 via survey monkey.
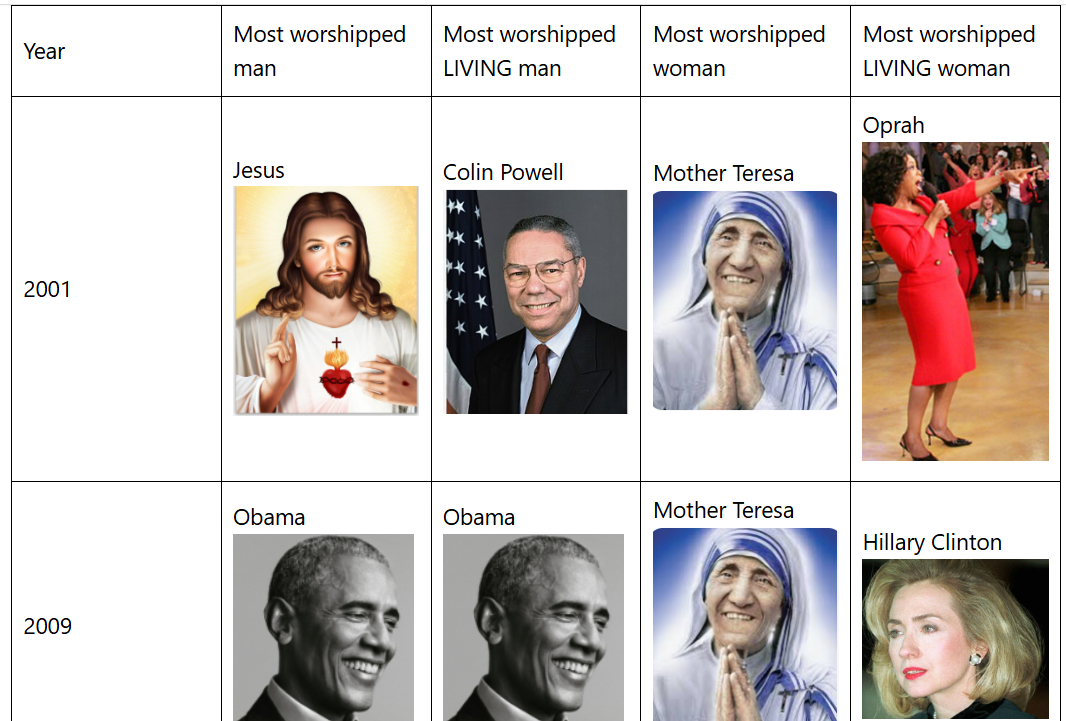
Barack Obama has overtaken Jesus as the most worshipped human ever by the World’s greatest superpower, being named a hero by 4% of Americans in a Survey Monkey Poll of 100 U.S. adults I conducted earlier this week. Jesus and President Trump were tied for second place being named by 3% each. Rounding out the top six were Bernie Sanders, Batman and Washington with 2% each.
This is the sixth known time the poll has been conducted with the first three times being done by the Harris polling company in 2001, 2009 and 2014. After waiting eight long years for them to do the poll again, I decided to do it myself using Survey Monkey in 2022, 2023 and 2025.
Most years “Christ is King” as the Christians like to say, but in 2009 and now 2025, Obama beat him, though admittedly, I’m not a professional pollster like Harris so the 2025 sample size was small and likely not as representative as professional polls which match repondents on a greater number of U.S. census demographics..
The poll involves asking American adults who they admired enough to consider a hero (maximum 3 names). Because respondents are not given a pre-selected list to choose from and are free to name literally anyone who had ever lived (or not have lived in the case of fictional characters or religious myths) being named by even 1% of Americans is a huge honor and means millions of people in the World’s most powerful country, rank you above 99.9999999% of all humanity! Not surprisingly then, the list is typically dominated by people with God like status in the culture such as Jesus and U.S. Presidents, and in this way serves as a proxy for power and influence.
While Obama was the most worshipped man (alive or dead, real or fictional) of 2025, there was no most worshipped woman of the year because the only women to be named in 2025 were all tied with only 1% naming each one.
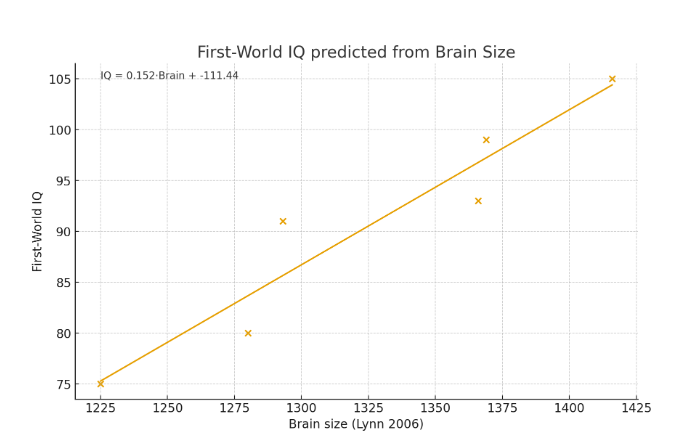
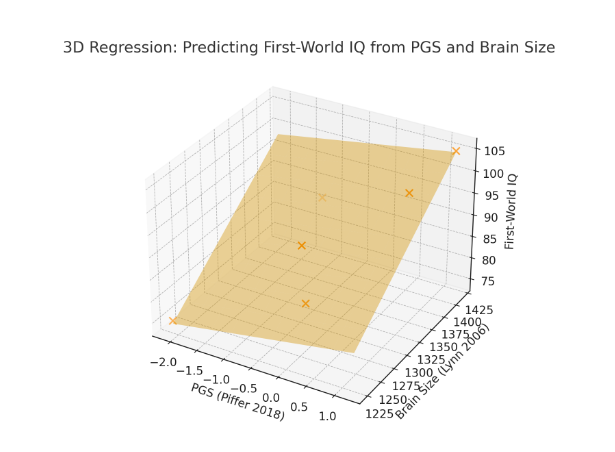
The below chart shows how six diverse populations averaged on (1) polygenic education scores, (2) brain size (3) environmental quality (4) IQ tests and (5) Guestimated IQ if everyone lived in First World. The last column was guestimated by adding 13 IQ points to people reared in the Third World type environments (Lynn 2006) and half that to people living in 2nd World type environments though these classifications are admittedly subjective. For example non-white Caucasoids live in some oil rich Arab countries but also nutritionally challenged South Asia. China has a lot of malnourished people, but those in Lynn’s samples were likely from First World type cities. Native Americans often live in the First World, but often in reservations that lack clean drinking water.
The 13 point correction was based on Lynn’s 2006 analysis that sub-Saharan environments depress IQ by 13 points. Brain size was not corrected for environment because the cranial capacities Lynn reported were from people who likely died before Western countries began really outdistancing the global South. Even in Western countries, they should be considered 3rd World brain size because they were from before the post-WWII living standards yet long after the excellent nutrition of the Paleolithic when brain size was inflated to First World levels.
education PGS (Piffer 2018)
Brain size (Lynn 2006)
Guestimated environment level of Lynn’s IQ samples
IQ estimates derived Lynn (2006)
Guestimated IQ if everyone fully lived in First World
Oceania
-2.1
1225
3rd Worldish
62
75
Middle East & South Asia
-0.4
1293
2nd World
84
91
Europe
0.8
1369
1st World
99
99
East Asia
1.2
1416
1st World
105
105
America
-0.75
1366
2nd Worldish
86
93
Africa
-0.2
1280
3rd World
67
80
The below chart shows the correlation of both brain size and education PGS with population IQ, both when IQ is tested in their home countries and then again if tested with benefit of First World environment. Note these are (group-level) ecological correlations (Jensen, 1998), for individuals these correlations would be less than half as strong.
brain size
education PGS
raw population IQ
0.90
0.58
Guestimated population IQ if everyone lived in First World
0.95
0.85
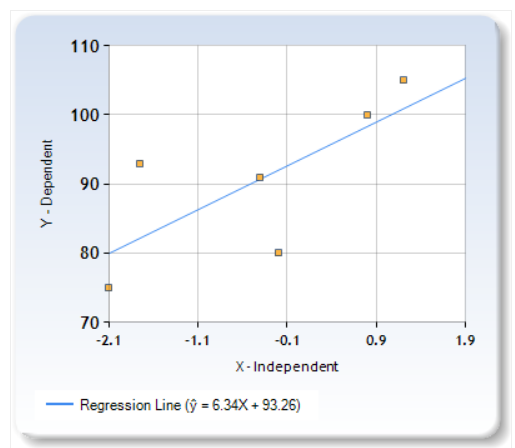
In both cases it seems brain size better predicts the IQ of a people than PGS does. When we compare the two scatter plots we see the line of best fits the data points better when brain size is the predictor:
Until Davide Piffer’s gets access to more full coverage genomes and includes a larger sample of IQ related genes, it’s wise to supplement his PGS scores with brain size data, and perhaps the best predictor of a population’s potential IQ is a combination of both (r = 0.96) but we’ll need a lot more than just six populations to test this conclusively:
+2 SD equates to an IQ of 130 (U.S. norms) on tests like the WAIS. I personally think she’s 138 (which I round to 140), but 130 is still extremely high (top 2% of the U.S. population).
He had a lot more to say about this and many other topics, but I’ll save that for another day. Meanwhile here’s an interview he did with Curt Jaimungal:
Great of Chris to respond because there’s not a person I can think of whose World class IQ has been more authenticated, first by the legendary Ron Hoeflin and than independently by ABC news! I encourage everyone to check out his X account and let me know what you think about the extremely provocative content. It makes sense that Oprah wouldn’t have him on but he’d be perfect for Tucker Carlson, Joe Rogan, Candace Owens or even Breaking Points.
Speaking of Oprah, recently not even a professional psychotherapist was any match for the wit and wisdom of brain that at its peak probably weighed over 2000 grams:
Davide Piffer claims that from the year 700 to 1850, Northern Europe saw a 0.78 standard deviation (SD) Increase in polygenic scores that predict education, and by extension IQ. But does that mean early Medieval Europeans were genetically 0.78 dumber, by which I mean that if we cloned them and raised them in today’s Northern European homes, they would score close to 0.78 SD lower than the average White? IQ 100 vs IQ 88 (U.S. white norms which yield IQs somewhat lower than those normed on the full U.S. population).
To answer this question, we need to look at the polygenic scores of extant populations we can actually test. Figure 12 shows the polygenic scores Piffer found for seven racial groups expressed in standard deviation units. Note that global samples are more genetically diverse than exclusively Northern Europeans so the SD here might be a bit inflated, thus overestimating gaps when applied within Europe.
Nonetheless, when we compare these polygenic scores (PG_Z) with Lynn’s 2006 IQ estimates based on actual IQ scores, we get a 0.58 group level correlation. If we crudely attempt to correct these numbers for the fact that some races suffer from Third World environment (which Lynn estimated subtracts 13 IQ points) or Second World type environments (7 points?), the correlation rises to 0.85.
PGS_Z
IQ estimates derived from Lynn (2006)
Estimated IQ if everyone lived in First World
Oceania
-2.1
62
75
Middle East & South Asia
-0.4
84
91
Europe
0.8
99
99
East Asia
1.2
105
105
America
-0.75
86
93
Africa
-0.2
67
80
When we plot the six races on a simple graph, we see that a 1 SD change in this type of polygenic score predicts a 6.34 point change in expected IQ if raised in First World environments. So if we treat early Medieval Northern Europeans as just another race, their expected IQ in the First World would be 95 because their PGS are 0.78 SD lower that their modern IQ 100 counterparts, thus predicting an IQ that’s 0.78(6.34) = 5 points lower .
Now Piffer might argue that the PGS used in the above graph are low coverage genomes and thus less reliable but the Medieval genomes Piffer uses are also largely low coverage. Piffer might further argue that the races being compared in the graph are too genetically different to be compared on PGS, unlike Europeans separated by only 1000 years. Maybe, but I doubt there’s been enough research on low coverage genomes to say either way and if this method is not yet robust enough to compare extant populations in a species as genetically homogenous as our own, then what hope is there for guessing Neanderthal IQ?
Just wanted to take a moment to wish a happy birthday to one of my favorite journalists Krystal Ball. I just think she and her co-host to an excellent job analyzing the political events of the day. Here they discuss Trump’s fascinating first meeting with Zoran Mamdani. Vivek Ramaswamy mut be so jealous. He spent years kissing Trump’s ass and tolerating MAGA’s anti-black racism, only to be kicked to the curb like yesterday’s trash and told to his face by baby faced MAGA college kids that his Hindu Gods are demons.
Meanwhile his fellow Indian American Mamdani stands up for working people, blacks and Palestinians, threatens to arrest Netanyahu and calls Trump a fascist and suddenly he’s the one who gets Trump’s seal of approval as the newly minted mayor of the most influential city on the planet.
But at least Ramaswamy’s a billionaire, something Mamdani will never be.


 Phenotypic: 98 Genetic: 98
 Phenotypic: 100 Genetic: 100
 Phenotypic: 70 Genetic: 81
 Phenotypic: 82 Genetic: 97
 Phenotypic: 87 Genetic: 99
 Phenotypic: 104 Genetic: 108
 Phenotypic: 80 Genetic: 94
 Phenotypic: 87 Genetic: 97
 Phenotypic: 85 Genetic: 91
 Phenotypic: 77 Genetic: 85