• About

Pumpkin Person

~ The psychology of horror

Pumpkin Person

Category Archives: income

The incredible correlation between IQ & income

11 Thursday Feb 2016

Posted by pumpkinperson in income, Uncategorized

≈ 128 Comments

In this post, I summarize all that I have learned about the actual test scores of different income levels.  In particular, I compare actual psychometric data of seven U.S. economic classes: (1) the homeless, (2) welfare recipients, (3) median Americans, (4) self-made millionaires (5) self-made decamillionaires, (6) self-made billionaires, and (7) self-made decabillionaires, and largely confirm my repeated assertion that average IQ increases by 8-10 points for every ten-fold increase in income, though there may be a few major exceptions to this overall trend.  Also, by analyzing the slope of the standardized regression line predicting IQ from income, I find evidence that the true correlation between IQ and income (at least in America) is much higher than the 0.23  reported in a 2006 meta-analysis and even higher than the 0.4 correlation asserted by Arthur Jensen, and may even approach 0.5.

I also find tentative but shocking evidence that the IQ gap between the richest and poorest Americans may exceed an astonishing 70 points!

In this analysis I am limiting myself entirely to test score data so IQ estimates based on ethnic composition or educational achievements of various economic classes are only occasionally mentioned to buttress the actual psychometric results.  In several cases, the data is somewhat anecdotal, and speculative statistical inferences are sometimes made.

Technical note

For each economic class, I provide two normalized Z scores; one measuring the median financial success, and one measuring the mean or median cognitive ability.  The normalized Z scores are just measures of where each economic class ranks (in financial success or IQ) compared to a reference group (in this case U.S. adults in general, or U.S. adults of a specific age).  For example a Z of +2.33 means you’re in the top 1%, and a Z of -2.33 means you’re in the bottom 1%.  A Z of 0 means you’re right in the middle, etc.

THE HOMELESS: Mean IQ 83 (U.S. norms); IQ 80 (U.S. white norms)

Homeless_Man

Image found here

Median financial success: 0.09 percentile of U.S. adults (normalized Z = -3.13)

In 2015, roughly 423,750 American adults were homeless on a given night: One in 572 American adults (0.17%).  Thus it can be estimated that the median homeless person is financially in the bottom 0.09%

 Median cognitive ability: 12.8 percentile of U.S. adults (normalized Z = -1.17)

A 2004 study found that 90 homeless men living in a large shelter in Milwaukee, Wisconsin, had a mean WASI full-scale IQ of 83.92 (standard deviation = 15.24).  The WASI was published in 1999, and this study was published in 2004, so we should subtract 1.5 points for old norms which are thought to expire at a rate of 0.3 points a year (the Flynn effect), so the homeless likely have a mean IQ of 82.5 (U.S. norms) or about 80 (U.S. white norms).

One problem with this study is that 81% of the sample was black (much higher than the 45% among homeless Americans in general) and these tend to score lower on IQ tests, at least in the general population, however a UK sample of homeless obtained virtually identical scores on the WASI, despite being 96% white.

In the  UK study, the WASI full-scale IQ distribution of the homeless has a mean of 84.3. In this study, published in 2011, the WASI norms were by now even more outdated, so we should probably subtract 3.6 points for old norms, so this homeless sample have a mean IQ of 80.7 (U.S. norms) or about 78 (U.S. white norms).

Given the IQ of 80.7 (U.S. norms) among the the virtually all-white U.K. homeless sample, the IQ of 82.5 among the mostly blacks American sample is unlikely to be deflated by race, thus 83 is considered the best estimate of the American homeless.

WELFARE RECIPIENTS: Mean IQ 92 (U.S. norms); IQ 90 (U.S. white norms)

washington_house

Image found here

Median financial success: 8.5 percentile of U.S. adults (normalized Z = -1.4)

About 17% of U.S. adults between age 18 and 64 receive public assistance.  Thus the median welfare recipient can be thought of as in the bottom 8.5% financially.

Mean cognitive ability: 30 percentile of U.S. adults (normalized Z = -0.53)

It’s common knowledge in psychometric circles that reading comprehension tests are statistically equivalent to IQ tests, and a literacy study found that about 2/3 to 3/4 of adult welfare recipients (about 71%) have what’s classified as Level 1 or Level 2 literacy.  By contrast, 1/2 of the general adult population are at these levels.

Since by definition, 1/2 of Americans have IQs below 100, it can be deduced that 71% of welfare recipients have IQs below 100.  In a normal distribution, the 71 percentile is 8 IQ points (0.53 sigma) above the mean, so if IQ 100 is the 71 percentile among welfare recipients, the average welfare recipient should have an IQ 8 points less.

In other words, American welfare recipients average IQ 92 (U.S. norms) or about 90 (U.S. white norms).

Some might object that my analysis falsely assumes welfare recipients have the same IQ variance as the general U.S. population, but the above cited studies of the homeless suggest that poor Americans do indeed have a similar variance to Americans on the whole.

MEDIAN AMERICAN:  Mean IQ 100 (U.S. norms); IQ 97-98 (U.S. white norms)

avhouse

A house fit for the median American.  Image found here

Median financial success: 50th percentile of U.S. adults (normalized Z = 0)

By definition, the median American is at the 50th percentile financially.

Median cognitive ability: 50th percentile of U.S. adults (normalized Z = 0)

By definition, the median American is at the 50th percentile cognitively.

SELF-MADE MILLIONAIRES: Mean IQ of 118 (U.S. norms); IQ 117 (U.S. white norms)

millhouse

A house fit for a millionaire.  Image found here

Median financial success: 99th percentile of Americans in their 50s (normalized Z = +2.33)

According to the 2000 book The Millionaire Mind by Thomas J. Stanley, which reported on a survey of 773  millionaires (defined here by household, not individual net-worth), the typical self-made millionaire is a 54 year-old man.  In the year 1998 (when the millionaires were surveyed), it took an individual income of about $340,000 to make the top 1% for 52-58-year-olds.  The surveyed millionaires had a median income of $436,000, but because this was household income, their spouses likely contributed, so in individual income they were likely not much higher than the top 1%

Mean cognitive ability: 88th percentile of U.S. adults (normalized Z = +1.2)

The average self-reported SAT score of the millionaires Stanley survey was 1190, which Stanley adjusted to about 1100 because of self-reporting bias (millionaires who were “A students” were more likely to recall their scores than “C students”).  Since 90% of the sample were college graduates it’s likely virtually all took the SAT.

Since the typical self-made millionaire in the sample was 54 as of 1998, it’s likely he took the SAT circa 1961 (when he was 17).  According to the book The Bell Curve (page 422), if all American young adults (not just the college bound elite) had taken the SAT in 1960, the average score (IQ 100; U.S. norms) would have been 784.  Meanwhile prior to 1974, an SAT score of 1300 was considered Mensa level (IQ 130).  Extrapolating from these two data points, the average self-made millionaire has an IQ of 118 (U.S. norms); 117 (U.S. white norms).

SELF-MADE DECAMILLIONAIRES: Mean IQ of 118 (U.S. norms); IQ 117 (U.S. white norms)

David-Beckham-house

Image found here

Median financial status: 99.9th percentile of Americans in their 50s (normalized Z = +3.1)

20% of Stanley’s millionaire sample earned at least $1 million a year in household income, and many of these probably earned much more than that, and presumably the bulk of this was individual income made by by the head of households Stanley surveyed, not their spouses.  Anyone in their 50s who has been earning a million a year for a long period of time, likely has, or will have, a net worth over $10 million (decamillionaire status).  In the year 1998 (when the millionaires were surveyed), it took an individual income of about $1.25 million to make the top 0.1% for 52-58-year-olds.

Mean cognitive ability: 88th percentile of U.S. adults (normalized Z = +1.2)

Above I noted that millionaires had a mean SAT score equating to IQ 118 (U.S. norms); 117 (U.S. white norms).  Because Stanley found virtually no correlation between income or net-worth among the millionaires themselves it might be assumed that the decamillionaires in his sample also averaged IQ 118.  Of course if the data was not normalized, the zero correlation might be misleading.

SELF-MADE BILLIONAIRES: Mean IQ 133 (U.S. norms); IQ 132 (U.S. white norms)

tenmill

Image found here

Median financial success: 99.99993 percentile for baby boomers (normalized Z = +4.8)

About 80 million Americans were born between 1946 and 1964 (the baby boomers).  People in this age groups are about 42% of the richest Americans.   There are 277 self-made billionaires in America (see appendix A of this document).  If we assume 42% of these are boomers, then 116 of America’s 80 million boomers are self-made billionaires, which means the median self-made billionaire boomer is the 58th most prosperous out of 80 million, equating to the 99.99993 percentile.

Mean cognitive ability: 98.6 percentile of U.S. adults (normalized Z = +2.2)

Several boomer billionaires have SAT scores that are apparently publicly known.  Bill Gates claims to have scored 1590 and Paul Allen reportedly scored 1600.  On the pre-1995 SAT, these scores equate to IQs of about 170.  I can no longer find any internet sources reporting Steve Ballmer’s composite SAT scores,  but he reportedly scored a perfect 800 on the math section of the SAT which seems to equate to an IQ of 150, but given that he hit the ceiling on the test, and is rumored to be in the same IQ league as Gates himself, this is likely an underestimate.  Perhaps the best publicly known measure of his IQ is his performance on William Lowell Putnam Mathematical Competition where he performed even better than Gates.  If this source is reliable, Ballmer got one of the 100 best scores on the exam in 1974, but probably not one of the top 45, so let’s split the difference and assume he came in 73rd.

Ballmer was one of the 4,308,000 Americans born in 1956, and assuming almost all of the top math talent from his cohort went on to compete in the 1974 Putman (and whatever shortfall was made up by top foreign talent and by older and younger talent), then Ballmer’s score equates to the top 73 out of 4,308,000 (one in 59,000 level) which equates to an IQ of 162.

Thus at least three of the roughly 116 self-made boomer billionaires in America (2.6%) have tested IQ equivalents of at least 162+.  It’s possible some of these scores have been exaggerated, but it’s also possible there are other super brilliant self-made billionaires with unknown  high test scores.  Both possibilities negate one another, making 2.6% perhaps a reasonable estimate.

In the general U.S. population, the top 2.6% have IQs of 129+, but in the self-made boomer billionaire population, the top 2.6% have IQs of 162+.  This suggests their entire bell curve is shifted 33 IQ points to the right, so just as the average American has an IQ of 100, the average self-made boomer billionaire should have an IQ of 133, though given that the average is extrapolated from just three outliers (Gates, Allen and Ballmer) who all got rich from one company (Microsoft), it should be interpreted with great caution.  Nonetheless, it is roughly consistent with research showing that 43% of self-made billionaires attended colleges indicative of top 1% ability (IQ 135+) (see table 1 of this document) and is also roughly consistent with the ethnic composition of the Forbes 400 richest American list, though there are some anomalies.

Some might object that my estimate for the average IQ of self-made boomer billionaires assumes the super rich have the same IQ variance as the general U.S. population, however a study of the homeless (cited way above) found that even folks at the economic extreme have a standard deviation of 15, like Americans as a whole.

SELF-MADE DECABILLIONAIRES: Mean IQ 151 (U.S. norms); IQ 151 (U.S. white norms)

firstbill

A home fit for a decabillionaire.  Image found here

Median financial status: 99.99999th percentile of baby boomers (normalized Z = +5.23)

Of the 80 million Americans baby boomers, only 13 were self-made decabillionaires in the Oct 19, 2015 issue of Forbes magazine, so the median self-made decabillionaire boomer is the 6.5th most prosperous person in that age group (one in 12.3 million)

Mean cognitive ability: 99.97 percentile of U.S. adults (normalized Z = +3.4)

Of the 13 self-made decabillionaire boomers, at least three (23%) reportedly have test scores equating to IQs of 162+ (Gates, Allen and Ballmer as mentioned above).

If we assume that the IQs of self-made decabillionaire boomers are roughly  normally distributed with the same variance as in the general U.S. population (see above), then the fact that 23% have 162+ IQs implies an average IQ of 151, though given the small number of data points, this could just be a fluke.

But it’s worth noting that self-made decabillionaires have perhaps roughly double the rate of elite college attendance as U.S. self-made billionaires in general.  Futher, when I analyzed the ethnic and racial background of self-made decabillionaires in 2009 (all generations) it implied a mean IQ of about 150.

Despite this corroboration, an IQ of 151 is so incredibly high that it should still be considered tentative.  And even assuming its veracity, it may only apply to decabillionaires of the baby boomer cohort and younger.  Older decabillionaires came of age before the rise of high tech and big data, and thus may not have needed anywhere near as much IQ to get rich.

One might not think an IQ of 151 is that extreme for elites given that SAT IQ equivalents this high are not uncommon at the most elite colleges in America, however it’s worth repeating yet again that the IQs of elite college students will regress precipitously when they move from the SAT (the test that selected them) to a neutral IQ test.  By contrast, decabillionaires were mostly selected by the market, and only partly by their SAT scores creating opportunities, so unlike Ivy League students,  their SAT IQ equivalents are perhaps not inflated by selection bias.

Summary

Below is a summary of the data in bar graph form:
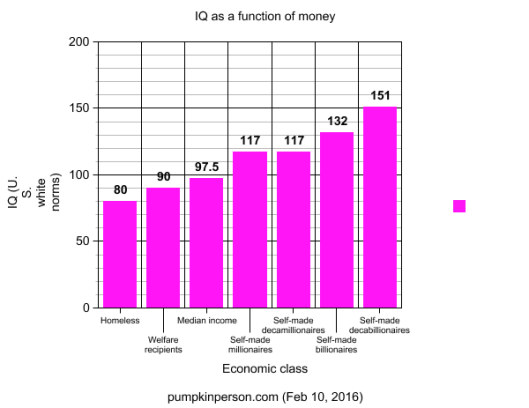
supernew

Below is a summary of the above data in table form.

economic class median earned income median wealth financial success (normalized u.s. z for age grouping) iq (u.s. z) iq (u.s. norms) iq (u.s. white norms)
self-made decabillionaires 10 figures 11 figures +5.23 +3.4 151 151
self-made billionaires 9 figures 10 figures +4.8 +2.2 133 132
self-made decamillionaires 7 figures 8 figures +3.1 +1.2 118 117
self-made millionaires 6 figures 7 figures +2.33 +1.2 118 117
median income 5 figures 5 figures 0 0 100 97-98
welfare 4 figures 4 figures -1.4 -0.53 92 90
homeless 3 figures 1 figure -3.13 -1.17 83 80

For every ten-fold increase in income, mean IQ increases 8-10 points

The simplest way to think of the IQ income relationship is that for every ten-fold increase in income, average IQ increases 8-10 points (U.S. white norms).  Of course there are some major anomalies.  Self-made decabillionaires are 10 times more prosperous than self-made billionaires, yet appear to score 19 IQ points higher, though these numbers are tentative given limited data.  Meanwhile self-made decamillionaires are ten times more prosperous than self-made millionaires, yet appear, based on Thomas Stanley’s research, to be equally intelligent.  One possible reason for this is that the the correlation between IQ and money is partly mediated by years of education, but once you have enough education to be a millionaire (i.e. law school or medical school), even more schooling doesn’t help much. and may even have opportunity costs.

These anomalies notwithstanding,  when I graphed average IQ (Y axis) as a function of income (number of figures earned per year)(X axis), there was a nice linear relationship overall:  IQ (U.S. white norms) = 9.487319(number of figures) + 52.57971

figures

Standardized regression slope & correlation coefficient

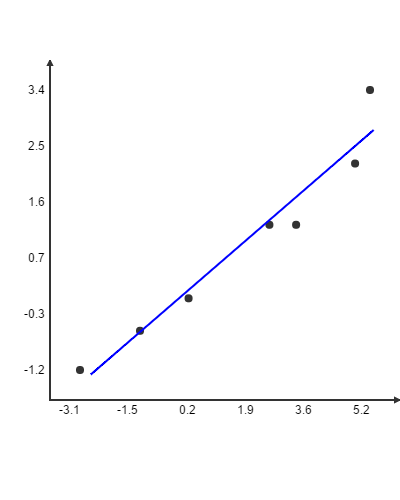
I also graphed average IQ as a function of money again, but this time expressed as normalized Z scores, with average IQ of the seven economic classes on the Y axis, and median financial success on the X axis:
five

IQ Z score = 0.489421(financial normalized Z score) + 0.135804

As the above graph shows, there’s a virtually perfect (r = +0.97) correlation between economic class and mean/median measured intelligence, when both variables are expressed as normalized Z scores.

Note, this near-perfect correlation between median financial success and mean IQ  should not be confused with the correlation between individual IQ and individual financial success.   The former is known as as an “ecological” correlation commonly used in epidemiological research, and tends to be higher because individual level variation cancels outs.  However because the Z scores are based on the normalized distributions of individuals, the slope of the regression line (+0.49) will equal the individual level correlation.

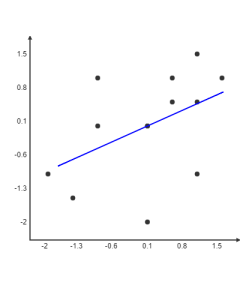
The actual scatter plot of a random group of individuals (with IQ Z on the Y axis and income Z on the X axis) would probably look as follows:

genpop

Notice first that the range of Z scores on both the X and Y and axis is much less.  That’s because most people in a random sample of Americans are ordinary in both income and IQ.  Note also the enormous variation around the line of best fit.

Now if you extended the range of X and Y much much further, and if you plotted the mean Y for every X, instead of every Y for every X, you should get a scatter plot that looks very much like the ecological scatter plot.

But note that in both the the ecological scatter plot, and the individual scatter plot, the slope should be the same because the line of best fit can be thought of as a line connecting the average Y of a given X, so graphing average Ys instead of individual Ys, does not change the line of best fit, it simply eliminates almost all the scatter around it.

Discussion

A correlation of 0.49 is more than double the 0.23 correlation between IQ and income reported in a 2006 meta-analysis by Tarmo Strenze and nearly triple the 0.16 correlation between IQ and net-worth found in a 2007 study by Jay L Zagorsky, however it is similar to the 0.4 correlation between IQ and income asserted by authoritative Arthur Jensen in his 1998 book The g Factor.

Why did my indirect method (regression slope analysis) result in double the correlation found by Strenze’s meta-analysis of direct studies of IQ and income?

Many studies are based on individual income instead of household income.  Because many women (and some men) choose not to work outside the home, their individual incomes are technically zero, but they should not be considered the equivalent to a homeless person with zero income, because they are in fact working in the home and thus earning at least some of their household income.  Because there’s no agreement on how to quantify such indirect forms of income, it’s not counted which greatly limits the IQ-income correlation.  Using household income instead of individual income seems to result in a higher correlation between IQ and income (+0.37) but even this is an imperfect solution, because all adults within a household don’t contribute equally to the household income.

In addition, many studies use only a single year’s income which is obviously quite unreliable, since massive income fluctuations can occur from year to year.

In my analysis, both of these problems were sidestepped because data points were collected primarily from head of households (self-made millionaires, self-made billionaires) or non-households (the homeless) so you didn’t have to worry about how to deal with indirect income (i.e. the spouse of a millionaire who technically earns nothing, but earns her million dollar life by being a good wife).

Also, my analysis focused on fairly stable economic classes (homeless, welfare, millionaires, billionaires) that reflect lifelong patterns of financial success, and not just a single year’s income.

All this may explain why I found a much higher IQ-income correlation than is usually reported.

A reader informed me of an excellent analysis by Dalliard of Human Varities who found that in a large representative sample of Americans in their 30s and 40s, a single year’s income correlated 0.31 with IQ, but averaging income over many years increased the correlation to 0.36.  When Dalliard looked at the correlation in only men (thus, also sidestepping the complication that many women earn their lifestyle as wives instead of through direct income), the correlation leaped to 0.48 (virtually identical to the 0.49 correlation I also found by sidestepping these two problems).

Share this:

  • Twitter
  • Facebook

Like this:

Like Loading...

Estimating the IQ of Donald Trump

22 Wednesday Jul 2015

Posted by pumpkinperson in income

≈ 161 Comments

Because intelligence can be defined as the ability to adapt; to take whatever situation you’re in and turn it around to your advantage, rich people should be smarter than poor people.  I came up with the theory that in America, for every ten fold increase in money, average IQ jumps about 10 points (give or take).  So:

Homeless people: Average IQ 76

Four figure income earners: Average IQ 86

Five figure income earners: Average IQ 96

Self-made millionaires: Average IQ 106

Self-made decamillionaires: Average IQ 116

Self-made centimillionaires: Average IQ 126

Self-made billionares: Average IQ 136

Self-made decabillionaires: Average IQ 146

Now Donald Trump claims to be worth $10 billion, but as a master of self-promotion, that figure might be wildly exaggerated.  Authoritative Forbes magazine (the gold standard for wealth valuation), recently put his net worth at $4 billion.  However New York Times journalist Timothy O’Brien claimed in 2005 that Trump’s net worth is a measly $200 million, though Trump sued O’Brien for claiming this.

I’m going to go with Forbes magazine and assume Trump is worth $4 billion.  This might suggest an IQ around 136.  However Trump inherited a huge chunk of his fortune and brand from his father, who was a 20th century centimillionaire (equivalent to a billionaire today).  So perhaps it was Trump’s father who might have been around 136 IQ.  Since the father-son IQ correlation is 0.45, Trump’s IQ might only be 45% as far above the U.S. mean of 96 as his dad was, giving him an expected IQ of:

0.45(136 – 96) + 96 = 114

However Trump multiplied his inheritance many times over, so his IQ is likely higher than an inheritance billionaire (IQ 114), but lower than a self-made billionaire (IQ 136).  I’m guessing his IQ is around 125, which is higher than 95% of White America, but even that isn’t always enough.

Trump recently got severely criticised for minimizing John McCain’s war hero status, which was a colossally stupid mistake for someone running as a Republican.  Trump has been surging in the polls because he was willing to insult anyone, but I suspect he miscalculated in this case, and it will hurt him, and it’s a mistake I don’t think he would have made had his IQ been 10 points higher.  IQ is much like money.  No matter how much you have, you never get to a point where you don’t need more.

As the great J.P. Rushton once explained to me, all of us have successes, all of us make mistakes, but high IQ people tend to get further ahead in life, partly because they make fewer mistakes.

Meanwhile here’s rare footage of Trump contemplating the presidency way back in the 1980s on Oprah:

Share this:

  • Twitter
  • Facebook

Like this:

Like Loading...

Charles Murray is wrong: the SAT IS a ‘Student Affluence Test’

08 Wednesday Apr 2015

Posted by pumpkinperson in income

≈ 78 Comments

The brilliant Charles Murray is finally wrong about something.

Iconic blogger Steve Sailer recently blogged about the following comments by Murray:

The results are always the same: The richer the parents, the higher the children’s SAT scores. This has led some to view the SAT as merely another weapon in the inequality wars, and to suggest that SAT should actually stand for “Student Affluence Test.”

It’s a bum rap. All high-quality academic tests look as if they’re affluence tests. It’s inevitable. Parental IQ is correlated with children’s IQ everywhere. In all advanced societies, income is correlated with IQ. Scores on academic achievement tests are always correlated with the test-takers’ IQ. Those three correlations guarantee that every standardized academic-achievement test shows higher average test scores as parental income increases.

What Murray is saying, obviously, is that rich kids do well on the SAT because they have high IQ genes and the rich environment they were raised in has little effect. I’d hate to throw Charles Murray under the bus, because he along with Steve Sailer really paved the way for people like me to talk openly about behavioral genetics, but in my scientific judgement, he’s wrong.

On the combined verbal and math section of the new SAT, kids from homes earning over $200 K a year average 1157 while kids from homes earning less than 20 K a year average 895. On a scale where the U.S. mean is set at 100 (SD = 15) these scores are equivalent to IQs of 118 and 100 respectively (note only the most academic third of America tends to take the SAT so scores are high). That’s a difference of 1.2 standard deviations in kids coming from homes that are 3.07 standard deviations apart in normalized income. 1.2/3.07 = 0.39, suggesting the correlation between SAT scores and the income of your parents is about 0.4.

But even 0.4 is an underestimate, because among rich kids, taking the SAT is very common, but among poor kids with little hope of affording college, it’s largely the best and brightest who take the SAT, so if everyone took the SAT, the correlation between SAT scores and your parents’ income would be well above 0.4.

But 0.4 is widely cited as the correlation between IQ and one’s own income (see Jensen, 1998). One would expect IQ to correlate much less with your parents’ income, because a teenager’s IQ correlates no more than 0.6 with the mid-parents’ IQ; thus the correlation should be 0.4(0.6) = 0.24. Instead, if the SAT is used instead of an official IQ test, it’s almost double that.

Clearly, the SAT is culturally biased in favor of kids from rich homes (and probably educated homes) and biased against kids from poor (and probably uneducated homes). And this is not the first time we’ve seen this effect. In the Minnesota Transracial Adoption Study, black kids adopted into white professional homes scored the equivalent of IQ 95 on measures of scholastic aptitude and achievement, but scored an IQ of only 84 (about the same as black Americans raised by their biological parents) on the WAIS (an official IQ test).

What this suggests is that the SAT probably underestimates the ability of kids from low SES homes, and overestimates the ability of kids from high SES homes. I’ve even noticed this with celebrities. Bill Cosby, Howard Stern, and Rosie O’Donnell have all come from low SES homes and have all claimed to have scored poorly on the SAT, but all strike me as highly intelligent. By contrast George W. Bush did well on the SAT and comes from an extremely high SES background, but does not strike me as intelligent. The SAT would probably better reflect IQ if scores were corrected for SES, but one must be careful not to over-correct, because over half the test’s correlation with such measures is probably genetic.

Share this:

  • Twitter
  • Facebook

Like this:

Like Loading...

The causal link between IQ, education, & income

07 Tuesday Apr 2015

Posted by pumpkinperson in income

≈ 58 Comments

Although IQ and income are positively correlated at a value of about 0.4, commenter Mugabe feels this is mostly just an artifact of education, writing:

as LotB has mentioned: high IQ leads to high educational attainment and to connections and this really is more than sufficient to explain all of the correlation.

that is:

smart people get good grades and get into good schools and are socialized and etc.

the effect of IQ ceteris paribus is positive but not by much.

I agree that if you controlled for education, the correlation between IQ and income would be greatly diminished, probably going from 0.4 to less than 0.2. The Lion of the Blogosphere sometimes goes even further, suggesting that if you control for certain forms of education, the correlation between IQ and income might even be negative.

Way back in the 1990s, even the book The Bell Curve (which really popularized the link between IQ and money) admitted that among graduates of Harvard, there might even be a negative correlation between IQ and income if the brightest students go into research where they earned a modest living, while the dullest went into business where they might get rich.

But what if anything does this tell us about the independent effect of IQ on income? Does it prove that smart people get rich primarily because they have the right credentials, and not because they are better at adapting to the real world?

The problem with controlling for education is you’re not comparing different IQ levels with all else being equal, because when an IQ 110 and an IQ 150 both have an AB in English from Princeton, the lower IQ person probably has non-cognitive advantages (i.e. strong work ethic, rich well connected family, affirmative action, etc) that allowed him to achieve the same degree as someone 35 IQ points smarter, and those same advantages will help him make a high income when he leaves Princeton.

Similarly, when an IQ 67 and an IQ 107, both have only a 10th grade education, the IQ 107 must have non-cognitive liabilities (i.e. extreme laziness, low socioeconomic background, mental illness etc) that explain why he has the same education as a mentally retarded person despite having above average IQ.

Given this, we might expect lower IQ people to do relatively well economically when you control for education and higher IQ people to do relatively poorly, because controlling for education causes the lower IQ person to be advantaged in many non-cognitive domains.

Thus the ideal way to compare the independent effects of IQ and education on income is to take a random sample of American kids ranging from IQ 50 to 150, and send them all to Princeton, and instruct the professors to give them all a Magna Cum Laude AB in English, and instruct all the other students to network with them all equally, and then send them all out into the world to see who makes the most money with their fancy credential.

I have a feeling that if you controlled for education under these experimental conditions, you might even get a higher correlation between IQ and income then the 0.4 in the uncontrolled general population, because almost everyone with an IQ below 115 would be incapable of even doing the jobs their fancy degrees qualified them for, and would have nothing left to fall back on. And because the experimental sample has a wide range of IQs, we also don’t get the problem of range restriction that normally limits correlations in educationally homogeneous groups.

But even among those capable of doing the jobs, I would expect only a small decline in the IQ-income relation, because having assigned random people of different IQs the same degree, we don’t get the phenomenon of the lower IQ person having compensatory assets that normally occurs when people of different IQs obtain the same degree.

Alternatively, if we took a random group of Americans ranging from IQ 50 to 150, and denied them any formal schooling at all, it would be interesting to see the correlation between IQ and income. Once again, I think the correlation could possibly be even higher than in the uncontrolled general population, because with no schooling at all, high IQ people would be far more likely to acquire the basic literacy, numeracy, and social skills required to hold a job, while low and mediocre IQ people would simply end up unemployed, in jail, or homeless.

Share this:

  • Twitter
  • Facebook

Like this:

Like Loading...

Beating up the homeless

18 Wednesday Feb 2015

Posted by pumpkinperson in income

≈ 42 Comments

Sometimes I get really depressed by the evil of human nature. It seems like for a lot of middle income youths, beating the crap out of some poor defenseless homeless person is entertainment.

This shows that if you don’t have money, society looks at you as subhuman, worthy of being kicked around and in some cases even urinated on.

But there’s also something Darwinian about it. Those who can’t adapt to the environment (i.e. earn money) are victimized by those who can. We see this all over the animal kingdom but humans are unique in that they are one of the few animals that victimizes the weak just for the sheer sadistic pleasure it gives them, while other animals victimize only for food.

Some people like to talk about how the rich are evil because they make their money by exploiting the middle income earners, but it’s the middle income earners who go around beating up and urinating on the homeless. You don’t see millionaires going around beating up and urinating on average Americans. Nor do you see billionaires like Bill Gates and Warren Buffet beating up and urinating on millionaires. I suppose Marxists would say they do it metaphorically.

A lot of middle income people adopt the self-serving philosophy that the poor are poor because of stupidity and the rich are rich because of evil, and only they, the middle income people, have both brains and morality. But I think this only half true. Yes, the rich are probably more evil than middle income Americans (on average), but they’re also probably a lot smarter. And yes, the poor are probably a lot dumber than middle income Americans, but they are also probably a lot less evil.

So just as middle income Americans look down at the homeless for being stupid, the rich can also look down at the middle incomes for being stupid. And just as the middle incomes can look down at the rich for being evil, the homeless can look down down at the middle income for being evil. Occam’s razor implies that whatever positive or negative traits associated with money probably apply about as much as to those who are richer than you as to those who are poorer than you.

The video below, where a homeless person offers a middle income person a hug after getting beat up, demonstrates the superior morality of the homeless over the middle-income Americans that torment them.

Share this:

  • Twitter
  • Facebook

Like this:

Like Loading...

Correlation between IQ and income no higher in the U.S. than in other countries

20 Saturday Dec 2014

Posted by pumpkinperson in income

≈ 44 Comments

I had once stated in the comment section of this blog that the correlation between IQ and income was higher in the U.S. than in the rest of the developed world. I had based this claim on various studies I’ve seen reported, but on page 103 of this book, it states that a meta-analysis showed the IQ-income correlation is no higher in the U.S..

I would have expected the IQ-income correlation to be higher in the U.S. because the U.S. is a country where you can get ridiculously rich. Understanding the value of money more fully, I would have expected high IQ Americans to be more motivated to pursue it, considering there was so much more to be made and that this would have increased the correlation between ability and income, but the studies fail to confirm this theory (though I doubt business income is well captured by such studies). I also would have expected the generous social safety nets in other developed countries to have disincentived a lot of smart people from working hard, making the IQ-income correlation lower in other developed countries.

But one of the commenters here has long argued that elites outside North America are more selected for IQ because the colleges recruit more based on test scores than on other criteria. This argument is ironic because while other countries do test for academic knowledge acquired in school, the college system in the U.S. is unique in that it uses the SAT, which was specifically intended as an IQ test according to a FRONTLINE article:

The design of the SAT was based on the IQ test (see historical timeline) The French psychologist Alfred Binet created the first test of intelligence in 1905. It was to be used to identify slow learners so that teachers could give them special attention. This test would later be known as the IQ test–IQ standing for “intelligence quotient,” or the ratio of mental to physical age.

Because the SAT was devised as a tool to identify talented students from underprivileged backgrounds, it was thought of as a test that would measure an innate ability referred to as “aptitude,” rather than abilities that these students might have developed through school.

“When these tests were originally developed,” said Harvard social policy professor Christopher Jencks, “people really believed that if they did the job right they would be able to measure this sort of underlying, biological potential. And they often called it aptitude, sometimes they called it genes, sometimes intelligence.”

You would expect the country that deliberately tried to recruit their elites using an IQ test to have a higher correlation between IQ and income than other countries that simply tested students on how much they learned in high school, but since how much you learn in high school is largely determined by your IQ, colleges in other countries probably did a good job screening for IQ in spite of themselves.

This demonstrates that societies end up selecting their elites for IQ whether they intend to or not. Even a society that was actively hostile to IQ, would still need elites with important skills to run their institutions, and since important skills are highly correlated with IQ, it’s almost impossible to recruit useful skills without also recruiting IQ.

Indeed the fact that brain size roughly tripled as apes evolved into people shows that nature itself was selecting for intelligence, millions of years before tests or even schools were invented.

Smart people tend to get to the top naturally.

It’s interesting that now that IQ testing is controversial, the college board wants to deny that the SAT is an IQ test. The frontline article reports:

According to the College Board, the SAT now does not measure any innate ability. Wayne Camara, Director of the Office of research at the College Board told FRONTLINE that the SAT measures “developed reasoning,” which he described as the skills that students develop not only in school but also outside of school. He pointed out, for example, that students who read a lot, both in and out of school, are more likely to do well on the SAT and in college. The College Board says that the best way to prepare for the SAT is to read a lot and to take rigorous academic courses.

Elite colleges get to have their cake and eat it too. They are benefiting from a test format created by IQ researchers in recruiting high quality students, yet maintaining their liberal street cred by denying IQ. But if they really believe the SAT is only measuring developed skills, then they should use tests that directly measure academic knowledge like other countries do. But they don’t, perhaps because deep down, they believe the SAT is a better measure of IQ than tests used in other countries, even though tests used in other countries still measure IQ despite not being designed for that purpose. But since the SAT is a more efficient measure of IQ, they are able to give test scores less weight, which allows elite colleges to give more weight to subjective criteria while still keeping the average IQ of their students high.

Share this:

  • Twitter
  • Facebook

Like this:

Like Loading...

Bill Cosby’s high IQ caused high income independently of education

25 Tuesday Nov 2014

Posted by pumpkinperson in income

≈ 171 Comments

Given that Bill Cosby rose from humble beginnings to become one of the richest, most beloved, and most influential people in America, during an era of great racial discrimination, it’s interesting to ask what his IQ is. An article in tvguide.com provides a clue (emphasis mine):

Though Cosby is a prominent education advocate, he was a terrible student in school, opting to be the class clown instead of studying up. Because he never opened his geometry book, Cosby, who had the highest IQ in his grade, once took 12 pages to work out one of four problems on a test. He ended up getting that one right, but failed the test because he didn’t have time to attempt the other questions. The SATs? He scored a 500 total.

Critics of IQ tests (and even supporters like the Lion of the Blogosphere) often claim that IQ correlates with success, not because high IQ people behave intelligently in real life, but because you need to score high on the SAT (a disguised IQ test) to get into a good college to get into a successful career. In other words, test scores become a self-fulfilling prophecy, skeptics charge.

But Cosby is an example of someone who had the highest IQ in his grade and went on to become the richest and most popular African American of his generation despite flunking the SAT and attending a crappy college. In other words, he did well on the IQ test that didn’t matter, yet flunked the IQ test used for college admissions, yet still achieved spectacular success. This would indicate that IQ scores predict success because they predict intelligence, and not because they predict all important SAT scores.

An interesting study would be compare the future incomes of kids who flunked their SAT but did well on a regular IQ test with kids who flunked a regular IQ test but did well on the SAT. If the SAT > regular IQ test group was not more successful, then the “IQ scores are a self-fufilling prophecy” theory is debunked.

Here once again is Bill Cosby talking about his SAT scores:

Share this:

  • Twitter
  • Facebook

Like this:

Like Loading...

Hypocrites who deny linear IQ income correlation

09 Sunday Nov 2014

Posted by pumpkinperson in income

≈ 121 Comments

Evidence continues to debunk the popular idea that IQ is largely irrelevant to success above 120, and my less successful readers are going absolutely ballistic. The reason this idea is so popular (and its debunking so threatening) is that the internet is crawling with people who are either only moderately intelligent or only moderately successful; and they take comfort in believing they achieved their modest success by being way smarter than the homeless guy on the street, but hysteria ensues if you suggest that some gazillionaire pizza mogul is richer than they are because of brains. Thus, these self-serving elitist snobs want IQ and money to be correlated, but only up to either their level of money or their level of IQ (whichever comes first). This allows them to feel intellectually superior to the poor who they view as too dumb to meet basic needs, while also feeling morally superior to the rich who they view as greedy and ruthless.

This is reminiscent of the white supremacists of old who believed that IQ and brain size were only correlated at the low end, because tropical people had small brains, but irrelevant at the high end, since Mongoloid races had the biggest brains. Stephen Jay Gould mocked this as an unbeatable argument: “Deny it at one end where the conclusions are uncongenial; affirm it by the same criteria at the other.”

Unfortunately for the hypocrites, statistics seldom work that way.

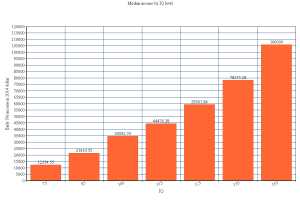
The median income (in 2014 dollars) of seven different IQ levels:

dollarbar

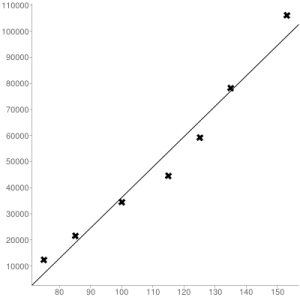
In the above chart, the income for IQ 153 people was documented here. The incomes for all the other IQ levels was documented here, but because those were in 1993 dollars, I converted them to 2014 dollars using this calculator. The below scatter plot shows how linear the relationship is, well above IQ 120:

dollarscat

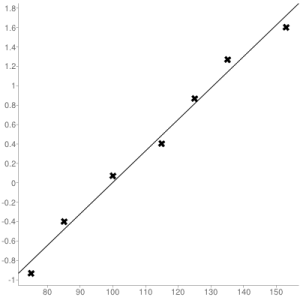
Because income can be quite skewed at the extremes, it also makes sense to convert raw dollars into normalized Z scores. This was accomplished in the below chart by converting the above dollar values into income percentiles for Americans in their early 30s using this calculator. The incomes are then assigned Z scores based on the Gaussian distribution. When this is done, the correlation between IQ and income continues to be beautifully linear well above IQ 120:

normscat

Share this:

  • Twitter
  • Facebook

Like this:

Like Loading...

Income above 150 IQ

08 Saturday Nov 2014

Posted by pumpkinperson in income

≈ 75 Comments

Tags

gifted

There’s a popular idea, promoted by Malcolm Gladwell, that IQ only matters up to about IQ 120. In a previous post I showed that at least when it comes to income, IQ continues to substantially predict success well above 120. But perhaps the idea of an optimum IQ is correct, but Gladwell just set the bar too low. The smartest person I have ever corresponded with (a Promethean with an IQ around 180) insisted that the optimum IQ was about 130, and that not only were additional IQ points beyond 130 unhelpful to success, but that they actually might be harmful. He argued that up to half the people he knew with IQ’s above about 150 were failures by conventional standards working in unskilled jobs or not working at all and living off welfare. I found this very hard to believe, because from a Darwinian perspective, intelligence is the overall cognitive ability to adapt situations to your advantage (problem solve), so the idea that one could be so cognitively adaptable that one was maladaptive was paradoxical indeed. But that’s a philosophical argument; what does the actual data show?

For the first time we actually have data thanks to a longitudinal study of kids who before age 13 scored above the one in 10,000 level for their age group on either the verbal or math section of the old SAT. How this study knows what the one in 10,000 level is for 12-year-olds, I’m not sure, since so few 12-year-olds take the SAT, but I guess they assume they’ve tested virtually all the brightest ones in the country. Now, a score above the one in 10,000 levels implies an IQ of 156 or higher, so on average I’m guessing these kids were IQ 158 (one in 20,000 level) on either the verbal or math section. However since they averaged IQ 158 on only one section of the SAT, their IQs on the overall SAT would probably regress a bit to the mean, though not too much, since the overall SAT probably correlates above 0.9 with either subscale. Thus their overall IQs were probably 0.91(158 – 100) + 100 = 153.

So how successful were these kids by the time they were in their 30s? Table 1 in this paper reports that they created lots of art work, publications, and inventions, but the bottom line is that their primary annual incomes ranged from a pathetic $1,200 to a stratospheric $1,400,000, with a median of $80,000. Now if you read the small print beneath Table 1, it states that these dollar amounts were collected when they were 33, and have not been adjusted for inflation.

So let’s adjust for inflation. $80,000 circa 2002 is like $106,000 today. In other words, adjusted for inflation, the median of this highly gifted group was more successful than 95% of American 33-year-olds today.

According to scholar Arthur Jensen, the correlation between IQ and income is 0.4, so we should expect people with IQs of +3.53 Standard Deviations (SD) to have NORMALIZED incomes of 0.4(3.53 SD) = +1.41 SD. They actually exceeded this expectation because if we force income to fit the bell curve, then the 95 percentile is +1.73 SD.

So this idea that IQ has diminishing returns above 120 is simply wrong in a purely statistical sense. In fact I see no evidence of diminishing returns even above IQ 150. The only proviso I would add is that the kids were tested quite young (age 13) so it’s possible their adult IQs regressed to the mean, although the book The Bell Curve argued that IQ was essentially stable within measurement error beyond age 10; but we’re told from other research that IQ becomes more genetic post-puberty and in later maturity, so it’s quite possible that the IQs of these kids regressed well below 150 as genes loom larger in adulthood. However if the IQs of these kids regressed to the mean, then that makes the correlation with their incomes even stronger, since the two variables would more closely match in normalized standard deviation units, however we’re still left wondering how much money Americans with adult IQs above 150 are making.

Share this:

  • Twitter
  • Facebook

Like this:

Like Loading...

More thoughts on IQ & household income

06 Thursday Nov 2014

Posted by pumpkinperson in income

≈ 75 Comments

Earlier, I talked about this chart showing SAT scores of kids from different household income levels:

In this post, I will estimate the IQ of the adults of various income levels from how their kids score on the SAT. Now the first step is converting the combined SAT scores of the kids of all ten income levels into IQ using this formula I created:

IQ = 39.545 + 0.068(SAT score)

This gives the following IQ’s for the ten income groups: 100, 104, 106, 109, 110, 112, 113, 114, 114, 118

One problem is mostly the brightest kids tend to take the SAT. For example, the average SAT taker has combined score (reading + math) of 1010, equivalent to an IQ of 108 (8 points higher than the national average). If we very crudely assume that at every income level, the ones who take the SAT are 8 points above the norms for their income group, we should correct these IQ’s by subtracting 8 points. Thus the IQ’s for the ten income groups become: 92, 96, 98, 101, 102, 104, 105, 106, 106, 110

Of course I’m not interested in the IQs of the kids from different income groups. I’m interested in the IQs of their parents since they’re the ones who earned the income. In order to estimate the IQ’s of the parents from the IQs of the kids, we note that the IQ correlation between both parents and their kid is 0.6 (by late adolescence/adulthood). This means that the children of exceptional parents will be only 60% as exceptional as their parents, so to estimate the IQs of the parents, we simply divide the number of IQ points the kids score above or below 100 by 0.6 to determine how far above and below average their parents are. This gives the following IQ’s for the parents in the ten income groups: 87, 93, 97, 102, 103, 107, 108, 110, 110, 117

The following chart shows the IQs of the parents of all ten income groups along with the income percentile of each income group calculated here:

bestbar

It is interesting to ask how linear the correlation between IQ and income is. In an absolute sense it’s not linear at all because IQ is normally distributed and income has an extremely skewed distribution, especially at the high end. But what happens when we convert income into the same scale as IQ (a normal distribution with a mean of 100 and an SD of 15)? This is easily done by taking various income percentiles and assigning them MQs (Money Quotients) based on their position in a normalized distribution with a mean of a 100 and and SD of 15. So the median household earning over $200,000 a year is at the 97 percentile and thus is assigned an MQ of 128. Households earning around $0-20K a year are at the 11 percentile, thus assigned an MQ of 82. Thus we can graph the the average IQ of earners from various MQs and note how linear the graph is:

moneyline

Share this:

  • Twitter
  • Facebook

Like this:

Like Loading...
← Older posts

contact pumpkinperson at easiestquestion@hotmail.ca

Recent Comments

LOADED on Even during civil war, Trump…
another mega comment… on Even during civil war, Trump…
remember when german… on Even during civil war, Trump…
The philosopher on Even during civil war, Trump…
Spirits in the Mater… on Even during civil war, Trump…
RaceRealist on Even during civil war, Trump…
The philosopher on Even during civil war, Trump…
LOADED on Hardcore cross-cultural IQ…
LOADED on Even during civil war, Trump…
name redacted by pp,… on Even during civil war, Trump…
GondwanaMan on Even during civil war, Trump…
Name redacted by pp,… on Even during civil war, Trump…
what has a theoretic… on Even during civil war, Trump…
Dexter on Nice interview with Whitney…

Archives

  • January 2021
  • December 2020
  • November 2020
  • October 2020
  • September 2020
  • August 2020
  • July 2020
  • June 2020
  • May 2020
  • April 2020
  • March 2020
  • February 2020
  • January 2020
  • December 2019
  • November 2019
  • October 2019
  • September 2019
  • August 2019
  • July 2019
  • June 2019
  • May 2019
  • April 2019
  • March 2019
  • February 2019
  • January 2019
  • December 2018
  • November 2018
  • October 2018
  • September 2018
  • August 2018
  • July 2018
  • June 2018
  • May 2018
  • April 2018
  • March 2018
  • February 2018
  • January 2018
  • December 2017
  • November 2017
  • October 2017
  • September 2017
  • August 2017
  • July 2017
  • June 2017
  • May 2017
  • April 2017
  • March 2017
  • February 2017
  • January 2017
  • December 2016
  • November 2016
  • October 2016
  • September 2016
  • August 2016
  • July 2016
  • June 2016
  • May 2016
  • April 2016
  • March 2016
  • February 2016
  • January 2016
  • December 2015
  • November 2015
  • October 2015
  • September 2015
  • August 2015
  • July 2015
  • June 2015
  • May 2015
  • April 2015
  • March 2015
  • February 2015
  • January 2015
  • December 2014
  • November 2014
  • October 2014
  • September 2014
  • June 2014
  • May 2014
  • April 2014

Categories

  • autism
  • chronometrics
  • dark dramas
  • ethnic genetic interests
  • ethnicity
  • Flynn effect
  • genetic similarity theory
  • heritability
  • horror
  • income
  • Ivy League
  • love stories
  • Low IQ
  • Michael Jackson
  • Oprah
  • politics
  • pumpkinperson
  • Uncategorized

Meta

  • Register
  • Log in
  • Entries feed
  • Comments feed
  • WordPress.com

Blog at WordPress.com.

Cancel
%d bloggers like this: