
[Update May 25, 2024: A much more up to date version of this article can be found here]
In this post, I summarize all that I have learned about the actual test scores of different income levels. In particular, I compare actual psychometric data of seven U.S. economic classes: (1) the homeless, (2) welfare recipients, (3) median Americans, (4) self-made millionaires (5) self-made decamillionaires, (6) self-made billionaires, and (7) self-made decabillionaires, and largely confirm my repeated assertion that average IQ increases by 8-10 points for every ten-fold increase in income, though there may be a few major exceptions to this overall trend. Also, by analyzing the slope of the standardized regression line predicting IQ from income, I find evidence that the true correlation between IQ and income (at least in America) is much higher than the 0.23 reported in a 2006 meta-analysis and even higher than the 0.4 correlation asserted by Arthur Jensen, and may even approach 0.5.
I also find tentative but shocking evidence that the IQ gap between the richest and poorest Americans may exceed an astonishing 70 points!
In this analysis I am limiting myself entirely to test score data so IQ estimates based on ethnic composition or educational achievements of various economic classes are only occasionally mentioned to buttress the actual psychometric results. In several cases, the data is somewhat anecdotal, and speculative statistical inferences are sometimes made.
Technical note
For each economic class, I provide two normalized Z scores; one measuring the median financial success, and one measuring the mean or median cognitive ability. The normalized Z scores are just measures of where each economic class ranks (in financial success or IQ) compared to a reference group (in this case U.S. adults in general, or U.S. adults of a specific age). For example a Z of +2.33 means you’re in the top 1%, and a Z of -2.33 means you’re in the bottom 1%. A Z of 0 means you’re right in the middle, etc.
THE HOMELESS: Mean IQ 83 (U.S. norms); IQ 80 (U.S. white norms)

Image found here
Median financial success: 0.09 percentile of U.S. adults (normalized Z = -3.13)
In 2015, roughly 423,750 American adults were homeless on a given night: One in 572 American adults (0.17%). Thus it can be estimated that the median homeless person is financially in the bottom 0.09%
Median cognitive ability: 12.8 percentile of U.S. adults (normalized Z = -1.17)
A 2004 study found that 90 homeless men living in a large shelter in Milwaukee, Wisconsin, had a mean WASI full-scale IQ of 83.92 (standard deviation = 15.24). The WASI was published in 1999, and this study was published in 2004, so we should subtract 1.5 points for old norms which are thought to expire at a rate of 0.3 points a year (the Flynn effect), so the homeless likely have a mean IQ of 82.5 (U.S. norms) or about 80 (U.S. white norms).
One problem with this study is that 81% of the sample was black (much higher than the 45% among homeless Americans in general) and these tend to score lower on IQ tests, at least in the general population, however a UK sample of homeless obtained virtually identical scores on the WASI, despite being 96% white.
In the UK study, the WASI full-scale IQ distribution of the homeless has a mean of 84.3. In this study, published in 2011, the WASI norms were by now even more outdated, so we should probably subtract 3.6 points for old norms, so this homeless sample have a mean IQ of 80.7 (U.S. norms) or about 78 (U.S. white norms).
Given the IQ of 80.7 (U.S. norms) among the the virtually all-white U.K. homeless sample, the IQ of 82.5 among the mostly blacks American sample is unlikely to be deflated by race, thus 83 is considered the best estimate of the American homeless.
WELFARE RECIPIENTS: Mean IQ 92 (U.S. norms); IQ 90 (U.S. white norms)

Image found here
Median financial success: 8.5 percentile of U.S. adults (normalized Z = -1.4)
About 17% of U.S. adults between age 18 and 64 receive public assistance. Thus the median welfare recipient can be thought of as in the bottom 8.5% financially.
Mean cognitive ability: 30 percentile of U.S. adults (normalized Z = -0.53)
It’s common knowledge in psychometric circles that reading comprehension tests are statistically equivalent to IQ tests, and a literacy study found that about 2/3 to 3/4 of adult welfare recipients (about 71%) have what’s classified as Level 1 or Level 2 literacy. By contrast, 1/2 of the general adult population are at these levels.
Since by definition, 1/2 of Americans have IQs below 100, it can be deduced that 71% of welfare recipients have IQs below 100. In a normal distribution, the 71 percentile is 8 IQ points (0.53 sigma) above the mean, so if IQ 100 is the 71 percentile among welfare recipients, the average welfare recipient should have an IQ 8 points less.
In other words, American welfare recipients average IQ 92 (U.S. norms) or about 90 (U.S. white norms).
Some might object that my analysis falsely assumes welfare recipients have the same IQ variance as the general U.S. population, but the above cited studies of the homeless suggest that poor Americans do indeed have a similar variance to Americans on the whole.
MEDIAN AMERICAN: Mean IQ 100 (U.S. norms); IQ 97-98 (U.S. white norms)

A house fit for the median American. Image found here
Median financial success: 50th percentile of U.S. adults (normalized Z = 0)
By definition, the median American is at the 50th percentile financially.
Median cognitive ability: 50th percentile of U.S. adults (normalized Z = 0)
By definition, the median American is at the 50th percentile cognitively.
SELF-MADE MILLIONAIRES: Mean IQ of 118 (U.S. norms); IQ 117 (U.S. white norms)

A house fit for a millionaire. Image found here
Median financial success: 99th percentile of Americans in their 50s (normalized Z = +2.33)
According to the 2000 book The Millionaire Mind by Thomas J. Stanley, which reported on a survey of 773 millionaires (defined here by household, not individual net-worth), the typical self-made millionaire is a 54 year-old man. In the year 1998 (when the millionaires were surveyed), it took an individual income of about $340,000 to make the top 1% for 52-58-year-olds. The surveyed millionaires had a median income of $436,000, but because this was household income, their spouses likely contributed, so in individual income they were likely not much higher than the top 1%
Mean cognitive ability: 88th percentile of U.S. adults (normalized Z = +1.2)
The average self-reported SAT score of the millionaires Stanley survey was 1190, which Stanley adjusted to about 1100 because of self-reporting bias (millionaires who were “A students” were more likely to recall their scores than “C students”). Since 90% of the sample were college graduates it’s likely virtually all took the SAT.
Since the typical self-made millionaire in the sample was 54 as of 1998, it’s likely he took the SAT circa 1961 (when he was 17). According to the book The Bell Curve (page 422), if all American young adults (not just the college bound elite) had taken the SAT in 1960, the average score (IQ 100; U.S. norms) would have been 784. Meanwhile prior to 1974, an SAT score of 1300 was considered Mensa level (IQ 130). Extrapolating from these two data points, the average self-made millionaire has an IQ of 118 (U.S. norms); 117 (U.S. white norms).
SELF-MADE DECAMILLIONAIRES: Mean IQ of 118 (U.S. norms); IQ 117 (U.S. white norms)

Image found here
Median financial status: 99.9th percentile of Americans in their 50s (normalized Z = +3.1)
20% of Stanley’s millionaire sample earned at least $1 million a year in household income, and many of these probably earned much more than that, and presumably the bulk of this was individual income made by by the head of households Stanley surveyed, not their spouses. Anyone in their 50s who has been earning a million a year for a long period of time, likely has, or will have, a net worth over $10 million (decamillionaire status). In the year 1998 (when the millionaires were surveyed), it took an individual income of about $1.25 million to make the top 0.1% for 52-58-year-olds.
Mean cognitive ability: 88th percentile of U.S. adults (normalized Z = +1.2)
Above I noted that millionaires had a mean SAT score equating to IQ 118 (U.S. norms); 117 (U.S. white norms). Because Stanley found virtually no correlation between income or net-worth among the millionaires themselves it might be assumed that the decamillionaires in his sample also averaged IQ 118. Of course if the data was not normalized, the zero correlation might be misleading.
SELF-MADE BILLIONAIRES: Mean IQ 133 (U.S. norms); IQ 132 (U.S. white norms)

Image found here
Median financial success: 99.99993 percentile for baby boomers (normalized Z = +4.8)
About 80 million Americans were born between 1946 and 1964 (the baby boomers). People in this age groups are about 42% of the richest Americans. There are 277 self-made billionaires in America (see appendix A of this document). If we assume 42% of these are boomers, then 116 of America’s 80 million boomers are self-made billionaires, which means the median self-made billionaire boomer is the 58th most prosperous out of 80 million, equating to the 99.99993 percentile.
Mean cognitive ability: 98.6 percentile of U.S. adults (normalized Z = +2.2)
Several boomer billionaires have SAT scores that are apparently publicly known. Bill Gates claims to have scored 1590 and Paul Allen reportedly scored 1600. On the pre-1995 SAT, these scores equate to IQs of about 170. I can no longer find any internet sources reporting Steve Ballmer’s composite SAT scores, but he reportedly scored a perfect 800 on the math section of the SAT which seems to equate to an IQ of 150, but given that he hit the ceiling on the test, and is rumored to be in the same IQ league as Gates himself, this is likely an underestimate. Perhaps the best publicly known measure of his IQ is his performance on William Lowell Putnam Mathematical Competition where he performed even better than Gates. If this source is reliable, Ballmer got one of the 100 best scores on the exam in 1974, but probably not one of the top 45, so let’s split the difference and assume he came in 73rd.
Ballmer was one of the 4,308,000 Americans born in 1956, and assuming almost all of the top math talent from his cohort went on to compete in the 1974 Putman (and whatever shortfall was made up by top foreign talent and by older and younger talent), then Ballmer’s score equates to the top 73 out of 4,308,000 (one in 59,000 level) which equates to an IQ of 162.
Thus at least three of the roughly 116 self-made boomer billionaires in America (2.6%) have tested IQ equivalents of at least 162+. It’s possible some of these scores have been exaggerated, but it’s also possible there are other super brilliant self-made billionaires with unknown high test scores. Both possibilities negate one another, making 2.6% perhaps a reasonable estimate.
In the general U.S. population, the top 2.6% have IQs of 129+, but in the self-made boomer billionaire population, the top 2.6% have IQs of 162+. This suggests their entire bell curve is shifted 33 IQ points to the right, so just as the average American has an IQ of 100, the average self-made boomer billionaire should have an IQ of 133, though given that the average is extrapolated from just three outliers (Gates, Allen and Ballmer) who all got rich from one company (Microsoft), it should be interpreted with great caution. Nonetheless, it is roughly consistent with research showing that 43% of self-made billionaires attended colleges indicative of top 1% ability (IQ 135+) (see table 1 of this document) and is also roughly consistent with the ethnic composition of the Forbes 400 richest American list, though there are some anomalies.
Some might object that my estimate for the average IQ of self-made boomer billionaires assumes the super rich have the same IQ variance as the general U.S. population, however a study of the homeless (cited way above) found that even folks at the economic extreme have a standard deviation of 15, like Americans as a whole.
SELF-MADE DECABILLIONAIRES: Mean IQ 151 (U.S. norms); IQ 151 (U.S. white norms)

A home fit for a decabillionaire. Image found here
Median financial status: 99.99999th percentile of baby boomers (normalized Z = +5.23)
Of the 80 million Americans baby boomers, only 13 were self-made decabillionaires in the Oct 19, 2015 issue of Forbes magazine, so the median self-made decabillionaire boomer is the 6.5th most prosperous person in that age group (one in 12.3 million)
Mean cognitive ability: 99.97 percentile of U.S. adults (normalized Z = +3.4)
Of the 13 self-made decabillionaire boomers, at least three (23%) reportedly have test scores equating to IQs of 162+ (Gates, Allen and Ballmer as mentioned above).
If we assume that the IQs of self-made decabillionaire boomers are roughly normally distributed with the same variance as in the general U.S. population (see above), then the fact that 23% have 162+ IQs implies an average IQ of 151, though given the small number of data points, this could just be a fluke.
But it’s worth noting that self-made decabillionaires have perhaps roughly double the rate of elite college attendance as U.S. self-made billionaires in general. Futher, when I analyzed the ethnic and racial background of self-made decabillionaires in 2009 (all generations) it implied a mean IQ of about 150.
Despite this corroboration, an IQ of 151 is so incredibly high that it should still be considered tentative. And even assuming its veracity, it may only apply to decabillionaires of the baby boomer cohort and younger. Older decabillionaires came of age before the rise of high tech and big data, and thus may not have needed anywhere near as much IQ to get rich.
One might not think an IQ of 151 is that extreme for elites given that SAT IQ equivalents this high are not uncommon at the most elite colleges in America, however it’s worth repeating yet again that the IQs of elite college students will regress precipitously when they move from the SAT (the test that selected them) to a neutral IQ test. By contrast, decabillionaires were mostly selected by the market, and only partly by their SAT scores creating opportunities, so unlike Ivy League students, their SAT IQ equivalents are perhaps not inflated by selection bias.
Summary
Below is a summary of the data in bar graph form:

Below is a summary of the above data in table form.
| economic class | median earned income | median wealth | financial success (normalized u.s. z for age grouping) | iq (u.s. z) | iq (u.s. norms) | iq (u.s. white norms) |
| self-made decabillionaires | 10 figures | 11 figures | +5.23 | +3.4 | 151 | 151 |
| self-made billionaires | 9 figures | 10 figures | +4.8 | +2.2 | 133 | 132 |
| self-made decamillionaires | 7 figures | 8 figures | +3.1 | +1.2 | 118 | 117 |
| self-made millionaires | 6 figures | 7 figures | +2.33 | +1.2 | 118 | 117 |
| median income | 5 figures | 5 figures | 0 | 0 | 100 | 97-98 |
| welfare | 4 figures | 4 figures | -1.4 | -0.53 | 92 | 90 |
| homeless | 3 figures | 1 figure | -3.13 | -1.17 | 83 | 80 |
For every ten-fold increase in income, mean IQ increases 8-10 points
The simplest way to think of the IQ income relationship is that for every ten-fold increase in income, average IQ increases 8-10 points (U.S. white norms). Of course there are some major anomalies. Self-made decabillionaires are 10 times more prosperous than self-made billionaires, yet appear to score 19 IQ points higher, though these numbers are tentative given limited data. Meanwhile self-made decamillionaires are ten times more prosperous than self-made millionaires, yet appear, based on Thomas Stanley’s research, to be equally intelligent. One possible reason for this is that the the correlation between IQ and money is partly mediated by years of education, but once you have enough education to be a millionaire (i.e. law school or medical school), even more schooling doesn’t help much. and may even have opportunity costs.
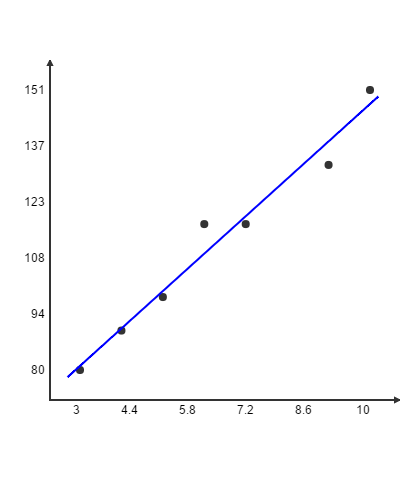
These anomalies notwithstanding, when I graphed average IQ (Y axis) as a function of income (number of figures earned per year)(X axis), there was a nice linear relationship overall: IQ (U.S. white norms) = 9.487319(number of figures) + 52.57971
Standardized regression slope & correlation coefficient
I also graphed average IQ as a function of money again, but this time expressed as normalized Z scores, with average IQ of the seven economic classes on the Y axis, and median financial success on the X axis:

IQ Z score = 0.489421(financial normalized Z score) + 0.135804
As the above graph shows, there’s a virtually perfect (r = +0.97) correlation between economic class and mean/median measured intelligence, when both variables are expressed as normalized Z scores.
Note, this near-perfect correlation between median financial success and mean IQ should not be confused with the correlation between individual IQ and individual financial success. The former is known as as an “ecological” correlation commonly used in epidemiological research, and tends to be higher because individual level variation cancels outs. However because the Z scores are based on the normalized distributions of individuals, the slope of the regression line (+0.49) will equal the individual level correlation.
The actual scatter plot of a random group of individuals (with IQ Z on the Y axis and income Z on the X axis) would probably look as follows:
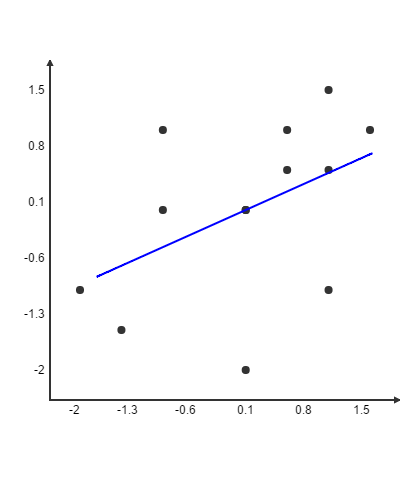
Notice first that the range of Z scores on both the X and Y and axis is much less. That’s because most people in a random sample of Americans are ordinary in both income and IQ. Note also the enormous variation around the line of best fit.
Now if you extended the range of X and Y much much further, and if you plotted the mean Y for every X, instead of every Y for every X, you should get a scatter plot that looks very much like the ecological scatter plot.
But note that in both the the ecological scatter plot, and the individual scatter plot, the slope should be the same because the line of best fit can be thought of as a line connecting the average Y of a given X, so graphing average Ys instead of individual Ys, does not change the line of best fit, it simply eliminates almost all the scatter around it.
Discussion
A correlation of 0.49 is more than double the 0.23 correlation between IQ and income reported in a 2006 meta-analysis by Tarmo Strenze and nearly triple the 0.16 correlation between IQ and net-worth found in a 2007 study by Jay L Zagorsky, however it is similar to the 0.4 correlation between IQ and income asserted by authoritative Arthur Jensen in his 1998 book The g Factor.
Why did my indirect method (regression slope analysis) result in double the correlation found by Strenze’s meta-analysis of direct studies of IQ and income?
Many studies are based on individual income instead of household income. Because many women (and some men) choose not to work outside the home, their individual incomes are technically zero, but they should not be considered the equivalent to a homeless person with zero income, because they are in fact working in the home and thus earning at least some of their household income. Because there’s no agreement on how to quantify such indirect forms of income, it’s not counted which greatly limits the IQ-income correlation. Using household income instead of individual income seems to result in a higher correlation between IQ and income (+0.37) but even this is an imperfect solution, because all adults within a household don’t contribute equally to the household income.
In addition, many studies use only a single year’s income which is obviously quite unreliable, since massive income fluctuations can occur from year to year.
In my analysis, both of these problems were sidestepped because data points were collected primarily from head of households (self-made millionaires, self-made billionaires) or non-households (the homeless) so you didn’t have to worry about how to deal with indirect income (i.e. the spouse of a millionaire who technically earns nothing, but earns her million dollar life by being a good wife).
Also, my analysis focused on fairly stable economic classes (homeless, welfare, millionaires, billionaires) that reflect lifelong patterns of financial success, and not just a single year’s income.
All this may explain why I found a much higher IQ-income correlation than is usually reported.
A reader informed me of an excellent analysis by Dalliard of Human Varities who found that in a large representative sample of Americans in their 30s and 40s, a single year’s income correlated 0.31 with IQ, but averaging income over many years increased the correlation to 0.36. When Dalliard looked at the correlation in only men (thus, also sidestepping the complication that many women earn their lifestyle as wives instead of through direct income), the correlation leaped to 0.48 (virtually identical to the 0.49 correlation I also found by sidestepping these two problems).

Sorry to bug you about this but the selection bias argument has not quite yet made sense to me. By the same argument that the sat takers as a whole represent the smartest group of 17 year olds, why wouldn’t the tier 1 students be the top 2% of the smartest 17 year olds (imperfect correlation, holistic application factors etc. aside). I get that tier 1 students wouldn’t have random sat scores, but it is assumed high iq gives these students high scores to begin with.
You’re not bugging me. My selection bias argument is confusing because it’s something I believe, but not really something that is acknowledged in the field.
I’m not sure I understand your question so I’ll talk in general. When you look at the top SAT people (Ivy Leaguers) by definition, they are going to include a lot more people who overperformed on the SAT than underperformed. Thus they will regress to the mean on another test because many of the overperformers will revert down to their true level
By contrast when you look at billionaires, they are going to include a lot of people who overperformed at making money, so they will regress to the mean on the SAT, but unlike Ivy League students, billionaires should not regress from the SAT to another test, because billionaires were selected by the economy, not by SAT scores, thus they were selected for overperforming in money, not on the SAT
Thus an elite school that has the same average SAT score as the typical self-made billionaire, will tend to be dumber than the typical self-made billionaire when measured on a different test
Was there a purpose to the article other than to state the obvious: dumb people earn less money?
I mean, did you have any sort of point?
Will your next post be used to convince us that mentally retarded people don’t earn a lot of money?
The point is a lot of people deny the correlation between IQ and money is anything close to linear or feel it only applies at the lower end. I wanted to test these claims with empirical data.
Yet, ultimately, what your study shows is how luck is correlated to wealth. Winning the lottery is luck. Winning the genetic lottery — IQ, personality type, looks — is also luck. As was your parents socio-economic status and where you were born. Luck. These aren’t things we’ve achieved or earned. They were give to us with no effort or will on our part. Yet, the reality is that wealth is not simply a matter of luck. Generally, a lot of determination, desire, long hours, risk, and will power is involved. That’s why professors may be very intelligent, but not particularly rich…
I agree. That’s why there’s only a moderate correlation between IQ and money, not a strong one. It’s like height and weight: IQ is only one cause of money like height is only one cause of weight. Some brilliant people will be poor just like some super tall people will be featherweights.
Hey Pumpkin, thanks for your blogs.
Here is Warren Buffett’s IQ from his sister:
“When I was twenty-eight and married, I remember thinking ‘Isn’t this strange? My brother’s a genius, my sister’s a Phi Beta Kappa, we all have the same parents, and I’m such a dummy.’ I bought it. I really believed that.” Much later, she discovered that the woman who had administered an IQ test to Bertie, Warren and Doris when they were eight, ten and twelve, respectively, was still alive. Doris checked the results: her IQ test result was 150, a couple of points lower than Warren’s and a couple higher than Bertie’s.”
Somehow, I am not surprised about this.
Very interesting discovery!
I found a citation:
http://abcnews.go.com/GMA/Books/giving-dorris-buffett-story-michael-zitz/story?id=10827641
Of course given his age, Warren likely took a ratio IQ test not the modern deviation IQ scales we know today, so his deviation IQ would likely be lower, but still incredibly high nonetheless
”Iq ….
https://www.youtube.com/watch?v=vx2u5uUu3DE ”
peepee doesn’t get it.
if the fairly high IQs of the rich and the fairly low IQs of the poor were a validation of the prevailing system…then why not just appoint people by their IQs? then the correlation would be PERFECT. it would be a lot like…the whole fucking rest of the world outside of shitmerica and canuckistan. and wouldn’t that result in an even more PERFECT society?
there is no facile answer to this obvious contradiction in hereditist politics.
but people who try to justify the prevailing system…whatever it is…are subhuman and should be shot.
marx couldn’t predict that a class of very comfortable people would in-cognizantly delude themselves with bullshit like gay rights and affirmative action in place of class consciousness.
bruce jenner is a class enemy…along with all the smelly cunts who promote transgender rights.
the highest paid mutilated male ceo was higher paid than any female ceo.
i’d volunteer for the firing squad for this evil piece of shit.
https://en.wikipedia.org/wiki/Martine_Rothblatt
let’s do it!
//
peepee doesn’t get it.
if the fairly high IQs of the rich and the fairly low IQs of the poor were a validation of the prevailing system…then why not just appoint people by their IQs? then the correlation would be PERFECT. it would be a lot like…the whole fucking rest of the world outside of shitmerica and canuckistan. and wouldn’t that result in an even more PERFECT society?
Because I’m not interested in validating the system, I’m interested in testing the validity of the tests by seeing if they can predict real world success & not just how well you do in school as so many skeptics claim
I’m interested in the science of psychometrics, not public policy
And I wouldn’t be so sure the IQ-income correlation is higher outside North America. The socialism of Europe & the corruption of the Third World would both tend to limit it.
And Charles Murray has argued that the correlation between IQ & success has increased since the 1950s & that this has had many negative consequences
murray says this for the same reason he speaks in an affected accent, because neither of his parents even attended college and he’s a snob/social climber/striver.
one advantage of filling positions of various rank via objective means is that the means can be improved.
if the means are opaque and mysterious they can’t be improved.
was it deming who said “if you can’t measure it you can’t change it”?
but those in such positions can still claim that they have been selected, because they are more objectively virtuous than their underlings…
and this makes inequality a “big mystery”…that is, it is talked about publicly in one way and privately (like on this blog) in an another way.
when the reasons for inequality are totally transparent the public/private dichotomy vanishes and the result is…
less inequality…
those with the right genes or the right parents to make high test scores feel noblesse oblige…
and if the right genes are proved to be more important, then anything less than thoroughgoing eugenics would be evil. and thus any with the misfortune of having bad genes will not be condemned to a life of misery, but taken care of by the state.
sweden had the longest lasting and most thorough eugenics policy of any country until it was ended.
both hereditist and anti-hereditist conservatives are absurd…
the moral implications of both of their positions is socialism.
the only difference is whether it’s socialism with eugenics or without it.
social darwinism is both:
1. extremely inefficient
and
2. cruel.
that is, it produces mountains of un-necessary suffering.
and btw churchill,
i’m not against eugenics being applied to crazy or “anti-social” people…i just think that the evidence for the heritability of various psychiatric conditions and personality traits independent of environment is even more feeble than it is for the environment independent heritability of IQ.
i wouldn’t be surprised if SCZ were caused entirely by gluten…and i really doubt whether depression or anxiety are illnesses at all. and i know that introversion is both something totally non-pathological, but in american society it’s a huge disability.
The environment dependent component behind IQ is much weaker than for heritability.
Latest research on GWAS and GCTA shows exactly that, and the heritability will be borne out soon. Indeed, for schizophrenia even easier than for IQ.
Check out Visscher’s essay here: http://www.genetics.org/content/202/2/377
and also perhaps this paper: https://www.dropbox.com/s/62rgzqbx2dojf1k/Gage%20et%20al%202016.pdf?dl=0
Plomin’s paper here also: http://www.gwern.net/docs/genetics/2016-plomin.pdf
As for IQ, it is the perfect test of intelligence, it’s correlation with career success and income (http://apsychoserver.psych.arizona.edu/JJBAReprints/PSYC621/Kuncel_Hezlett_Current%20Directions%20in%20Psychological%20Science-2010%20(Cog%20Ability%20Testing%20Hiring%20and%20Admissions).pdf and http://www.sciencedirect.com/science/article/pii/S0160289606001127) are pretty well replicated findings.
The reason for inequality is obvious.
Not to mention, there’s also the fact that early childhood measures of environment ostensibly related to IQ are also genetically confounded: http://journals.plos.org/plosone/article?id=10.1371/journal.pone.0039901
The environment dependent component behind IQ is much weaker than for heritability…The reason for inequality is obvious.
once again you prove that you don’t understand what “environment independent heritability” means.
and that you don’t understand that the very studies you link to show that IQ only explains a small fraction of income inequality and even less wealth inequailty.
and that the heritability of IQ explains even less than IQ.
namely, IQ explains at most 1/6th of intergenerational status transmission…even if the heritability is 100%.
there’s all the rest of the variance, at least 5/6ths, explained by factors other than IQ fucktard.
this is the problem:
1. behavior genetics is a pseudo science conducted by idiots.
2. HBDers don’t even understand the modest claims of these idiots. they’re idiots on top of idiots.
they’re like pygmies or bushmen compared to bantu negroes.
except it might’ve been 1/15th of intergenerational status transmission.
i forget.
it was a whole monograph done by guys at HKSG.
how can that be…even if IQ is 100% heritable?
because even if IQ is 100% heritable two smart parents can still have dumb children…
let’s do it!
None of my links minimize the role of heritability of IQ, fucktard. This is the mainstream view amongst BG researchers.
There’s also the fact of how inextricably linked brain size is with IQ. IQ is far more genetic than your minimism would indicate.
i quote myself:
once again you prove that you don’t understand what “environment independent heritability” means.
you’re a parody of yourself carl.
why don’t you listen to von karajan’s and the berlin philharmonic’s 1974 studio recording of the overture to tannhauser…
close enough:
then a speech by goebbels:
then STFU!
i am a NAZI.
i will always be a NAZI.
you’ll just be an british shopkeeper…a CUNT.
i take that back…that rendering is SHIT!
can i find THE SHIT?
it’s night and day…
it’s the way the world sees national socialism today versus
the real national socialism.
no where can i find it on the net.
if i were stupid i’d think there was a conspiracy.
here’s the picture on the CD…but i first heard it on vinyl.

even the picture of the cd doesn’t show up…
here’s the cover of the vinyl album:
There isn’t environment independent heritability, but there is additive heritability which Plomin and Visscher found out instantiate most heritability of IQ
For a person who is named as morally superior, you just seem to be another dumb white who likes to play wise.
Rights to the transcendental existence, to ” gay ” or ” trans ” tends to affect a small portion of the population and in a positive way. Until recently, these people were admitted to psychiatric institutions or were castrated.
What would prevent the rights of the working classes and the right of homosexuals to coexist within the same social dynamic **
Use your ‘super genius” to produce complete analytical thinking, and not just the poor details.
These ”geniuses” of alternative right, just show us what the most right-wing has tried to hide about themselves. Not the white liberal who is the most hypocritical when it talks about anti-racism and anti-homophobia, but just the conservative, trying to suppress his primitive nature, cavemen that ever was. If he did wisely, but ask them to true subhuman of all political perspectives, just use its reasoning skills in a correct way.
Moreover, if you want to pay his respects to the deplorable state of things that has always characterized the human world, to do with a conservative, he is largely responsible. The slave who believes in eternal nonsense fantasies even in the XXI century. domesticated oving their slavery since the begining of human-kind, not unlike the modern liberal.
Above all bio-identity label, in fact, we are all living beings.This should be the most important. But the existential priorities are always inverted.
The only major aberration of the human species is the psychopath because we have evolved to be a social species and the presence of predators like these is an enormous contradiction and explains why the man is still very weak and stupid for a number of essential behaviors for harmony social and have make very stupid things.
I find it odd how mean people are over invasion of privacy.
@Chartreuse Because nobody is claiming that the corelation validates the system, they claim it validates the test as an imperfect but useful proxy of useful intelligence. For your idiotic suggestion to work IQ would have to be a better predictor of whether someone can do a job than whether someone hires them to do a job. Nobody is even vaguely claiming this. Nor is anyone claiming that the corelation between IQ and job success is 1.00 anywhere. Nor is anyone supporting hereditist politics whatever they are.
The fact that you openly declare that people who disagree with you on the merits of the current system should be shot tells us all we need to know about you
I know you probably find the source of salvation objectionable, but it’s going to come from some part of East Asia. They _will_ use aggressive eugenics and socialism to clobber the Anglosphere. A team of geniuses in a high trust configuration will beat an extremely hierarchical, sociopathic, low trust society, like the Anglosphere has become, any day. The Anglosphere’s hand will be forced–do likewise or go extinct.
Before WWII, it was obvious to the majority of Western intellectuals that socialism and eugenics (plus extreme eduction and technical interventions) was the winning strategy. It still is.
I know you probably find the source of salvation objectionable, but it’s going to come from some part of East Asia.
No I don’t find East Asians, or any other race, objectionable.
The average of the asians may be higher vs caucasians, but the caucasians have more +120IQ individuals by a large margin.
Basically, your average white is likely a touch dumber than your average asian but you are more likely to bump into a much smarter white than a much smarter asian.
Your assertion about white standard deviation being higher than Asian is based on what evidence?
If you correlate IQs of “groups”, the correlation will converge to perfect. Correlation should be created based on individual scores. The bigger the group the more perfect will be the correlation. Because the group average will automatically neglect the cloud of outsider scores…
alcoholicwidsom, this is a very important point, and in fact the group level correlation does approach perfection (+0.97). I know it’s a very long post, but if you read the section called “standardized regression slope & correlation coefficient”, I talk about my technique (and maybe others have thought of it too long before me) of inferring the individual level correlation (+0.49) from the group level data.
Switch the X and the Y axes and find the best fit line again. Now the slope is +1.92 whereas before it was +0.49. You see the slope does not correspond to anything. There is no way to infer individual correlation from group level data.
Read this article more closely: https://en.wikipedia.org/wiki/Standardized_coefficient
You will see that one of the requirements is that the standard deviation of the independent variable and the standard deviation of the dependent variable are both equal to 1.
But the standard deviation of your independent variable is 3.165 and the standard deviation of your dependent variable is 1.598.
If you normalize both variables and find the best fit line again, you will find that the slope of that line is (0.49)*(3.165)/(1.598) = 0.97, which again, is the correlation that you found on the group-level data.
Switch the X and the Y axes and find the best fit line again. Now the slope is +1.92 whereas before it was +0.49.
Huh? The chart is showing median financial success at different intelligence levels. The average self-made billionaire has an IQ around 130. You can’t just flip X and Y because that assumes the average IQ 130 person is a self-made billionaire which is completely false. The average IQ 130 person would not even be a millionaire so actually if we were plotting money as a function of IQ, once again we should get a 0.49 slope because just as rich people have half as much IQ as money, smart people have half as much money as IQ (when both are expressed in normalized Z scores).
You see the slope does not correspond to anything. There is no way to infer individual correlation from group level data.
False. The only difference between a scatter plot based on individuals and one based on groups is the amount of variation around the line of best fit. At the group level individual variation around the line of best fit vanishes but the slop remains the same.
Read this article more closely: https://en.wikipedia.org/wiki/Standardized_coefficient
You will see that one of the requirements is that the standard deviation of the independent variable and the standard deviation of the dependent variable are both equal to 1.
Correct
But the standard deviation of your independent variable is 3.165 and the standard deviation of your dependent variable is 1.598.
You must be calculating the standard deviations of the group means. The individual data points would have an SD of 1 but they’re not shown on the graph. If they were the graph would look the same but there’d be vastly far more variable dots around the line of best fit, especially in the middle.
If you normalize both variables and find the best fit line again, you will find that the slope of that line is (0.49)*(3.165)/(1.598) = 0.97, which again, is the correlation that you found on the group-level data.
Group level data always has a much a higher correlation than individual level data because the exceptions cancel out, but the point of the exercise was not to calculate the group level correlation, it was to INFER the individual level correlation from the slope of the line of best fit which is the same at both the group and individual level ASSUMING the data is normalized using the individual level mean and SD.
Maybe I can show you what has gone wrong here with a hypothetical. Suppose I divided the population into the top 50% of income earners (average quantile of 0.75 corresponds to z=+0.675) and the bottom 50% of income earners (average quantile of 0.25 corresponds to z=-0.675).
Suppose I measure the average IQ of the top group and find that it is z=+1.0 and I measure the average IQ of the bottom group and find that it is z=-1.0.
Then I plot these standardized scores for IQ against the standardized scores for income quantile and find that the slope of the best fit line is (2.0)/(1.35) = +1.48.
Is it possible for this distribution to exist? Yes.
Is it possible for a correlation coefficient to be 1.48 which is greater than 1? No.
Something has gone wrong in your assumptions.
You must be calculating the standard deviations of the group means.
That is correct. In your plot you have 7 observations, and each of your observations is “some group of people”. Your independent variable is “average income quantile of group (standardized)”. Your dependent variable is “average IQ of group (standardized)”. Any standardized coefficients you calculate have to be based on the standard deviation of the indepdendent variable and dependent variable you have chosen. You can’t use the standard deviation of some other variable you used to compute your independent variable. That doesn’t make sense.
The correlation coefficient +0.97 you calculated is the correlation coefficient between the group means. The slope of +0.49 is the slope of the best fit line of between the group means. The correlation coefficient is a standardized coefficient. The slope is only a parametric coefficient. The information you think is in the number +0.49 is just not there. The slope of the best fit line does not correspond to a correlation unless your independent and dependent variables are both standardized. You can standardize your independent variable by dividing all the values by the standard deviation 3.165. You can standardize your dependent variable by dividing all the values by the standard deviation 1.598. When you do that, and you calculate the slope of the best fit line again, then and only then does the slope become a standardized coefficient as well as a parametric coefficient, and it is equal to +0.97.
Maybe I can show you what has gone wrong here with a hypothetical. Suppose I divided the population into the top 50% of income earners (average quantile of 0.75 corresponds to z=+0.675) and the bottom 50% of income earners (average quantile of 0.25 corresponds to z=-0.675).
Suppose I measure the average IQ of the top group and find that it is z=+1.0 and I measure the average IQ of the bottom group and find that it is z=-1.0.
Then I plot these standardized scores for IQ against the standardized scores for income quantile and find that the slope of the best fit line is (2.0)/(1.35) = +1.48.
Is it possible for this distribution to exist? Yes.
No, it’s not possible for that distribution to exist. Since only about 16% of the population by definition have IQs more than normalized Z = +1.0, it’s impossible for the top 50% of income earners to average this high. Even if every single person with an IQ Z > +1.0 was in the top 50% of income, over 2/3rds of the top 50% income earners would have IQ Zs < +1.0 and these would drag down the average to a maximum of Z = 0.675, so the slope can never exceed +1.0.
Is it possible for a correlation coefficient to be 1.48 which is greater than 1? No.
Something has gone wrong in your assumptions.
No something went wrong with your assumption (see above)
That is correct. In your plot you have 7 observations, and each of your observations is “some group of people”. Your independent variable is “average income quantile of group (standardized)”. Your dependent variable is “average IQ of group (standardized)”. Any standardized coefficients you calculate have to be based on the standard deviation of the indepdendent variable and dependent variable you have chosen. You can’t use the standard deviation of some other variable you used to compute your independent variable. That doesn’t make sense.
Assuming a bivariate normal distribution. the line of best fit of individuals will be the same as the line of best fit of group means. Why? Because the reason it’s the best fit is that it’s where most of the individuals cluster and most individuals cluster near the mean. Thus if you know group means, you can infer the line of best fit graphed from individuals and once you’d done so, it makes sense to use individual level standard deviations.
The correlation coefficient +0.97 you calculated is the correlation coefficient between the group means. The slope of +0.49 is the slope of the best fit line of between the group means. The correlation coefficient is a standardized coefficient. The slope is only a parametric coefficient. The information you think is in the number +0.49 is just not there. The slope of the best fit line does not correspond to a correlation unless your independent and dependent variables are both standardized. You can standardize your independent variable by dividing all the values by the standard deviation 3.165. You can standardize your dependent variable by dividing all the values by the standard deviation 1.598. When you do that, and you calculate the slope of the best fit line again, then and only then does the slope become a standardized coefficient as well as a parametric coefficient, and it is equal to +0.97.
I’m not interested in the group level correlation. I’m using the slope of the group level data expressed in individual level Z scores to infer the slope of the individual level data because they’re the same slope. That slope allows me to infer the individual level correlation.
Okay now I’m on the same page as you. Excuse my confusion. You haven’t said +0.49 is a standardized coefficient on the group medians. You’re saying that you are able to use your data to infer the best fit line of the whole distribution.
To my surprise this may be valid. However my next objection is that Ordinary Least Squares (OLS) is not an appropriate method to infer the best fit line of the whole distribution. To avoid oversampling the decabillionaries by a factor of 10^7 and so on, you need to use Weighted Least Squares (WLS). The weights you should use are the proportion of the population that each group represents.
Here is a code snippet in python that does just that.
You can edit this particular snippet or run it virtually at ideone.com/fork/0zYkQk
from sklearn.linear_model import LinearRegression

model = LinearRegression()
X = [-3.13, -1.4, 0, 2.33, 3.1, 4.8, 5.23]
Y = [-1.1783, -0.5392, 0, 1.2, 1.2, 2.2, 3.4]
X = [[x] for x in X] # LinearRegression() wants dependent variable(s) in this shape
print(model.fit(X, Y).coef_[0])
W = [.0017, .17, 1, 1e-2, 1e-3, 7e-7, 1e-7]
print(model.fit(X, Y, W).coef_[0])
When you run this code it first outputs the unweighted best fit line slope of +0.49, and then it outputs the weighted best fit line slope of +0.405.
No, it’s not possible for that distribution to exist. Since only about 16% of the population by definition have IQs more than normalized Z = +1.0, it’s impossible for the top 50% of income earners to average this high.
I now agree with you on this point. It’s not possible for such a distribution to exist. However in this case you are measuring income from a single distribution and you are measuring IQ from 7 independently standardized distributions, and you are assuming that the measurements don’t deviate significantly from the standardized distribution of the whole population (which is fair to assume).
The income scores are based on quantile so they are maximally ordered. And it would be highly unlikely for the IQ scores to be, let’s call it “supermaximally ordered”, even when the measurements are independently standardized.
When you run this code it first outputs the unweighted best fit line slope of +0.49, and then it outputs the weighted best fit line slope of +0.405.
Interesting but are you sure this is correct? Calculations are only as good as the numbers you enter & you would have to calculate what percentage of the population each income level is which doesn’t sound like something you had time to do.
you would have to calculate what percentage of the population each income level is
I used the numbers you have on this page: 0.17% of the population homeless, 17% of the population welfare recipients, 1% millionaires, 0.1% decamillionaires, 0.00007% billionaires, 0.00001% decabillionaires.
That’s 6 of the 7 groups.
Then there is the question of whether you should have 1 data point to represent the whole population, with a weight of 100% and income z-score of 0 and IQ z-score of 0. You can do it that way, as I have done in my previous post. Or you can take the remaining population after accounting for the other 6 groups and assign it the IQ- and income- z-scores needed to make both the mean of your dependent and independent variable both equal to 0. In that case you would give the last data point a weight of 0.8173 (81.73%), an income z-score of 0.2169, and an IQ z-score of 0.0805.
If you do it the second way and run the WLS then you get a best-fit slope of +0.399.
Again here is a code snippet that does it the second way:
https://www.ideone.com/fork/bhH5KY
from sklearn.linear_model import LinearRegression

model = LinearRegression()
X = [-3.13, -1.4, 0.216917117, 2.33, 3.1, 4.8, 5.23]
Y = [-1.1783, -0.5392, 0.08046523, 1.2, 1.2, 2.2, 3.4]
X = [[x] for x in X] # LinearRegression() wants independent variable(s) in this shape
print(model.fit(X, Y).coef_[0])
W = [.0017, .17, 0.8172992, 1e-2, 1e-3, 7e-7, 1e-7]
print(model.fit(X, Y, W).coef_[0])
Either way you do it the value of the slope is dominated by the slope between the two highly-weighted (and most representative!) data points (“welfare recipients” and “rest of population”) and the other data points act as a minor correction to that slope.
Really if you had all the individual-level data the slope of the complete best-fit line would be almost completely determined by the slope of the line that best fits the “rest of population” individual data because that group makes up 81.73% of the distribution.
Is there much reason to believe that the slope internal to the “rest of population” data is more like the slope between (“rest of population” and “rich population”) than it is like the slope between (“rest of population” and “welfare recipients”)?
I know I do not contribute much to helping find new discoveries about IQ and It may also be political incorrect to talk about IQ but I find it interesting. The older I get the easier it is to understand.
https://en.wikipedia.org/wiki/Event-related_potential
I am on welfare, so is my mom and so is my brother.
I get $700 a month which is $8,400 a year.
4 figures = 90. My IQ is 113.
117 – 97.5 = 19.5
113 – 97.5 = 15.5
15.5 / 19.5 = 0.794
log(7.94) = 8.99
The median earned income of an IQ 113 is:
IQ 113 = $89,900
median wealth:
5 figures = IQ 100
113 – 90 = 23
23(0.49) = 11.27
90 + 11.27 = 101.27
My house is worth $74,000
My moms house is worth over $100,000
My grandmother left $120,000 for all five kids and $10,000 for me and the rest.
She died at age 88 in 2005. I think she was 118.
My mom was the last kid, five of 5 (Star Trek Borg reference). I am one of 3.
My mom liked working in my grandmothers motels and farm.
https://en.wikipedia.org/wiki/Where_the_Red_Fern_Grows
My mom loved these shows.
Pumpkin Person“It’s common knowledge in psychometric circles that reading comprehension tests are statistically equivalent to IQ tests”
The ACT test scores put my IQ at 97.545
This is the five figure level right above welfare(four figures).
I think that my wais scores evened out how well I did on the ACT test. The main problem for me was holding the story in my head then answering the questions. I understood the key parts but it was a timed test so this made me anxious to get the answer. speed 86 and vocab 132, This is a rel problem for me. It takes me time to understand. New Mexico is a poor state(IQ 95.7). My grandmother came from Montana(IQ 103.4).
chartreuse
both hereditist and anti-hereditist conservatives are absurd…
the moral implications of both of their positions is socialism.
the only difference is whether it’s socialism with eugenics or without it.
social darwinism is both:
1. extremely inefficient
and
2. cruel.
that is, it produces mountains of un-necessary suffering.
I think you are right about this.
Socialism is a good idea.
You can only buy insurgence from the company in your state in America, not across state lines. The Federal government along with state governments fractures standardization of services. Foreign policy is all about destabilization, the EU now has two million new problems.
But I do not know what the problem is for the finances. The real numbers are 20 percent youth unemployment in America and 30 percent in the EU. Employment not based on consumerism I have no idea how that works accept, that education for engineering is not the education for manufacturing. Engineering is inventing, manufacturing is repetitive. Making stuff you do not need is consumerism. But in socialism it is: how to keep busy without needing anything frivolous. The real numbers are 20 percent youth unemployment in America and 30 percent in the EU.
chartreuse
i wouldn’t be surprised if SCZ were caused entirely by gluten…and i really doubt whether depression or anxiety are illnesses at all. and i know that introversion is both something totally non-pathological, but in american society it’s a huge disability.
This is why I am on Social Security Disability Income. But yes those are real and mostly it is because of not only sickness from a poor diet but also the lack of meaning in my life. I want to make stuff in side the computer but I do not know how. I am tired of having ideas where I can not do anything with them. My ideas never become real. To be unable to achieve Self Actualization is depressing. The internet helps me with one third of what I want to do. But it is only a passive medium. Interaction and feedback are what I need. I wish life was more like a video game with fun puzzles. Things will get better soon with artificial intelligence.
if your problem is depression, then you can do it. have you tried drinking? if it’s SCZ maybe not…but…
i’ve known one person…i didn’t really know him…he was a friend of one of my cousins who was diagnosed with SCZ.
he never acted crazy around me, but my relatives told me about some of his delusions.
he’d been treated for depression first…then it turned into SCZ…
i wonder if it was the anti-depressant drugs.
unlike most SCZ cases he had an above avg IQ. i don’t know how much above average, but his dad was an oral surgeon and his brother was a professional poker player.
the cure…if i’m right…to all mental illness is…
live on a desert island for a while.
i find homelessness both inexcusable on the part of society (and yes thatcher there is such a thing) but also on the part of the homeless…or chronically homeless…
if your society has no place for you, leave it!
a life of lobster, crab, feral goats and pigs, and equable temperatures awaits…
that is,
there are lots of uninhabited tropical islands/islets.
if civilization rejects you…just return to being a savage. it’s not as if people haven’t done this…alby mangels found a few…you just don’t hear about them.
st anthony and paul of thebes left civilization behind and both lived past 100 years by themselves in the egyptian desert.
maybe their lifespans are an exaggeration, but not by much.
diogenes’s lifespan is much more credible.
and the ledger doesn’t lie…
diogenes of sinope 89
alexander the great 32
buh-duh-bum-ching!
who was really the greater man?
Yet another incorrigible bot
and in the case of SCZ or manic psychosis i can think of two very modern and seldom acknowledged tensions in human existence.
1. almost everybody is a nobody
2. the world is simply too complex for anyone to understand yet there is still a great desire to understand it.
so one can see how in the less intelligent…
1. leads to paranoia
and
2. leads to delusions…stupid delusions.
but until recently the biggest human groups were 70 in number. the world was mysterious but at the same time very simple. no mass media. none could read. etc.
it is a constant impulse of hereditists and other ideologists to naturalize what is not natural.
modern human existence is not natural. though some fare better than others, none are fit for it. humans are not ants.
Put an elephant to act like a human being and it is extremely likely that HE will not, especially regarding the idiosyncrasies of ” our ” beloved, save, save, species. The human being has shown that he can indeed ‘be like an ant’.
Do not blame modern society,
do not blame what you consider as degeneration,
do not blame any of this, unless
– Those in the power,
– Intellectual mediocrity and therefore analytical mediocrity of the average human being, but not only in relation to the ” average’s ”, but also for a good part of neurotypicals who ”are” more ” intelligent ”.
The human species is at the same time, very clever (comparative perspective), and extremely stupid (essential perspective).
Human beings have been guided by three forces
– Irresponsible creativity,
– Administrative psychopathy,
– Cultural schizophrenia.
A big shit.
in order to take the next step…
in order to go from the north col to the hillary step…
without oxygen…
requires that one embrace in-sanity, that one will himself to be in-sane…
(i count chomsky a kindred spirit in this respect.)
in the sense that sanity is mostly an in-cognizant acceptance of convention and an acceptance of one’s lot, whatever it is…and to the extent that one rejects these…he shall be cast into a furnace of fire: there shall be wailing and gnashing of teeth…that is, maintaining one’s sanity within an environment he finds intolerable and permanent…is…what’s the word…crazy-making?
if one cannot change his lot…and none can change convention by himself…what recourse has he when the man made world and his society is in-tolerable?
John Nash:To some extent, sanity is a form of conformity. People are always selling the idea that people who have mental illness are suffering. But it’s really not so simple. I think mental illness or madness can be an escape also.
Very impressive post. Do you plan to publish professionally? If so, are you working to get the necessary credentials?
Academia could use a heterodox psychologist like yourself. Echo chambers get boring.
No I have no plans to publish professionally. And you don’t need any credentials to publish in academic journals, I was pleasantly surprised to learn..
said peepee to her dyke black self
I think that Comic artist and CGI people in Hollywood are just above 125.
“SELF-MADE DECABILLIONAIRES: Mean IQ 151 (U.S. norms); IQ 151 (U.S. white norms)”
http://www.forbes.com/special-report/2013/fictional-15/tony-stark.html
#4 Tony Stark
$12.4 B
Profile
An engineering genius who earned two master’s degrees by age 19, Stark’s remarkable inventions (repulsor rays, “Iron Man” combat armor) are often outshined by his ability to create controversy. His latest foible: publicly threatening the terrorist known as The Mandarin, who responded by destroying Stark’s Malibu mansion. Still, the billionaire playboy’s net worth is actually up year over year, thanks in large part to the stewardship of Stark Industries CEO (and subject of a recent Forbes cover story) Pepper Potts.
I didn’t know Forbes estimated the net worths of fictional people too. That is so cool.
the whole world today lives under what with some perspective one can see are three absurd DELUSIONS…
Who controls the past controls the future: who controls the present controls the past.
1. the soviet union was a total failure. it’s leaders were either venal liars or motivated by envy, etc, etc.
2. hitler was a monster…anything but a “great man”…
3. the one holy roman and apostolic church is full of shit and always has been.
only if you’re fucking retarded can you not see through this bullshit…
this anti-historical bullshit.
the average soviet and german and european didn’t see through it.
aren’t “we” all so much wiser than those poor sods?
On the topic of IQ and decabillionaires, I had the pleasure this evening of attending a Q&A / lecture by Michael Bloomberg, former mayor of New York. The man has a net worth in the stratosphere. Very articulate man.
Anyways, he made an interesting comment that I thought I’d share with you. When asked about the futures of China and India, the world’s two most populous countries, me mentioned that, while there are a great number of second-generation Indians immigrants entering the top tiers of US business, there are very few second-generation Chinese people accomplishing the same. Bloomberg said that this discrepancy has puzzled him for a long time. I seem recall you mentioning on your blog something about Indian immigrants possibly having an average IQ as high as 110. The correlation between IQ and wealth being what it is, do you think this could explain the difference in outcome? (Knowing you, I’m assuming yes).
On another note, if the Republicans were to coalesce around Rubio and the Democrats around Clinton, and Bloomberg decides to throw in, I’ll have personally met every one of the presidential candidates (though only had pictures taken with the first two).
Very cool that you’ve been able to meet such rich and powerful people. The richest person I ever met was Steve Ballmer (who at his peak was the 5th richest person in America). There was a rumor going around the Caribbean cruise I was on that Ballmer was on the boat, but I was the first to spot him, because I recognized him from the Forbes list, and told him so. He laughed and shook my hand
How wide is each distribution? How much of a loser am I if I am 120+ but I’m not a self made millionaire by my early 30s? (Net worth: between 100 and 200k).
I should have read the rest of the post..
Also, it’s important to note that this post only discusses IQ as a function of money, which is very different from money as a function of IQ.
It’s very common for self-made billionaires to have IQs above 130, but it’s extremely rare for people with IQs above 130 to be billionaires.
Yes, I visually imagined a tall bell curve representing x = IQ = 100 and income = suburbanite, then tiny bell curves at x = IQ = 120 for income = millionaire and income = decabillionaire. we’re dealing with 3 dimensions here but I just imagined a graph along 2 and put the 3rd behind the rest? Anyway, the stddev = thickness of the IQ=100 would determine how much of a loser I am for being 120 w/o a high income, right? That’d show how much ‘overlap’ there is from the normies.
Ok, I like the analysis you did here, but you have to admit it’s highly speculative.
First of all, consider the middle income ($30-40k per annum) people: Is it necessarily true that they would test at IQ = 100? To show how it might not be true, do a thought experiment. Imagine you have a population of people where 40% are earning $20 per day, 8% are earning $10 per day, ~42% earn $5 per day and 10% earn nothing per day. Let’s say IQ follows the expected bell curve, which means the top 40% in income is also the top 40% in IQ. In this case the median income is $5 per day and the average IQ of someone earning $5 per day would be the average of IQs between the 10th percentile and the 52nd percentile, which is not 100.
Secondly, the idea that decabillionaires would have an average IQ at 133 is very suspect. It assumes a normal distribution among these very rich people, which I just don’t think is likely. In my opinion, it is more likely that people become rich for a variety of reasons, one being because they are super-geniuses. But you could also become rich by being a ruthless dictator or by having no scruples and no fear (Pablo Escobar and the mafia bosses, for instance).
Anyway, as I said, I enjoyed the analysis you did, but it’s highly speculative and contains a lot of hidden assumptions.
Just to clarify, it was all self-made billionaires that I estimated to be 133. Self-made decabillionaires I estimated to be 151.
I agree that people get rich in different ways, though I think most rich people have a combination of the traits that are needed to get rich.
I agree that some of my numbers contained hidden assumptions, but if you toss out all the data points that seem suspect (i.e. median income earners, self-made billionaires, self-made decabillionaires) and just look at the data points you feel you can trust (i.e. homeless IQ, welfare IQ, self-made millionaire IQ, etc), I suspect you’ll find virtually the same linear relationship between money and IQ (when both are expressed as normalized Z scores).
In other words, I don’t think any of the questionable assumptions I made significantly changed the slope of the standardized regression line.
You’re probably right.
Super Geniuses do not become rich with out being born rich or sucking up to the already rich (letting them profit off their Genius)
Pingback: Increasing IQ Level - Do you think it is possible?
It is difficult to tell who is more intelligent, Kanya or Colbert, based on income. Both are entertainers but stars are made not born. Once they are in, great performance lead to higher paid contracts. Does fame really make you smarter?
As the outlet revealed, Kanye West’s net worth is a reported $145 million, but he’s reportedly trying to “get out of debt.” Meanwhile, Kanye West’s wife’s net worth is an estimated $85 million — and she’s reportedly refusing to help him with his finances.Mar 8, 2016
Stephen Colbert Net Worth: $45 Million. Stephen Colbert’s net worth is $45 million, according to Celebrity Net Worth. He reportedly earned a $6 million salary on “The Colbert Report.” His salary for “The Late Show with Stephen Colbert” has been kept under wraps, but it was revealed he signed a five-year contract.
”Kanya” is smart****
look Pump,
you say your lunacies and a lot of other people believe in it.
People really hate the word
A
V
E
R
A
G
E
This word is funny and empathetic, believe in me!!!
The joke is on me.
average people are richer than me.
for the least amount of mental effort.
what gives?
At least I had fun with math and logarithms. Solving math problems is not about believing in anything particular. Templates are helpful tools to use in math. My emotional state varies time to time yet my thoughts are not carved in stone. That is the way it has always been for me. Even posting that video makes me look bad, as if I idolize Kayne West. I find it silly that he is so rich. 😉
be rich is not a virtue.
Yes, the joke is also for you.
materialistic people are joke itself.
mental effort to do shit is senseless.
human social evolution is purposely blind and schizo-form.
human ”creativity” is quasi always irresponsible.
mental effort to do shit is senseless.
Eating breakfast in the morning and going to bed on time did make school easier for me. The reverse of effort would be calm awareness. The quiet stillness is maintained longer. Like learning to hold you breath ten minutes under water diving 100 meters below the surface. That takes willpower. Some tasks require more willpower than others. Effort can be construed as the amount of willpower you can maintain.
materialistic people are joke itself.
I was never into materialism. I realized early on that it was never the meaning of life. At times I felt there was no meaning. I continue to exist nonetheless.
be rich is not a virtue.
No but it is a tool.
Some people know how to use this tool.
The premise so far is that self made people earned their money. Getting shitloads of money by becoming famous means everything was handed to you. That is the divorce between intelligence and money. You do not need to be intelligent to have shitloads of money.
”Eating breakfast in the morning and going to bed on time did make school easier for me. The reverse of effort would be calm awareness. The quiet stillness is maintained longer. Like learning to hold you breath ten minutes under water diving 100 meters below the surface. That takes willpower. Some tasks require more willpower than others. Effort can be construed as the amount of willpower you can maintain.”
yes but intrapersonal intelligence ”know thyself” is also extremely important both development of talent and genius.
When i read people here saying stupid things like ”intrapersonal is politically correct ‘intelligence” style” without really analyse what they are doing i become very angry.
Wisdom (start with intra-personal intelligence) is very important to the development of talent/potential and also the genius/super creative potential.
Sorry about what I said.
Just now I realized what you meant.
I don’t believe what PP says.
I do read the comments in opposition.
(I don’t hate being “Average”)
(It just means I understand less)
Kanye is just as smart as Colbert.
He is just comedic material for comedians,
like anyone else. Both know themselves and
are very talented. I just think that influential,
people know how to blosum those talents.
So just about anyone could grow in that way.
I need more intrapersonal intelligence.
I would then make less mistakes.
The video is still hilarious.
wait???
The reason Kayne is rich is because of his big ego.
Big egos are highly marketable in the entertainment industry.
I never thought ”Kanya” is smart****
That is why I implied there being a difference between him and Colbert.
It would be the counterexample that money = intelligence.
And I do not even watch TV. that video was in my YouTube suggestions box.
I should be a bit more explicit of what I mean when I make comments.
Animekitty“Does fame really make you smarter?”
Obviously fame increases self consciousness, that doesn’t make you smart****
The subtly is that my comment could be seen implying I think Kanye is smart****
Average people worship celebrities, I don’t.
I just remembered this video had relevance to this blog post.
I have a good memory for such things (relevance).
Pumpkin Person,
This is my house, I am 29, what is my IQ?
Do you own it?
Yes, I own it.
but on a 30-year mortgage.
I..Q= 36,75
There are some serious studies like this one http://pubs.aeaweb.org/doi/pdfplus/10.1257/089533002760278686 showing that IQ is a less important factor than the individual’s location, their inherited wealth, personality, schooling and race.
An important distinction has also to be made between income & wealth. There is some good evidence that those with higher IQs tend to get paid more (income). But because of some of those other factors mentioned, that didn’t alter overall wealth, so that:
“A nationwide study found that people of below average intelligence were, overall, just about as wealthy as those in similar circumstances but with higher scores on an IQ test.”
https://researchnews.osu.edu/archive/intlwlth.htm
This blog post seem to stretch small samples of tentative evidence into conclusive facts. But even if we took some of the numbers at face value, there’s an important point to be made.
Even if we assume, as this blog post says, that billionaires have a “mean IQ” of 132-133, the aforementioned nationwide study https://researchnews.osu.edu/archive/intlwlth.htm
shows that
“the average income difference between a person with an IQ score in the normal range (100) and someone in the top 2 percent of society (130) is currently between $6,000 and $18,500 a year.”
That’s not very much at all! In other words, even if you believed that someone with an IQ of 130 deserved to be a billionaire, the fact is a majority of people with an IQ of 130 are not billionaires, and do not, in fact, even make significantly more than people with an IQ in the normal range.
So you would still have to agree that the system is highly unjust.
Also, notice that currently 8 billionaires own as much as 3.6 billion people, which is quite fewer than in the near past. https://www.oxfam.org/en/pressroom/pressreleases/2017-01-16/just-8-men-own-same-wealth-half-world
So while IQ distribution is the same as it was, wealth concentration has increased and more wealth is now in the hands of fewer people.
And of course, knowing the kind of brutal exploitation that takes place around the world — as well as the environmental devastation that happens as a result of lavish lifestyles-, there is simply no justification for that kind of wealth.
A more sensible remunerative guideline would be to reward people according to effort and sacrifice toward a socially and environmentally acceptable task.
“the average income difference between a person with an IQ score in the normal range (100) and someone in the top 2 percent of society (130) is currently between $6,000 and $18,500 a year.”
That’s not the RAW difference in income, that’s AFTER holding several factors constant. The raw difference is much greater:
https://pumpkinperson.com/2014/11/09/hypocrites-who-deny-linear-iq-income-correlation/
Christ, $100k/year for a 150IQ is an insult
As a 120-130IQ I still find it insulting
Did you make that graph in excel?
No.
Where did you make it?
I just did a google or bing search for an online bar graph maker. Don’t recall the specific one.
” “the average income difference between a person with an IQ score in the normal range (100) and someone in the top 2 percent of society (130) is currently between $6,000 and $18,500 a year.”
That’s not very much at all!
So you would still have to agree that the system is highly unjust.”
I dont think the system is unjust at all.
if we control for IQ then people make what ever they want to make.
tomorrow i could get a job as a hedge fund trader and make triple what i’m making now with performance bonuses alone.
I have the CV to get that job but the reason i don’t is because i don’t want that life.
No balanced person wants to work 50 hour weeks or to be told that they don’t have to go to an after work function but it would look bad if they didn’t.
For me quality of life is more important than money. but then again, i am in the 96th percentile of income in the country that i live in.
elite education doesn’t skew the income differences that much because the alumni of elite colleges are a tiny fraction of the workforce.
If i could go back in time i would have gone for a lower paid profession.
I would probably have been a Jeweler or a private school math teacher.
Its perfectly fair. And its perfectly obvious.
Its why trump is a “winner”
Pingback: Memetics – Strange Rider
Pingback: The Myth of Gender Equality | Talon's Rest
There are 2,000 billionaires on the planet
There are 3,000,000 people on the planet with +150 IQ
Unfortunately, prior to this comment, I misplaced a decibel and made a few posts stating that there were 300,000,000 people in that bracket. Its fine though. The income distribution is still vastly unfair based on the real distribution of potential aptitude in the population.
This is the result of capitalism really….the smartest that claim the most property hire the rest of the smartest that they like to turn a profit for them which further consolidates their leveraging against their peers. Eventually we will end up with a few more homeless geniuses who simply can’t accept these circumstances as the result of the winners gaining more discretion and becoming more picky about who they allow to earn a living on their property. They would very much prefer a 110IQ that worships their wealth and respects their privilege than a +130IQ that detests it and demands a cap on wealth accumulation.
Pingback: Memetics – Master of Memetics
Pingback: Hack your brain: 5 ways to improve your intelligence – Transitions to Freedom
If 150 is 1 out of 9 000, it means that you have 900 people with this average IQ each generation in the USA (supposing an average of 97). You have 110 decabillionaires and 75 self made. If you consider a 25 years flow, it’s 3 a year.
So that means the high IQ group has 1 chance out of 300 of becoming a decabillionnaire. That doesn’t mean that this group on average does better than an 115 average IQ group. My guess is that their median IQ is quite low. Many people of +3sd IQ thinks that a very high % of them have very low job occupation, lives alone, and have some sort of mental pbs : take Cooijmans or Robert Lindsay or Ronald Hoeflin.
Both views are possible if you imagine their distribution being absolutely not norma.
In academia, the tests you mentioned from the 50 and 60, showed that academia had average IQ of 125 with only 5 sd deviation, but in a Nobel prize range, the average was in 150. That means if your 150, you certainly won’t be a Nobel Prize and won’t get a tenured job in academia and end has an eternal exploited post-doctorate weirdo.
PS : I don’t have any interest in defending very high IQ “losers” or “reproved”, because everything was very easy for me in academia and in my professional life, every outcome I ever desired was fulfilled. But i think I more of an exception.
My guess is that their median revenue is quite low.
Pingback: The correlation between IQ and income | gtgbusiness1
Pingback: Unsupervised Learning: No. 94
What is incredible here are your incorrect calculations. You’re confusing Z-score with percentile. Since “income” does not have a normal distribution, but a distribution with an huge long tail, you can not equate the two. Jason Malloy in one of his posts calculated that the standard deviation of income is about $ 50000.00. That means that the Z-score of billionaires is about 40,000 !!! The Z-score of decabillionaires about 120000 !!! Very different from the 4.8 and 5.23 you wrote. And median income is not equal to Z=0. Z=0 translate to MEAN income. As the distribuition is heavy skewed, median and mean are not equal. Another point is that billionaires are outliers and to estimate the correlation of the entire population, you should not give the same weight to outliers that give to the rest of the population. There are other significant errors such as taking Steve Balmer’s IQ as 162 assuming that all the best young American mathematicians (born in 56) participated in the Putnam Competition and that the correlation between mathematical ability and IQ is equal to 1.
You’re confusing Z score with normalized Z score. I used the latter.
As for outliers, I’m assuming a linear relationship when variables are normalized which seems largely true from the data.
Using the normalized Z score you are assuming that income is distributed normally, which is absurd. If you look you should find graphs of the distribution of the logarithmic income. Even taking the logarithm of income, it does not take the normal form. Without taking the logarithm, the curve looks more like a truncated Levy distribution, or the sum of a gamma distribution plus an exponential.
I’m not at all assuming income has a normal distribution. I’m forcing it to. Similar to taking the logarithm but this method (suggested to me by a Promethian) works better.
One solution to dealing with this problem is simply to take the correlation between the individual data, which is the direct solution. But you can estimate the individual correlation from data stratified with the “Spearman-Brown Correction Correction”. Instead of taking the maximum correlation equal to 1, you assume that no matter how you stratify your population, there will be an asymptote you will not pass on. It is better to explain this hypothesis: Let X1 be equal to 0.5 * a + 0.5 * b. “a” and “b” are symmetric distributions of equal and uncorrelated variance. What is the correlation between “X1” and “a”? 0.5 ^ 0.5 = 0.707. Now suppose you measure a second variable that is equal to 0.5 * a + 0.5 * c, “c” and “b” are not correlated and c also has the same variance of “a”. What is the correlation between “X1 + X2” and “a”? 0.66 0.5 0.5 = 0.81. Then, as you add up the variables, the correlation will increase, being very close to 1 adding enough data. Spearman-Brown’s correction deals more or less with that. But in practice, it was found that the formula generated absurdly low scores for individual correlations from stratified correlations. A proposed solution is to verify the existence of an asymptote, because the data are not normal and correlations are not linear, and use it in the Spearman-Brown formula.
and that the correlation between mathematical ability and IQ is equal to
The correlation between IQ & IQ is not 1. Meaning two different IQ tests often correlate only 0.65.
Many tests not formally called IQ tests correlate as well with IQ as most IQ tests do with eachother, so the distribution of scores produced by these proxy measures should closely resemble the distribution of scores produced by official IQ tests, except in cases where people were explicitly selected by said proxy measures (see Ivy League regression)
“0.66 0.5 0.5 = 0.81”
Ok, Firefox fucked my explantion…
0.66 ^ 0.5 = 0.81
Ok, a better explanation of why this is wrong:
If you know python, simple do a simulation, where IQ is a normal variable(do it with a np.random.normal array of size ~1000000, mean = 0 and std = 1) and income is a sum of 0.1 * IQ plus 0.9 times a random exponential variable of scale equal to 1. Select the percentiles, as you did in your analysis, “forcing” a normal distribuition. You will find a slope of ~ 0.21. But the real correlation ~ 0.1. AND if you manipulate the exponential to realy looks like the income distribuition, your over-estimation will be even worse.
But the correlation between IQ and income is often only calculated after the data is made more normal, not before. Calculating the correlation on the true distribution of income is meaningless, especially at the extremes, because pearson correlation coefficients are only useful on bivariate normal distributions
Wrong. Pearson correlation coefficients are useful on symmetric, finite variance distributions.
the income distribution’s not symmetric
I’ll probably be a millionaire by 30. on track
Pingback: Русская Ноосфера: масштабный обзор уровня IQ по регионам России — Спутник и Погром
I think that this argument is bogus and is just caused by the variation in sample sizes rather than by income or IQ.
As the income goes up the sample size goes down.
As the IQ goes up the sample size goes down.
Small sample sizes usually gives average data too high or too low.
If just a few people in a small sample size have a high income or high IQ the average would be high.
If someone points out a high IQ person with a normal income since the total sample of people with normal incomes is high the average IQ of the normal income group would likely still not be high.
If someone points out a high income person with a normal IQ since the total sample of people with normal IQs is high the average income of the normal IQ group would likely still not be high.
Since in a capitalist society it’s impossible for everyone to be rich what this basically means is that if the high IQ groups represented the largest sample sizes they would not have high incomes.
Your argument is a clear example of how statistics can be distorted to support anything just by using different sample sizes.
Sadly i think you’re a bit confused. I’ll elaborate in evening.
Small samples are more easily skewed by outliers, but outliers are just as likely to be low as high, so your argument makes no sense. Most smart people are not billionaires, but most billionaires are smart. Similarly, most tall people are not in the NBA, but most NBA players are tall. It’s reality, not a statistical artifact.
No the argument makes perfect sense.
I’m sure we could also find a small sample of very high IQ individuals with very low incomes (equivalent to the sample size of self-made decabillionaires).
So that argument is essentially equivalent to the argument on this blog post.
Christopher Langan (super high IQ) was working as a bouncer (low income job), I also heard about some waitresses with very high IQs so it seems like it would be pretty easy to find a small sample size low income group with a very high average IQ.
Most billionaires do not have very high IQs but the total sample of billionaires is so small that if only just a few have very high IQs the calculated average would be very high.
So the statement that most smart people are not billionaires but most billionaires are smart is true but for wrong the reasons…the reason is just because the total sample of billionaires is so extremely small that if just a few people are smart in that sample the average would be high.
Your own post said there are only 13 self-made decabillionaires boomers that exist and only a few actually had very high IQs.
Which is really just distorted statistics since we could easily point out an equivalent sample size of a low income group with the same very high average IQ.
It should be pretty easy to find a sample of 13 people with low incomes and an average IQ of 151.
It seems like the causation of these statistics on this blog post is simply the sample size going down as the income goes up rather than being caused by IQ.
Small sample sizes usually always give calculated averages too high or too low.
Correlation isn’t causation…as the income goes up the sample size goes down…if everyone had a very high IQ would everyone be rich? No.
Christopher Langan (super high IQ) was working as a bouncer (low income job), I also heard about some waitresses with very high IQs so it seems like it would be pretty easy to find a small sample size low income group with a very high average IQ.
You can find a sample of high IQ poor folks but they’re not representative of the millions of poor folks in America. By contrast Bill Gates, Paul Allen, and Steve Balmer ARE indeed representative of the high end of self-made decabillionaires because there were only 13 in the country. If there were only 13 low income people in America, then yes, Chris Langan and the waitress would be important data points cause they’d reflect the top 15% of their economic class, but given the millions of poor people in America, they tell us almost nothing about the IQs of the poor.
They might on the other hand tell us a lot of about the incomes of the super smart, but that’s a separate article.
Pingback: Русская Ноосфера: масштабный обзор уровня IQ по регионам России (Анатолий Карлин) | Атропос
so im using this post in a book im writing thank you.
I think this post is by far your Magnum Opus
Thanks. It’s probably my most cited post of all time.
Pingback: Über den Unsinn einer jüdischen Weltverschwörung – Mendes Blog
If average IQ differs among ethnic groups, psychological and sociological associations should be sharply criticised for not vehemently pointing that this can explain income disparity between blacks, hispanics, orientals, and whites.
If no average IQ difference exists, these associations should be rebuked for having maintained for decades that it does.
Either way, taxpayers should not be forced to fund these disciplines’ research.
Typical conservative thinking…
But the bankers, the true parasites in the room, conserfs don’t care… they are little friends.
That you know that I am a conservative, and that I support the Fed and government-forced use of a fiat currency that it counterfeits, as well as its bailouts and subsidy of the politically-connected -because I would never think anything vaguely related to the non-aggression principle- is quite remarkable.
Wait a minute. Now I understand. Taxpayers should be forced to pay only for research that confirms leftist ideas.
Pingback: Intelligence and Income – Dissenting Academia
Pingback: Intelligence and Income
Excellent summary of the 2006 study, Pumpkinperson. The problem is that some people have no idea what correlation means. If you say that the correlation between IQ and socioeconomic status is, say, 0.5, they immediately assume that you are stating that ALL high IQ people will be rich and ALL low IQ people will be poor. Even with a high correlation of 0.9 there will be outliers.
There is another excellent study worth reading here:
Click to access Top1in100001.pdf
Pingback: Sunday Rant - 2919 - DROVERIA
I believe Bill Gates mother was on the board of IBM when they chose his operating system. Did his mother’s position help build his wealth? It could have also been the $10 million that his parents gave him to start Microsoft. By your measures getting $10 million from your parents already makes you a genius – after all you are selfmade in a way. Harvard has – or did have – remedial reading classes – elite school my butt.Family connections maybe, IQ maybe a very few. How many of these selfmade mega$$ started poor or even in the middle.
Forbes has a great scale where people are rated from 10 (100% self-made oprah & soros) to 1 (100% not self-made the waltons)
Are you sure the standard deviation is that high at each level?
Well we know from studies of the homeless that the SD is not small. If you look at the opposite extreme (the Forbes 400), some have had SAT scores equating to IQ 170 (bill gates) while others have had SAT scores equating to IQ 80 (bill Cosby)
Pingback: Herrnstein’s Syllogism « NotPoliticallyCorrect
Pingback: The Root
Pingback: The IQs of Fields Medalists, Harvard students, politicians, and more – The g factor