For years I have argued that (1) the more branching on the evolutionary tree from which you are descended, the more evolved you are (on average), and (2) the more evolved you are, the more superior you are (on average). To many educated people, this sounds ignorant because regardless of when your lineage branched off the evolutionary tree, all extant life has been evolving for the same amount of time. However years ago, I noticed that taxa descended from less branching just seem more primitive, so there must be a logical reason why branching matters. For example, plants seem more primitive than animals and plants have done less branching than animals.
Recently commenter Race Realist informed me of more modern taxonomy that might not fit my theory as neatly. Luckily, even the new taxonomy supports my theory. For example, after only one split on the evolutionary tree, bacteria/a-proteobacteria branch off. After two splits, discoba branch off. After three splits sa[r]p and amorphea splits off.
So simple branching predicts the clade that contains humans (amorphea) is on top of the evolutionary hierarchy and bacteria are at the bottom. Now among amorphea, once again the clade that contains humans (Holozoa) is tied for the most splits while Amoebozoa has only one.
Sadly, among Holozoa, the clade that contains humans does not come out on top, but I suspects that’s because they didn’t have enough room in the chart to create a comprehensive tree at that level of specificity.
Oprah’s recent interview with Meghan Markle and Prince Harry drew record ratings and made Worldwide front page news for weeks. Cunning and smart, the big brained billionaire knows how to spot an opportunity, and then brilliantly exploit it.
The very British Carole Malone writes:
OPRAH WINFREY is one of the smartest women on the planet. It’s why she’s a billionaire. It’s why when Harry and Meghan invited her to their wedding she went like a shot.
Not because she was overcome with excitement at being a royal wedding guest (although she must have been curious).
And not because of Meghan, who was a two bit actress in a Netflix soap opera at the time. But because, even back then, Oprah, always alert to the main chance, had her beady eye on the Big Interview. She wasn’t Meghan and Harry’s friend back in 2018, having met them just once before the wedding, and I suspect she isn’t now. But everything she’s done to help them, e.g. get their first home in LA, introduce them to all the right people, will have been done with a view to the big prize. And now she’s got it.
Love that line “went like a shot” especially when spoken by a British woman. I just picture Oprah’s private jet flying like a speeding bullet to the UK wedding while using her nearly 2000 cc cranium to calculate how to lure the couple into the interview of the century: The way to get it, is to pretend I don’t want it.
Pretty in pink with a custom made hat to fit her super-size cranium
During the interview, the couple made the explosive claim that an unnamed member of the royal family was concerned that they might produce a dark skinned baby. This caused British gossip Pierce Morgan to go absolutely ballistic. Even though Meghan and Harry clarified that the alleged royal racist was NOT the Queen or Prince Phillip, Morgan took this as a personal attack on her majesty.
However Meghan’s co-ethnic struck back, driving Morgan off the set of his own show. It’s unclear whether he quit or was fired, but after thousands of viewers and Meghan herself complained about his behavior, he never returned.
Meanwhile on the other side of the pond, talk show host Sharon Osbourne defended her friend Morgan against accusations of racism. This led to allegations that Osbourne herself was racist, and after being allegedly ambushed on her own show, she too was removed from TV indefinitely.
Queen Elizabeth released a statement saying she will address Meghan and Harry’s accusations in private. The palace has also opened up an investigation into whether Markel bullied palace staff. Many are asking whether the monarchy can survive this.
Meanwhile the real Queen sits somewhere in her $100 million Santa Barbara mansion, watching all the chaos she unleashed.
In a previous article I declared the kalash to be white, even though they diverged from whites 12,000 years ago and are more genetically unrelated to whites than whites are to non-white Caucasoids. Commenter “Some Guy” wrote:
I assume you wouldn’t group together two different species as one just because they had a similar phenotype Pumpkin, isn’t it a bit strange to do the equivalent with races/subspecies?
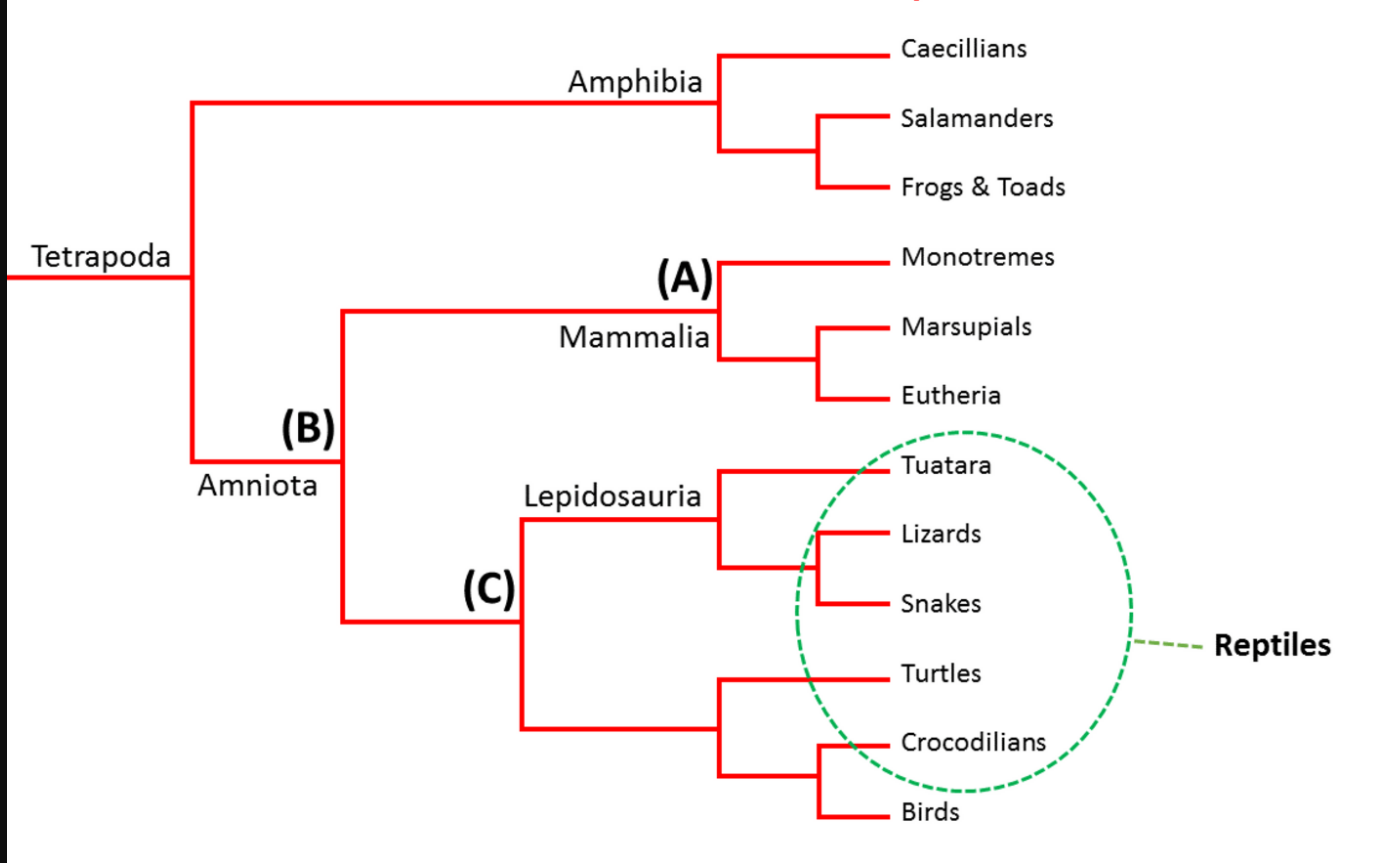
Some scientists (not all and perhaps not most) do group different species together into the same taxon based on phenotype. A good example are reptiles. Note in the below evolutionary tree, crocodiles and snakes are both reptiles, but birds are not, even though crocodiles are much more closely related to related to birds than to snakes. Thus the grouping is based on phenotype, not lineage.
However no scientist would ever classify bats as a type of bird even if their phenotypes were 100% identical (which they’re not).
Do any of my readers grasp the subtle difference between the two trees that makes it okay to lump distantly related but phenotypically similar species together in some cases but not in others? I’ve mentioned it before but people often ignore me. 🙂
UPDATE 2021-03-18
So now that commenter Lerenzo (and perhaps Austin Slater) grasped the difference, I can now make it explicit.
It’s NEVER okay to lump genetically distant species together (no matter how similar the phenotype) if they form a polyphyletic group but some scientists feel it’s okay if they form a paraphyletic group. Of course everyone agrees it’s okay if they form a monophyletic group.
The reason polyphyletic groups are not okay no matter how phenotypically similar they might be, is probably that their similarity has independent origins. By contrast phenotypic similarity in both monophyletic and paraphyletic groups is inherited from a common ancestor.
Unfortunately many scientists today even reject paraphyletic groups and treat all monophyletic groups as taxa regardless of phenotypic diversity. This has led to absurdities like humans being called apes, birds being called dinosaurs, and Andaman Islanders being denied their blackness.
The Kalash are a fascinating population because they look just like whites, yet are indigenous to South Asia. Genetically, they are more distant from Whites than Whites are from the blackest skinned South Asian which is why I’ve long argued that genetics is a poor way to define race.
Human populations show subtle allele-frequency differences that lead to geographical structure, and available methods thus allow individuals to be clustered according to genetic information into groups that correspond to geographical regions. In an early worldwide survey of this kind, division into five clusters unsurprisingly identified (1) Africans, (2) a widespread group including Europeans, Middle Easterners, and South Asians, (3) East Asians, (4) Oceanians, and (5) Native Americans. However, division into six groups led to a more surprising finding: the sixth group consisted of a single population, the Kalash
So isn’t that interesting that when you divide the human genepool into five clusters, you get traditional races: 1) Negroids, 2) Caucasoids, 3) Mongoloids, 4) Australoids, and 5) Americoids. But when you divide us into 6 clusters, the Kalash emerge as their own distinct macro-race. This shows that the split between Kalash and conventional Caucasoids is about as deep and as ancient as the paleolithic splits between major races like Native Americans and East Asians and predates civilization, agriculture and even the Holocene.
Since the split from other South Asian populations, the Kalash have maintained a low long-term effective population size (2,319–2,603) and experienced no detectable gene flow from their geographic neighbors in Pakistan or from other extant Eurasian populations. The mean time of divergence between the Kalash and other populations currently residing in this region was estimated to be 11,800 (95% confidence interval = 10,600−12,600) years ago, and thus they represent present-day descendants of some of the earliest migrants into the Indian sub-continent from West Asia.
If the Kalash diverged from the ancestors of whites 12,000 years ago, yet look just like whites, then either a white looking phenotype evolved twice independently, or much more likely, the white race is at least 12,000 years old.
Whites should be very proud to be 12,000 years old! Young enough to imply evolutionary progress (if you believe in such) but old enough to have been selected by nature (before agriculture and civilization).
It would be nice if some of the white nationalist types who are so concerned about preserving the white race, would put some of that energy into preserving the Kalash who are far more at risk of extinction and represent the last representatives we have of original whiteness.
With a mean IQ of 100, whites are one of the highest IQ groups on the planet (behind only Ashkenazi Jews and East Asians). But were their genetic IQs 100 from inception, or did they only become 100 after agriculture and civilization. We know for example that Native Americans and Arctic people score lower than their East Asian cousins, suggesting that the neolithic transition might have boosted IQ.
Thus I would predict that the Kalash (even if raised from birth in middle class Western society) would score at least 0.5 SD below conventional Whites.
It’s also interesting that the Kalash are some of the earliest migrants into South Asia. Is it possible that South Asians evolved from whites?
A reader stated provided a screenshot of his performance on humanbenchmark.com.
The reader states:
… humanbenchmark.com, that website where you test your reaction speed, has a wide selection of other psychometric tests, I’d guess a composite score of all the tests would probably have a decently high g-loading. I just want some background info on these tests, if there is any.
As discussed in previous articles in this series, some of the tests (sequence memory, number memory) have their roots in conventional psychometric tests. Tests of reaction time date back to the 19th century work of Francis Galton who believed that basic neurological speed predicted intelligence. Unfortunately Galton’s research was derailed by a lack of reliability (he only used a one trial measure of reaction time) range restriction (his samples tended to be elite) and improper measures of intelligence with which to relate reaction time (he compared it with school grades since IQ tests had not yet been invented). As a result, he detected virtually no relationship between reaction time and intellect.
Nearly a century later Arthur Jensen would revisit Galton’s work, correcting for these problems. He found that when you aggregated many different kinds of reaction time (simple, complex, etc) measured both by speed and consistency (faster and less variable RTs imply higher intelligence) over many different trials, and compared with measures of IQ (not grades) and corrected for range-restriction, the results correlated a potent 0.7 with intelligence.
Unfortunately, the human benchmark test only uses simple reaction time (which is much less g loaded than complex RT), only one type of simple reaction time (an aggregate of several types is more g loaded) and only measures speed (variability is much more g loaded) and does not provide a composite score weighted to maximize g loading. As a result, on the whole the human benchmark tests seem inferior to the game THINKFAST which a bunch of us played circa 2000. So accurate was THINKFAST that the Prometheus society considered using it as an entrance requirement, with one internal study finding that one’s physiological limit on THINKFAST correlated a potent 0.7 with SAT scores in one small sample of academically homogenous people. Having people practice until hitting their physiological limit was a great way to neutralize practice effects because everyone must practice until their progress plateaus.
Sadly, this innovative research petered out when people worried that Thinkfast might give different results depending on the computer. People fantasized about Thinkfast being on a standardized handheld device so scores could be comparable, but in those days, few people imagined we’d one day all have iphones and ipads.
The reader continues:
I’ve also attached a screenshot of all my average scores, though I’ll note that some scores are inflated since I’ve done all the tests many times and I often don’t bother finishing the test if I do bad. The strange thing about these scores is that by more conventional measures both my verbal IQ and working memory are pretty average, yet I’m able to score above the 99.9 percentile on 2 of these tests. I think this points to the fact that memory is an ability that is much broader than most IQ models would suggest. Like the verbal memory test in particular, I seem to be using a very different part of my brain compared to more typical tests like digit span. I’d also wager that most of the variation in working memory can be explained by chunking/processing abilities rather than raw storage capacity. Also, what does the strength of the practice effect really say about a test? None of these tests really have a pattern or trick to them, yet for some of them my score has improved a lot from the first time I did them.
This is an extremely important question. In complex cognitive tasks like chess or conventional IQ tests, practice improves performance because we learn strategies, but on elementary cognitive tasks like Human Benchmark and Thinkfast, fewer strategies are possible so one wonders if there’s an increase in raw brain power.
The analogy I make is heigt vs muscle. If I repeatedly had my height measured, I might score a bit higher with practice. Not because I was genuinely getting taller, but because I was learning subtle tricks like how to stand straighter. By contrast if I had my strength measured everyday, I’d show more increase, but this increase would not simply be because I acquired tricks to do better (how I position the barbells in my hands) but because a genuine increase in strength.
So is intelligence more analogous to height or physical strength (the latter being far more malleable)? Is the practice induced increase in Human Benchmark tests an acquired strategy (even a subconscious one) or a real improvement, and how do we even operationalize the difference?
If practicing elementary cognitive tasks really did improve intelligence we’d expect brain-training games to improve IQ, but apparently they do not. Jordan Peterson explains that the problem is that cognitive practice in one domain does not translate to other ones.
On the other hand, why should anyone expect brain training to transcend domains? When a weight lifter does bicep curls, he doesn’t expect it to make his legs any stronger, so why should someone practicing visual memory expect to see an increase in verbal memory, let alone overall IQ?
But how can we know if we’ve even improved a specific part of intelligence rather than just become more test savvy? We know that weight lifting has improved our strength, and not just our technique, because we can see our muscles getting bigger, so perhaps cognitive training games might make certain brain parts bigger.
The groundbreaking London Taxi Cab study, published in 2000, used MRI technology to compare the brains of experienced taxi cab drivers and bus drivers who drive the city streets of London every day. In contrast to bus drivers, whose driving routes are well-established and unchanging, London taxi drivers undergo extensive training to learn how to navigate to thousands of places within the city. This makes them an ideal group to use to study the effects of spatial experience on brain structure.
The study focused on the hippocampus, which plays a role in facilitating spatial memory in the form of navigation. The MRI revealed that the posterior hippocampi of the taxi drivers were much larger than that of the bus drivers (who served as the control subjects). Even more exciting was that the size of the hippocampus directly correlated with the length of time that someone was a taxi driver–the longer someone drove a taxi, the larger their hippocampus.
The London Taxi Cab Study provides a compelling example of the brain’s neuroplasticity, or ability to reorganize and transform itself as it is exposed to learning and new experiences. Having to constantly learn new routes in the city forced the taxi cab drivers’ brains to create new neural pathways “in response to the need to store an increasingly detailed spatial representation.” These pathways permanently changed the structure and size of the brain, an amazing example of the living brain at work.
Assuming the brains of the taxi drivers actually changed (as opposed to the sample changing because less spatially gifted drivers left the job) it might be possible to increase specific parts of intelligence, but since there are so many different parts, it’s perhaps impossible to ever increase overall intelligence (or overall brain size) by more than a trivial degree. We can improve our overall muscle mass because our muscles are outside or skeleton; by contrast our brains our inside our cranium so its growth is constrained. It could be that improving the size of one part of the brain requires a corresponding decrease in other parts, to avoid the overall brain from getting too big for its skull.
My research assistant 150 IQ Ganzir also weighed in on the reader’s questions, writing:
The first aspect of this score profile I noticed is the absence of any huge dips, the 10 on Number Memory notwithstanding, since a tiny change in raw score on that test can dramatically alter your percentile ranking. Given that all of this subject’s scores on the more IQ-like tests are well above average compared even to other HumanBenchmark users, who themselves are undoubtedly self-selected for superior proficiency on these types of tasks, we wouldn’t expect their reaction time to be particularly fast, but it is. Our subject appears to be a jack-of-all-trades, if you will, at these tasks. Simple reaction time has only a weak correlation of about -0.2 to -0.4 with IQ, according to Arthur Jensen on page 229 of The g factor. Note that the correlation is negative because a faster reaction speed implies a lower reaction time.
The commenter mentions: “I’ve also attached a screenshot of all my average scores, though I’ll note that some scores are inflated since I’ve done all the tests many times and I often don’t bother finishing the test if I do bad.” If true, this would indeed cause a statistical upward bias, but I have no idea how to even begin calculating the size of that. However, if the tests are reliable in the statistical sense, meaning they give similar scores with each administration, then the average score increase couldn’t be too large. But, then again, if the commenter was reaching nearly the same score every time, why would they restart on a bad run? High intra-test score variability might indicate executive functioning problems.
The commenter notes that their verbal IQ and working memory are “pretty average” on other tests, but their score on verbal memory here is so high relative to other HumanBenchmark users that the system just gives it 100th percentile without discriminating further. (I know that it can’t literally be 100th percentile, as I and several other people I know have achieved higher scores.) A possible contributing factor is that HumanBenchmark users may tend to have less than long attention spans, inhibiting performance on this test, on which reaching one’s potential may take quite a while, especially for higher scorers.
Our correspondent also writes: “Like the verbal memory test in particular, I seem to be using a very different part of my brain compared to more typical tests like digit span. I’d also wager that most of the variation in working memory can be explained by chunking/processing abilities rather than raw storage capacity.” Of course, I don’t think it’s possible to determine by introspection which part(s) of the brain you’re using on a given task, but I think I understand the subjective experience described here. As for chunking/processing abilities versus raw storage capacity, I’m not sure what’s implied here. The human brain could be described as a massively parallel computer, and it naturally processes things in chunks. If “chunking” refers to purposely learnt mnemonics, such as the mnemonic major system, then Goodhart’s Law applies here because learnt skills lose their g-loading.
The commenter thus wonders about the continued meaning of their scores: “Also, what does the strength of the practice effect really say about a test? None of these tests really have a pattern or trick to them, yet for some of them my score has improved a lot from the first time I did them.” Unfortunately, without studies of these tests specifically, we can’t know the extent to which Goodhart’s Law applies. Even analyses of seemingly similar tests from mainstream psychometrics wouldn’t be insufficient, since the HumanBenchmark versions are subtly but crucially different. All I can say is that only someone of uncommonly high cognitive capacity could produce this score profile regardless of how much time they spent practicing, and that, with no indication of how rare your scores are compared to the general population, greater precision is currently almost meaningless.
Scores on the “Chimp Test,” or at least the version on HumanBenchmark, are also almost meaningless because unlimited time is allowed to review the digits’ locations before answering, making it less a test of visual working memory and more a test of how long the testee is willing to stare at boxes. Also, most people will probably on average score higher on the HumanBenchmark “Number Memory” test than on the clinical version of the Digit Span test, since the former presents the digits simultaneously and allows a few seconds to mentally review them, whereas, in the latter, each digit is read only once with no opportunity for review.
Finally, the subject’s strong performances on Typing and Aim Trainer make me suspect a background in competitive computer gaming.
Obviously I can’t devote an article to every Human Benchmark test so I’m limiting myself to the best ones. One of the best is number memory.
Digit Span is measured by the largest number of digits a person can repeat without error on two consecutive trials after the digits have been presented at the rate of one digit per second, either aurally or visually. Recalling the digits in the order of presentation is termed forward digit span (FDS); recalling the digits in the reverse order of presentation is termed backward digit span (BDS). Digit Span is part of the Stanford Binet and of the Wechsler scales. Digit Span increases with age, from early childhood to maturity. In adults the average FDS is about 7; average BDS is about 5. I have found that Berkley students, whose average IQ is about 120; have an average FDS of between 8 and 9 digits.
The g Factor by Arthur Jensen, page 262
It should be noted that the Human Benchmark version of digit span does NOT include the Backwards version and shows all the digits at once for several seconds, not each one at a rate of one per second, and it only has one trial per level so there’s no room for error. For this reason I suggest taking your best score on your first two attempts.
So important is this test that it is one of the 10 subtests handpicked by David Wechsler himself for his original Wechsler scale, published in the 1930s.
Perhaps no test has been so widely used in scales of intelligence as that of Memory Span for Digits. It forms part of the original Binet Scale and all the revisions of it. It has been used for a long time by psychiatrists as a test of retentiveness and by psychologists in all sorts of psychological studies. Its popularity is based on the fact that it is easy to administer, easy to score, and specific as to the type of ability it measures. Nevertheless, as a test of general intelligence it is among the poorest. Memory span, whether for digits forward or backward, generally correlates poorly with other tests of intelligence. The ability involved contains little of g, and, as Spearman has shown, is more or less independent of this general factor.
The Measurement and Appraisal of ADULT INTELLIGENCE 5th edition, David Wechsler, 1958, page 70 to 71
On page 221 of The g Factor, Jensen notes that FDS and BDS have g loadings of about 0.30 and 0.60 respectively.
Wechsler goes on to explain that despite being a poor measure of intelligence overall, he included it in part because in his eyes, it’s a great measure of low intelligence: “Except in cases of special defects or organic disease, adults who cannot retain 5 digits forward and 3 backward will be found, in 9 cases out of 10, to be feeble-minded or mentally disturbed.”
The other reason he included it is he viewed it as an excellent measure of dementia.
I’m not convinced the test is better at low levels than at high levels. For example, Charles Krauthhammer towered with a spectacular of BDS of 12, and his genius is validated by the enormous influence he had over U.S. foreign policy.
In the below poll your level corresponds to the highest number of digits you correctly remembered on at least one of your first two attempts:
19% of my readers self-reported Human Benchmark sequence memory highest scores of level 21+ (after 10 attempts).
3% of my readers self-reported highest scores of 6 or less.
Evidence continues to accumulate showing that on a scale where Americans average IQ 100 (SD = 15), my global readership towers with an average IQ of 129 (SD = 19). Thus assuming a normal curve, the top 19% and bottom 3% should have IQs of 147+ and sub-98 respectively.
Assuming the sequence memory test is sufficiently g loaded, this implies level 21 = IQ 147 and level 6 = IQ 97.
Thus I would predict that a random sample of American youngish adults would average 6.84 (SD = 4.5).
Put simply:
IQ = 77 + (highest level obtained in first 10 tries)(3.33)
However one oddity about the self-reported data is that all of the people scoring 21+ score 24+. Nobody reported a score of 21 to 23. This suggest inaccuracy of self-reported data but it may also suggest that above level 21, the test starts measuring certain cognitive strategies and stops measuring g.
Humanbenchmark.com includes many tests, the first of which is called Sequence Memory. You can try the test here.
The way it works is nine squares appear on the screen and then some of them light up in sequential order. At level one, one square lights up. At level two, two squares light up. Level three, three squares light up. etc. Your job is to wait for the sequence to finish and then click on the squares in the same sequence they lit up. The test progresses in difficulty until you make a mistake.
It’s interesting to note that when the Wechsler intelligence scale for children (WISC) was first revised (WISC-R) Wechsler tried to add a subtest much like this. In the 1974 WISC-R manual he writes:
All twelve tests were administered to the entire standardization sample, as was also a thirteenth test entitled Visual Motor Memory. The latter test, requiring the child to copy a sequence tapped by the examiner, was intended as a supplementary Performance test and as a non-verbal visual motor analog of Digit Span. In spite of certain merits, the test was eliminated from the WISC-R because it posed problems of administration and failed to meet some of the rigorous statistical standards that were applied.
WISC-R manual page 8
I can see how it would pose administration problems because the examiner would need an excellent visual memory herself just to see if the child repeated the sequence correctly, especially if he did so quickly. But when the test is administered by computer like on humanbenchmark.com, that’s no longer an issue.
Nonetheless, the newest edition of the WISC (WISC-V) includes subtests like Picture Span and Spatial Span. In Picture Span, the child sees a bunch of pictures in correct order and then must remember their sequence when present in random order. This draws on similar cognitive skills as humanbenchmark’s sequence memory test and it correlates 0.61 with full-scale IQ (a strong proxy for g) among 16-year-olds. Oddly, the spatial span subtest (where a child must tap a bunch of blocks in the same sequence he sees the examiner do it) only correlates 0.43 (WISC-V technical manual, page 69), even though this includes a backwards spatial span component. When it comes to auditory sequencing, going from backward to forward doubles the g loading so I’d love to know why picture span is so much more g loaded than spatial span, despite having no backward component. Maybe there’s too much error because the examiners can’t keep up?
Humanbenchmark.com provides percentiles for scores on the sequence memory test, but there’s no context. Does the percentile reflect how many people we beat or how many attempts we beat (many by the same person) ? And how self-selected is the reference sample? It would be interesting to know how my readers (mean IQ 130) do on this test, how their scores respond to practice, and how this relates to their scores on established psychometric tests.
Are there any cases where an individual’s real-world achievement(s) align(s) with that individual’s stellar high-range test score? If so, what achievement(s), what score, and on what test?
The most obvious example is John H Sununu who exceeded the one in a million level is both Mega Test IQ and real-world power (state governor, White house Chief of Staff under a relatively good President: George H.W. Bush, who unlike his son, was competent enough not to invade Iraq). In 1988 the Washington Postreported:
President-elect George Bush’s new chief of staff, John H. Sununu, is a smart guy by all accounts. His doctarate from the Massachusetts Institute of Technology is one clue. His I.Q. is another. On a scale where “genius” is anything over 140, Sununu has been clocked at 176. That makes him one in a million.
Whether he is smart enough to massage the egos at the top of the administration and smart enough to befriend Jewish leaders and smart enough to outsmart his boss remains to be seen. But there is no question that he is book smart.
In 1985, Sununu picked up Omni magazine’s “mega-I.Q.” test while on a plane flight. At the time he was governor of New Hampshire and was busy with the state legislature, but when the session adjourned for the summer, Sununu got serious about the test. You might say it’s his idea of how to spend a summer vacation.
When he and more than 3,000 other Omni readers turned their tests in, Sununu had tied with two others for second place. He correctly answered 44 of 48 questions, where a score of 15 ranked the contestant as a genius with an I.Q. of 141. His score of 44 put Sununu’s I.Q. at 176.
“This test was one of the most enjoyable exercises I have gone through in some time,” Sununu wrote to the magazine, “a superbly stimulating diversion.”
It should be noted that the Mega Test annoyingly uses a standard deviation of 16, so an IQ of 176 is equivalent to 171 on the 15 sigma scale used by the Wechsler and recently even adopted by the Stanford Binet. It equates to the one in a million level. Since the Washington Post wrote that article Sununu’s score has been upgraded to the one in 3 million level.
Among the Omni reading test takers who reported their SAT scores, only two had 44+ Mega Test scores and only two had 1586+ self-reported SAT scores (not the same two), which at least in the 1980s, equated to the one in 700,000 level, so at the very least, I would put Sununu’s Mega score at +4.67 SD, especially since he achieved it on his first attempt and in the pre-internet era (before answers got leaked or became easier to research). Maybe post-Omni data allowed Ron Hoeflin to refine the score upward. Such a spectacular IQ gave Sununu the authority to belittle the intelligence of a man as intellectually respected as Obama.
Sununu is not the only U.S. governor with a reported test score equating to perhaps 170 (sigma 15). In 2006, Eliot Spitzer told the New York Times that he scored 1590 on the (pre-recentered) SAT and a perfect score on the (old) LSAT. In the Omni sample, I noticed Mega Test takers with self-reported old LSAT scores averaged 722 (SD = 30) on the LSAT and IQ 152 (SD 9) on the Mega Test. Assuming linear extrapolation, that would equate a perfect 800 LSAT with a Mega IQ of 175 (equivalent to 170 on the WAIS).
Sununu and Spitzer were not governor at the same time, and did not achieve their scores on the same test, but perhaps at any given time, about one of the 50 U.S. governors would score over +4.5 SD on any particular highly g loaded test (whether the Mega Test, college admission tests, or conventional IQ tests with sufficient ceiling). Similarly, one in 100 U.S. senators (Chuck Schumer) had a self-reported perfect or near-perfect SAT score, as does about one out of every 100 or so self-made members of the Forbes 400 richest Americans (Bill Gates, Paul Allen). If the top one or two percent of self-made real-world elites have IQs around +4.5 SD, it suggests the average (self-made) real-world elite has an IQ around +2 to +2.5 SD.
Sununu may not be the only Mega Test luminary who has achieved so spectacularly in the real-world. Circa 2000, a highly credible person stated “I am told one member of the Mega Society is a billionaire.” It only took $725 million to rank among the 400 richest Americans, but his person, if he exists, probably never appeared in Forbes, but just as different IQ tests don’t correlate perfectly, different ways of assessing and identifying wealth don’t correlate perfectly. But given how few people have qualified for the Mega society, it would be pretty fascinating if one of them was a USD billionaire by any credible measure.
Before I get to part 3 of my series high range tests, I wanted to quickly share my new theory on autism (or at least I think it’s new; maybe someone had similar ideas before).
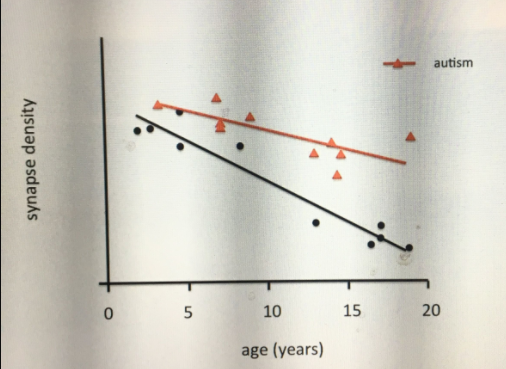
When we are babies our brain begins to form a huge number of connections between neurons to help humans adapt to any environment we might be raised in. By our teens, it’s clear what type of environment we’re in and the brain begins to prune any connections that are not needed in that environment, to preserve resources for the needed ones.
However autistic kids show considerably less pruning than their peers.
Here’s where my theory comes in: autistics are thought to lack social and practical intelligence, or common sense. But common sense comes from experience and so we should expect autistics to be more impaired in acquiring experience based skills because they lack the very pruning process that diverts resources to the neural connections that experience tells them they need.
Does that make them less intelligent? I define intelligence as your ability to adapt, so on the one hand, not having the pruning process makes them much less adapted to their environment, because pruning evolved to maximize the functioning of specifically those connections needed in your environment.
On the other hand, if the environment rapidly changes, the autistic brain will have all these extra synapses ready to exploit it. This may explain why allegedly autistic types like Bill Gates were able to dominate when technology changed so rapidly, the pruning process could not keep up with it. It also explains why autistics tend to do better on so-called fluid tests of novel problem solving than on crystallized tests of acquired knowledge and why autistics seem to have a child-like personality (children like autists, have too many synapses).
So the autistic mind, like the mind of a child, is both adaptable and unadapted: unadapted to the environment they were raised in. Adaptable when the environment changes.
Now schizophrenia is sometimes said to be the opposite of autism, and indeed, schizophrenics show the opposite pattern: too much synaptic pruning. This would result in the social common sense part of the brain becoming too strong at the expense of the ability to learn new stuff. So common sense will tell them, there must be a conspiracy, but when no evidence of a conspiracy occurs, they can’t revise their theories. By contrast autistics may never grasp the common sense theory, but will constantly come up with new ones. This also explains why schizophrenics have higher rates of dementia: too much pruning means less cognitive reserve in old age when the brain naturally shrinks.