
In the chart at the bottom of this article, I estimate the phenotypic and genetic IQs of the 10 “races” described by Richard Lynn (2006). Lynn justified his racial taxonomy by citing the “10” genetic clusters noted by Luigi Luca Cavalli-Sforza.
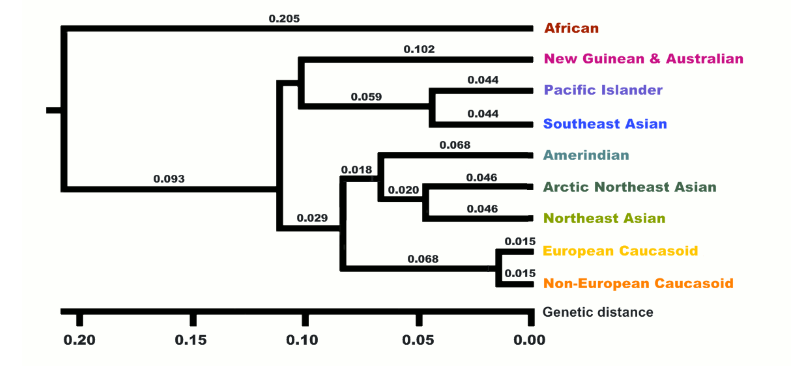
Actually there were only nine but Lynn took the liberty of replacing a single African cluster with two races, which I’ve very roughly labeled Congoids and Capoids respectively.
Locating samples
To estimate the phenotypic IQ of the 10 races, I focused on the country where each race has the most people. So for example, China is the country with the most East Asians, India is the country with the most dark Caucasoids, Nigeria is the country with the most Congoids, Germany is the country with the most Whites, not counting Russia because it’s not fully in Europe. If there was no good data in the country, I settled for the country with the second most people of a given race.
The reason I limited myself to one country per race is that it made it easier to correct the IQs for malnutrition to get the estimated genetic IQ since there are precise estimates of stunting rates in different countries.
Phenotypic IQ
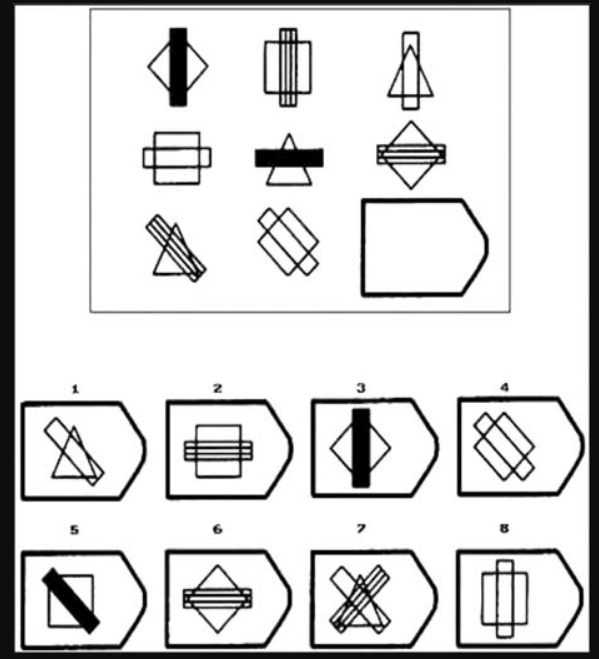
Phenotypic IQ is just one’s score on a an intelligence test that is arguably valid for the person taking it. In other words, phenotypic IQ is just IQ. All IQs are expressed relatives to the norms of whites in countries like Britain, the U.S. and Australia (or something approximating them). I chose the Raven Progressive Matrices (or Wechsler Matrix reasoning) as the most appropriate test because it’s been taken by roughly all 10 races, and is much less culture loaded than most IQ tests. The test is designed to minimize acquired knowledge and emphasize abstract reasoning, so a typical item has you pick which of the 8 choices at the bottom completes the pattern.
There is still some very subtle cultural bias which is why Dutch young adults reportedly gained 7 IQ points a decade for several decades but as Richard Lynn has argued (correctly in my opinion) such suspiciously huge Flynn effects largely vanish when you move from adults to school children where the effect of schooling is largely controlled, and the only gains you see are about 2 points a decade which is small enough to be explained by a genuine rise in biological intelligence (consistent with biological gains caused by nutrition that Lynn noted in other traits like height and brain size over the 20th century). How exactly schooling affects a test designed for even illiterates is unclear but the preponderance of evidence suggests that it does.
For this reason I limited myself whenever possible to IQ scores of school children (age 6 to 15) and from about 1980 to seldom after 2015 (since my main source was Lynn 2015). Prior to 1980 it was hard to analyze the effects of malnutrition because stunting data was scarce.
Another reason matrix tests were chosen is they’re a relatively pure measure of the general factor of intelligence (g). That’s not to say it’s a great test of g but rather it’s to say that it’s not especially biased to verbal or crystalized ability (which favors Jews) or spatial ability (which favors East Asians) or any other broadly defined ability tilt. It does have some spatial loading but it’s small enough that recent editions of the Wechsler scales exclude it from their spatial index score and instead classify it as “fluid reasoning” which many believe is g itself.
Genetic IQ
Just as the Flynn effect proved people got smarter when born in 1990 instead of 1890, people also get smarter when born in a a First World county vs the Third World. This is because as Lynn noted, suboptimum nutrition (including disease which prevents nutrients from being used) suppresses both IQ and height.
Thus genetic IQ is defined here as the IQ one would have if reared with first World nutrition.
Preschool children who are in the bottom 2% of the height distribution of well nourished populations are considered stunted. In rich countries like Germany, about 2% of pre-school kids are stunted but in say Nigeria, 43% were (more details in the chart below).
Thus to calculate the genetic IQ of Nigerians (and other groups afflicted by stunting), I noted that 43rd percentile of their early childhood height distribution matches the 2nd percentile of a well nourished population which implies a 1.8 standard deviation (SD) gap in height caused virtually entirely by nutrition (genetic effects are minimal in preschool kids and studies show that all the most populous races have identical early childhood height potential).
If malnutritioned stunted early childhood height by 1.8 SD, it perhaps did likewise to the developing brain and since brain size correlates close to 0.4 with IQ (Gignac & Bates, 2017) we’d expect Nigerian IQs to be stunted by 0.4(1.8 SD) = 0.72 SD or 11 IQ points. Thus Nigerian school kids average 70 on Raven IQ tests but their genetic IQ might be expected to average 81, which is almost as high as black American school kids score (which makes sense because black Americans are a well nourished sample of the same race).
Vincent 1991 reported three studies of Raven black-white IQ gaps in school kids the United States of 14, 18, and 7 points respectively. Averaging them suggests a gap of 13 points. But assuming that the white SD is only about three percent smaller than the U.S. SD, using the white SD instead of the U.S. SD does not increase the gap, so on a scale where whites average 100 (SD = 15), U.S. blacks average 87. Given that black Americans are 74% black on average, blacks who are 100% black (like those in Nigeria) should average 13/0.74 = 18 points below the white mean and thus average 82.
When we apply my method to Indians we get similarly plausible results. For example, the seven Raven IQ studies of Indian school kids Lynn (2015) cited showed a mean of 82 and the studies had a mean publication year of 1994. In the 1980s (when the kids in the average of these studies were under five), India’s stunting rate was an astonishing 66%. Since, the expected stunting rate if all the mainstream races were well nourished is only 2%, their developing bodies (and presumably their brains) were 2.46 SD below their genetic potential, and since brain size correlates perhaps 0.4 with IQ, their IQs are 2.46 SD(0.4) = 0.98 SD (15 points) below their genetic potential, suggesting their genetic IQ is 97. Lynn (2015) cited a most remarkable study by Mackintosh et al,, (1985) showing Indian school kids with fewer than four years of schooling in Britain had a mean non-verbal IQ of 83 (virtually identical to the mean in India) but those with over four years residence had a mean IQ of 97 (born with First World nutrition?). Assuming this study was not miscited, it further validates my method.
| Raven/Matrix IQs of each race | Psychometric sources | Sources for stunting data |
Pacific Islanders  Phenotypic: 98 Genetic: 98 Phenotypic: 98 Genetic: 98 | Dudley et al. (2022) found Maori 16-20 year-olds averaged a raw score of 19.08 on the Matrix reasoning subtest of the WAIS-IV which equates to a scaled score of 10. Since Canadians have about the same IQ distribution as whites in the U.S., I used them as the reference population, and since their WAIS-IV Matrix reasoning mean and SD is 10.4 and 2.9 respectively, an IQ of 98 is assigned. | Inwood (2016) noted that amoung those born since 1980, natives and white New Zealanders have the same height suggesting Maori in this study reached their genetic potential so no need to adjust their IQs for nutrition |
Whites  Phenotypic: 100 Genetic: 100 Phenotypic: 100 Genetic: 100 | The mean of five German studies of school kids cited by Lynn (2015) | First World nutrition; no adjustment needed |
Congoids  Phenotypic: 70 Genetic: 81 Phenotypic: 70 Genetic: 81 | The mean of three Nigerian studies of school kids cited by Lynn (2015). Mean publication year: 2000 | Nigeria Demographic and Health Survey (NDHS) 1990 found 43% stunting. |
Dark Caucasoids  Phenotypic: 82 Genetic: 97 Phenotypic: 82 Genetic: 97 | Lynn (2015) cites seven studies of school kids from India. Mean publication year: 1994 | In the 1980s (when the kids in the average of these studies were under five), India’s stunting rate was 66% |
Southeast Asians  Phenotypic: 87 Genetic: 99 Phenotypic: 87 Genetic: 99 | One 1998 Indonesian study of school kids cited in Lynn (2015) | According to Indonesia Family Life Survey (IFLS) Wave 1 (1993), about 51% of Indonesian children aged 2.0–4.9 were stunted |
East Asians  Phenotypic: 104 Genetic: 108 Phenotypic: 104 Genetic: 108 | Lynn (2015) cites three Chinese studies of school kids with a mean year of 1995 | the stunting rate in China circa 1990 was 33% (figure 5.2), However if the sample was drawn overwhelmingly from the cities, which seems likely, then the 9.4% stunting rate for urban areas might be more appropriate |
Arctic people  Phenotypic: 80 Genetic: 94 Phenotypic: 80 Genetic: 94 | One 2014 Russian study of school kids cited in Lynn (2015) | In 1995, 61% of Evenki kids were stunted (Leonard et al., 2002) |
Native Americans  Phenotypic: 87 Genetic: 97 Phenotypic: 87 Genetic: 97 | One 1995 study in Peru cited by Lynn (2015) | In 1990, the stunting rate in Peru was 37% |
Australoids  Phenotypic: 85 Genetic: 91 Phenotypic: 85 Genetic: 91 | Chaffey et al., ~2002–2003 tested 79 Aboriginal children in Years 3–5 (roughly ages 8–11) from rural schools in northern New South Wales and found their average raw score was at the 27th percentile on Australian norms (table 2). Although the Australian norms were from 1989, Cotton et al. (2005) found the Raven Flynn effect in children has been nil since 1975 & Flynn (2009) found similar results in Britain. The 27th percentile equates to an IQ of 91, but since Australian norms might be 1 point below white norms, an IQ of 90 is assumed. But because a study by McEvoy et al. (2010) found Australian aboriginals average only 66% aboriginal ancestry (see figure 4) being 10 points below IQ 100 becomes 15 points below 100 in a “pure” sample in the same environment, so 85 | Ruben and Walker (1995) found stunting rates (only stunted + stunted & wasted) in rural Australian aboriginals to be 23% in a hospital sample which implied a minimum of 8% (since only about a third were hospitalized). Splitting the difference between the maximum estimate which assumes the hospitalized have the same stunting rates as all Australian aboriginals and the minimum estimate (assuming only hospitalized Australoids are srunted) gives an estimate of 16% |
Capoids  Phenotypic: 77 Genetic: 85 Phenotypic: 77 Genetic: 85 | A study by Owen (1992) reported Raven scores in South Africa with huge samples of Whites, Indians, Coloureds, and Congoids. Many sources misreport their IQs but my careful analysis found these to be 98, 92, 82, and 69 respectively. Because Indians and Congoids in South Africa score 5 and 12 points below their genetic potential respectively, I estimated Coloureds, who have living standards intermediate between these two likely also underdeveloped to an intermediate degree, implying their genetic IQ is 8 points above 82. In other words 90. Lankheet et al., (2025) reviews studies of Coloureds (mostly from Cape Town) and from the range mid-points made to add to 100%, their ancestry appears to be 30% Capoid, 28% Congoid, 14% Asian (South and Southeast) and 28% White. As we saw above, the latter three have mean genetic IQs of 81, about 98 and 100 respectively so for Coloureds to average a genetic IQ of 90, Capoids must average one of 85. Since their genetic IQ is 5 points below the Coloured genetic IQ, the subset of “Coloureds” who are pure Capoid likely average 5 points below the Coloured phenotypic IQ too, hence phenotypic IQ of 77 | Can’t be directly measured because Capoids (including hybridized Capoids like Coloureds) are too genetically distinct to attribute extreme short stature to malnutrition (even before age five when environment dominates) but in South Africa they were likely less nourished than Indians but more nourished than Congoids |
 Pumpkin Person
Nov 2016 I scored 115 on the WAIS-4 ravens. Supposedly I was stunted because I took growth hormones when in 5th grade. I am 5’7″ as an adult. (the average is 5’10”) I have a picture on my wall of me as a baby. (sent you an email pp)
These groups of people seem to all have head size and height as proxies for IQ? Genetic IQ still has much to do with head size right pumpkin?
Fluid reasoning (g) is the ability to track many abstract variables at once.
Abstraction is just that which you do by noticing relationships in the environment in a causal way. Because then you can manipulate your environment by knowing what interactions can happen and select the ones you think will get you what you want.
This has to do with executive function as well. EF is better measured by fluid IQ than spatial or verbal. Those you can have well also having low EF. One can see in shapes fit in space and talk good without necessarily understanding ordering of things and events.
EF = planning in real time in complex environments (adaption?)
Pill asked about Chris Langan
It is that he is seen in the same way as Rupert Sheldrake who wrote the Science Delusion.
A quack.
It is not that they are wrong 100% – pseudoscience is never wrong, it is “not even wrong”.
water pixies don’t exist because water cannot hold its shape under pressure. but its implied that is what the human body is doing.
the term he does not understand is called cybernetics.
cybernetics has the math to explain it.
but Rupert resorts to calling science stupid so was banned from future TED talks.
No math = not science = water pixies and fancy words
Ask Chris Langan how things work he says God then fancy words.
ok
but that is not going to help you do experiments.
a quarts crystal is not a laser
it do not do anything because they just do not
but people use crystals to meditate, totally unnecessary
Sound, light, vibration, frequency, resonance, synchrony.
they have a place but are not water pixies
science has high standards
Im 99% certain chris is a lot more intelligent and neurotypical than you. I think the mainstream science is quack science more than Chris.
who said he was not intelligent?
I agree that Dark matter and Dark energy is something people don’t understand because mainstream scientist are not smart enough to know it does not exist.
But you have to understand that Chris has no math’s just concepts behind what he says.
Those concepts make sense (conspansion as such)
He just needs more equations or no one will take him seriously.
They are distinct things. A scientist attempts to make a model of some phenomenon which will be useful, but that does not mean that it captures all that there is to the phenomenon.
Some would say that the theories of physics completely describe our world, that because of their usefulness in prediction and description, what else is there besides physics.
But those theories say nothing about mind and yet, here we are. It is not merely a matter of complexity because the theories do not discuss mind at all.
But it is not all or nothing. Scientific theories and mathematical models genuinely describe aspects of nature, but they do not encompass everything.
A good description of how it is that the methodology of science can be true in its own domain, but not grasp everything is in C.S. Lewis’s essay Transposition.
Correct me if I’m wrong, but your formula here seems to assume that the stunted height will be 1:1 with stunted brain size?
Wouldn’t it make more sense to multiple by the correlation between brain size and height?
Correct me if I’m wrong, but your formula here seems to assume that the stunted height will be 1:1 with stunted brain size?
Correct
Wouldn’t it make more sense to multiple by the correlation between brain size and height?
If your hypothesis is that brain size deprivation is caused by height deprivation, then yes it would make sense to multiply by the height vs brain size correlation, or at least the causal component there of, but my hypothesis is that both the brain size and height deprivation are both independent expressions of malnutrition so both are a dependent variable.
On the other hand I do believe the IQ suppression is downstream from brain size suppression so in that case I multiply.
What is the criteria for stuntedness?
What proposition of IQ is reduced by it and why?
What about 50 or 100 years ago in the West?
The criteria is you must be shorter than 98% of well-nourished people your age and sex. Before age five the well nourished people in all major races (not counting fringe groups like Bushmen and pygmies) have the same height so it serves as a good measure of malnutrition at the population level.
Don’t know the stats in the West 100 years ago but could probably estimate it if I had more free time. Relatively high by today’s standards.
My mom is average female height 5’4″
But my sister is 5’7″ same as me but I am male
They said I was short as a kid for my age.
115 raven – 85 height (SD 3″) = 30 points
0.4(2) * 15 = 12 points as the estimate I think bellow my potential ravens score?
I might have even been taller than average, don’t know, I was in the school lunch programs.
if you’re so malnourished, how did your sister escape it?
my mom told me when she was pregnant with me she was homeless. our dad hit the boys not her.
my siter is the third child and my mom said she wanted a girl not a boy at first – its a bias to better care for her
so many reasons – we always took care of her and she was around relatives like that more often, ate more
(also it could be random fluctuations in genes)
(my sister is extremely extraverted, did drugs at one time in her life, likes to party, quite high school but has a GED)
I see what you’re saying, but are they really independent? I imagine the decrease in brain size and height from malnutrition is due to the same underlying mechanism, so they would typically coincide.
Also, you’re probably better off just finding the effect of malnutrition on brain volume itself rather than proxying from height. Here’s one study I found that could be useful. https://journals.plos.org/plosone/article?id=10.1371%2Fjournal.pone.0306500
From what I can tell, the brain-volume effect from persistent stunting looks real but smaller than what your method seems to imply. So, weirdly coming from me, I think your correction may be overestimating the adjusted scores rather than underestimating them.
I see what you’re saying, but are they really independent? I imagine the decrease in brain size and height from malnutrition is due to the same underlying mechanism, so they would typically coincide.
What I meant by independent in this context was a malnourished person’s brain is not small because malnutrition impaired their height, it’s small because malnutrition impaired their brain size directly.
From what I can tell, the brain-volume effect from persistent stunting looks real but smaller than what your method seems to imply.
That’s cause those kids are SELECTED for height stunting, so they’d regress to the mean on a different measure of malnutrition (brain stunting). Similarly, if we identified malnutrition by brain stunting, we’d find they regress to the mean in height stunting. Remember, we’re not interested in knowing how much brain stunting occurs in height stunted kids, we’re interested in knowing how much brain stunting occurs in a population with a lot of height stunted kids. The logic is if nutrition did this much damage to height, perhaps it did similar damage to brain size but that doesn’t mean the brain size stunted kids and height stunted kids are always the same kids.
It makes sense that what malnourishment does to body height malnourishment also does to brain size by the same amount.
Yet we can also infer other things:
Malnourishment does not need to shrink the brain.
It just needs to delay development in all sorts of ways that it does. A brain can be big and malnourished.
Just like dehydration can lower IQ score, or sleep depravation or stress. Over extended periods of time lack of nutrients can effect IQ
A brain without what it needs changes to fit what it lacks by growing slower and with less complex neural density. It grows by what it learned which is to conserve energy.
It seems that the Australoid group according to pp has a genetic IQ of 91?
They have been in Australia 65 thousand years yet did not invent farming? Is Australia a good place to farm? I heard an IQ of 90 is required.
This also means they existed before Caucasoids mixed with neanderthal?
So Australoid existed when “whites” were still “black” and still in Africa?
But Papuan New Guineans who are also Australoid are one of the few races to independently invent farming, and Neanderthal admixture happened before Australoids diverged so they have it too.
Would that not be Denisovans or homo Florence?
Several groups beside neanderthal?
I am still confused about the ghost DNA in west africa.
I cannot find good maps of the splits.
I now understand about the farming but how extensive was it?
Bigger Brain = can wrap you mind around things
literally because on the ravens test you see all the parts and deduce the pattern
you fit them together by seeing it
the brain then wraps around things with its folds
what could that mean?
maybe an objective way to measure IQ not relative to some mean population?
Like how the raven bird can use tools?
or a dog can understand tricks?
it be super interesting to know what a cat IQ is?
might have to do with balance
indeed: controlling ones emotions makes you able to wrap your mind around many things at once instead of distractions that move you off center.
Those big brained celebrities may be focused in a balanced way to see everything at once. Its how they know how to direct there movies with big picture thinking to make decisions.
Sometimes I can hyper focus but I need to expand that to take in more at the same time. This would allow me to think bigger thought also.
I found that my body mass index changed age 18 to age 38
I was the 9th percentile when 18 (120 pounds 5’7″)
Now I am at the 95th percentile when 38 (160 pounds 5’7″)
Not because of fat but I have high muscle mass. I only get to eat twice a day. Its been this way for me since I was 18 (low on cash) – I agree you’d be better off just calculating malnutrition than brain/body size.
What are the PGS of the different groups for height?
That be a better proxy?
Brain size and body size keep the same ratio if you account for PGS and so its better to see how nutrient deficiency effects brain function. If a brain has poor nutrients then no matter the size the correlation be lower.
Another thing is my head size ratio to body may be bigger than average.
Did you look at the photo I sent you pumpkin?
actually (160 pounds 5’7″) is the 85th percentile
my mistake
This is odd
Depending on the number of people in each group the Standard deviation of the world population if we keep the mean at 100 would reduce from 15 to 14 or 13 or lower because previous curves were based on low scores for each “race”. This means that the spread is more compact near the middle of the curve. It really depends on what numbers of people in each group has as they add together. 108 for east Asians a group with more than a billion people was unexpected by me. People in India if at 97 reduces the standard deviation all on its own.
No functional adult human being can be below IQ 20 (2.5 years old ability)
A Standard deviation of 13 with 8 billion people has no one bellow 20 and no one above 180 – IQ 20 must represent a threshold then for absolute IQ of hominids.
Given that the SD is 13 not 15 we’d expect certain tests to show absolute scores where more people are in the middle. But this require testing all the population of earth to confirm it.
A fat tail curve is possible but then we would need to include babies to fill up the first parts of the curve to increase the Standard Deviation back to 15 or 16
Where on earth are you getting 13 from?
I made a bell curve in excel with the SD of 13 and it fits the data under the curve of 8 billion people where no one is above 180 and no one is bellow 20
That’s your own definition of IQ. The most common modern definition defines the mean and SD of either the entire U.S. or Britain (or the just the whites in either country) as 100 and 15 or 16 respectively, and forces the results to a bellish curve, at least between 50 and 150. The entire World would have a mean below and 100 and an SD larger than 15 and a less bellish curve.
According the the curve with SD 15 there would be 460 people bellow IQ 20 at a population of 8 billion and that means they have the same IQ as Coco the gorilla.
These people would not function in society or the wild.
You could say they exist maybe but I have no idea where you find them. They probably be all the feral child people around the world in total.
It is not that I define IQ
It is that I have trouble thinking of people bellow IQ 20 existing.
The idea pp that they are all the feral children makes sense somewhat but only barely to me in my mind.
And forcing the results to a curve to me also is problematic because the raw numbers should tell us exactly what curve shape is without forcing it, if everyone was tested accurately. (future gene testing might do this)
“That’s your own definition of IQ” – see the arbitrariness of IQ now? What justifies the usage of one SD over another? There is no justification. There is no unit of IQ, IQists agree amongst themselves what the SD is.
The IQ scale is arbitrary—a mere human convention with no natural, intrinsic, metric. In the specific sense that there is no natural, non-arbitrary unit or scale for “intelligence” itself, any numerical score assigned to cognitive performance can only reflect the accumulation and application of learned content and culturally-transmitted problem-solving methods, rather than a direct measurement of some independent, scale-independent “thing.” Thus, IQ tests are just knowledge tests. Thus, IQ tests are culture-bound and tests of a certain kind of knowledge. QED.
Forget the tests being involved.
A distribution of intelligence exists whether it fits a curve or does not.
intelligence exists without the tests
SO you put aborigines at 97 and blacks at 81. And left out jews completely. And youre going to think people that would even google ‘race and IQ’ would fall for it?
This isn’t the 1990s puppy. Weve all lived through this story.
91 not 97. Indians are 97
Aborigines are not even in the 80s or 70s. And then you jacked up blacks into the 80s based on harvey weinstein documentaries.
Get your head out of your ass and do science for once. Just 1 day. Can you do it for one day and then you can go back to your evil religion.
“harvey weinstein documentaries”
what the hell are you talking about?
even if pp watched such things what’s that got to do with anything.
You don’t believe stunting lowers IQ?
pp explained genetic IQ is not phenotype IQ
There’s no such thing as “generic IQ” and there is only phenotypic IQ.
If a genetic IQ existed (a pure, direct measure of innate genetic intelligence), then it would be measurable using a natural, non-arbitrary unit that directly quantifies genetic potential without a dependence on arbitrary scale choices, learned content, cultural exposure, education, test-specific conditions. But no such natural, non-arbitrary unit or direct measurement exists—the IQ scale is arbitrary (chosen mean and SD), scores always reflect performance on specific tasks that require acquired knowledge, reasoning strategies, and environmental inputs, and all observed variation is phenotypic.
So there is no such thing as “genetic IQ.”
“But heritability estimates!”—the way hereditarians use heritability is either affirming the consequent or only valid if heritability measures genetic determination (it doesn’t—there’s the heritability fallacy that hereditarians love committing). Therefore, IQ is arbitrary and there is no such thing as “genetic IQ.”
Stunting lowers intelligence.
You can deny that if you wish but it does.
This list might even be less believable than that time you quoted ben shapiros website saying americans loved obama more than jesus.
Obama has more U.S. worshippers than Jesus at this particular time according to my polling. Don’t blame me.
Your fake news polling
No just used survey monkey. Asked a sample of Americans to name the 3 people they considered heroes and at the end of 2025, more people spontaneously named Obama than named Jesus. Don’t blame me. He’s not my hero. Now in fairness, survey monkey is not the gold standard of polling but was all I was willing to spend money on
So you admit to having a rubbish sample and driving an ideological conclusion. Interesting. Usually you polling people are supposed to keep pretending its ‘scientific’. Interesting, the shame and guilt brought you to this place.
a poll is a sample
that doesn’t tell you anything about “Ideology” in the sense pill means. its not a political poll
it just tells you something about statistics if anything
So I was looking at celeb gossip and the list of ‘Hollywood It Girls’ was 50% black women.
???
Its getting worse and worse. The eskimos think they have complete control of peoples minds.
Not even Oprah thinks 50% of the most famous hollywood actresses are black.
Yeah it used to be for a black to make it in show business they had to be a truly spectacular talent like Oprah or Michael Jackson.
WHy do you keep saying Oprah had ‘spectacular talent’. Nobody believes that. Not even blacks believe that.
You must be the most ideological person on the entire internet.
Tons of people think she’s spectacularly talented. Not so much at interviewing but in connecting to people, especially at her prime. No other living person has been so worshipped for so long, unless they had the power of the Presidency behind them. All Oprah had was her personality. She didn’t sing or dance or play sports, wasn’t beautiful, didn’t command an army, wasn’t selected by the Ivy League gatekeepers, and still she was Queen of the World for decades because she could touch people’s hearts. She was a light in an otherwise dark world:
Ill tell you who is BLACK woman you should admire and is more famous and talented and smarter.
Candace Owens. And she will make 2% of Oprah’s income. And thats the price you for being noble.
Oprah has said nothing about Gaza. Because she fears her boss. Even though the disgusting jew is in a prison cell.
Neither has a boss but Oprah’s an óld lady now & no longer relevant. Back when she was relevant she was the loudest voice against Iraq war & Afghanistan war & elected Obama who gave us Iran deal though your guy who actually does have a boss ripped it up
Candace is very bright but Oprah is BRILlIANT & had far bigger brain size, income & following
Oprah inspired & paved the way for Candace who stands on her shoulders
Candace is the women wished she could have been without being a servile cretin to get hollywood access.
Completely independent of zio media.
If you can’t see the massive IQ difference just from listening to them both, we need to get Marsha back to do a one off tie breaker.
How is being the loudest voice against Iraq war and Afghanistan war before they began & electing a muslim servile? Yes Candace is extremely outspoken but much easier to be today. If she tried that in Oprah’s day she’d be swinging from a tree
Oprah’s IQ is much higher though Candace is at least 120
Income and following is not related to telling the truth in media dumbass. Wow 25 years after 9-11 and still talking like a boomer.
But it is related to IQ and talent. Integrity is another matter
Since most tests are normed on samples where the questions are selected based on the ones the higher level people have trouble solving, I have comes to the conclusion that most tests do not know how to select hard questions properly. The SAT is only math questions and vocab questions. This is a lower dimension of specialist of Intelligence.
As intelligence increases it happens at a geometrical rate. The problems people can solve at high levels will never be on tests even power tests. To make hard questions there is a combinatorial explosion of ways to solve them because the number of solutions increases as with the complexity of the problem not yet known on any test.
There is not one answer to certain problems but many. This means more samples need to be taken than can possibly be taken to norm a hard test. A test would need to search a million problems to find the “hard ones” which a machine cannot do and even a large group of people cannot do.
Antithetical to the optimal number of dimensions for understanding data is the problem of increased dimension and data sparsity. You sample in higher spaces you get less meaningful results. Because the results are not always correlated. It is this then IQ has no way of solving. At least not on the paper tests.
(“A fishermen was taking samples of a pond. His assistant asked how many fish he had caught smaller than an inch. He said none, the net holes are two inches wide.”)
You just outright stated how IQ is arbitrary. The fact that you, rightly, stated how the tests are constructed shows how they are culture-bound. You most likely see no issue with that, though.
It is only arbitrary at the high end where the really smart people are at. It is very easy to tell if a person is average intelligence within a certain limit.
Your focus is on tests not having any validity at all because you do not accept fluid intelligence as existing. It has to do with what a person can hold in perception.
It is very easy to see what the average person can do in fluid intelligence. And this can be shown with math.
There are reasons intelligence exist but in the past you have not debated honestly so I expect you wont here either.
The average of all the tests I took by you pp is 111
I plotted the variance of each test from the average:
The middle of the slope is 116
I think Robert is dead or in some sort of Gulag in central america.
RIP
If youre right, and I think you are. Then God is waiting for you.
When I said the polling companies where Likkud, Puppy lost his temper.
Well, here we are and Likkud is openly rigging polls and we can just drop this stupid pretence. Its brainwashing. Wake up. Wake up.
You do not need to rig polls
polls have always been inacurate
because of the empirical math behind it
conspiracy theory BS need not be involved.
If Likkud were rigging the polls, they wouldn’t show 60% of Americans now dislike Israel:
https://www.pewresearch.org/short-reads/2026/04/07/negative-views-of-israel-netanyahu-continue-to-rise-among-americans-especially-young-people/
There is propaganda in polling but it’s more about what polls they decide to do, how they word the questions and what poll results the media will cover or ignore. Outright rigging is relatively rare and anyone with the power to rig reputable polls is also powerful enough to shape the very public opinion an accurate poll would reflect.
Gallup realeased a poll saying 78% of americans want illegals to be made legal. Case closed.
You’re exaggerating obviously
When conducting a national poll you need 1,000 people to determine accurately what they believe (depending on the question asked).
If you poll 100 people SD 15 your margined of error is around 3% with confidence of 95% – this means you would never tell who got to the top of a poll exactly because you can add or subtract 3 votes to anyone at a national level.
At a global level we do not know how this would work. Everyone most likely in China vote for a Chinese person. So you would not get 1 person at top but more like 8 or 16 people but you cannot survey the whole globe just local parts of it. (a popular vote means more people in China wins but this is dependent of samples given so still would not workout)
I finally understand why people dislike Daniel Dennett. Daniel Dennett is the worst case of post modernism I have seen in a long time. I am reading a book mentioning him and what he believes is atrocious. He thinks consciousnesses is only narrative, that it is just words. That there is no raw experience of anything just descriptions.
In Buddhism it is the opposite, words are the illusion not consciousness. Consciousness is in Buddhism raw experience and the awareness behind such things.
Dennett in my view rejects any sense of objectivity, not by accepting subjectivity but by making everything relative in the pejorative sense. You can say anything about anything in a “narrative” so it does not have to be true. Purple or red or blue or yellow does not exist to Dennett because those are just words and have no reality. Stupid word games again.
So to me stuff is real without words even if you need words to communicate we still as individuals have raw experiences separate from words. Its not relative fake or illusion. Word games are the illusion.
One time when walking home in the dark a bat squeaked at me. I heard its sounds at the base of my brain stem. Thomas Nagel asked the question what is it like to be a bat. Since I felt the sound in me I imagine the bat experiences sound in a similar way. That is to say in the entire body of itself like a dolphin has clicks in the water. The vibrations were intense and I felt that sound in my spine. Sound then in the nervous system is different from in the head. These are more than words, animals do have minds. They just use sound in a different way like whale songs.
YEah Chris called Dennet a clown. And dawkins in denial. I would pay a lot of money to hear what Chris would say about Samual Harris-stein. And whether he thinks Sam is religious or not. And if so. Which religion.
The people behind TED talks are those people in the range between Mensa and Triple Nine Society (130 to 147) This seems like it is optimum for that level of production and presentation to the general public. Not high quality all the time but they had good stuff at one point. The target audience has shifted downward to the middle.
As an example they had oblong industries a visualization interface company on TED in 2010 – But after 2012 the videos seemed to be less impressive on the TED website. I have not been to it recently but I lost interest because of mediocre videos.
I Just looked at TED feed and most of the videos are self help talks.
I am pretty sure cool things exist but not on TED
On my side of Google searching for images is not always interesting. They have generic content not cool science stuff, it all looks the same.
And searching for valid research papers is harder.
It looks like stuff from ten years ago and no fancy diagrams.
The books are better but not by much because those with diagrams you need to perches and the library near me is limited.
Looking for recent science videos is even harder. You need subscriptions.
What’s the justification for the racial groups you used? Why are Aborigines and PIs separate—the fact that they share ancestry (from the Mcevoy paper) is one tick that they are the same racial group. Why separate “dark Caucasoids” from other “Caucasoids”? Arctic people (and Central/South American Indians) are Native American.
There isn’t much justification. Lynn cited 10 genetic clusters from a PC analysis by cavalli-sforza however when I checked the source it was actually just a phylogenetic tree of arbitrarily chosen groupings and there were 9 of them not 10. Nonetheless the 10 groups Lynn studied have face validity, and cavalli-sforza would not have organized his tree like this unless they weren’t relatively distinct groups, at least based on what was known in 1994.
The standard definition of intelligence is that half of people are bellow average. That is why a distribution exists. Whether or not it is on a curve or if we can find the numbers to it is a sperate issue all together. The main issues is that intelligence exists and some people are more intelligent than others. So to find out what makes this true we need to describe the basis for intelligence. In my view intelligence is about what can be perceived because it has be shown people can vary in how much they can see hear and other cognitive attributes like memory and executive function.
Perception is not about the contents of what one has learned (knowledge) but about having the range of understanding how to learn. Some people are called super taskers because they can get multiple things done at the same time and this means they must be able to perceive multiple things and order them in a prioritized manner. This then would be the basis for intelligence and it would be measurable what people can do. We can measure what people perceive and what they can get done. This may look like a bell curve or it may not but it would show people can be different in intelligence levels.
This would not be all inclusive but it be within the average range more than 99% of people.
(Larry the cable guy says: get er done)
Peter taking an IQ Test
I asked google about bilateral spatial intelligence.
It told me that since I take a wide view of things I may have trouble with seeing details and textures along with being poor at arithmetic because the white matter grew in such a way as to diminish areas of the brain required for them.
That is to say I focused on directing my attention not on looking at stuff and not on numbers but on manipulation of objects and this made the myelination and grey matter thicker in some areas but not others.
This is why uneven development can make people good at some things and not others. Some people focus only at looking at stuff or only at numbers. I was spatial oriented mostly and some people are verbally orientated but these can subdivide into more categories.
being a secretary data entry person is something I cannot do.
reading fast is something I cannot do either
or drawing or writing books
but all these are measurable
perception is the basis of intelligence it is only how it is distributed in the person that tells you what they can do.
People do not understand how the United States works.
It has a Federalized Government not a Centralized government.
Power is not concentrated at the top it is distributed in layers.
That way no one can seize power absolutely.
And the power at the top is split into balances of power the three branches.
In the United States we have the constitution which are the laws that tell us what our rights are and what the government can and cannot do. This protects the people from abuse and allows them freedoms. It is based on the rule of law. You don’t get those in dictatorships.
Communism Marxism or whatever never can work because it has no plan of how to form a government. So when people try to implement it it falls into dictatorship of centralized control. There are no basic rights for people in it. The workers are said to be in charge but the ends quickly. The dictator to control the population spreads lies (propaganda) to keep power. People then stop trusting the system. It is not representational meaning the people do not choose the leaders. The economy goes in the toilet because only the few people at the top have money. Even if in communism it says the workers control the money supply in reality they don’t. The surplus goes to the dictator class. The middle class is completely gone. And everyone lives in fear of the dictator.
Basically if you are a communist in America you want to kill everyone to set up a dictatorship not help the poor because that is what would ultimately happen. This is why communists are in the intelligentsia not the working class. They want to lead the revolts to mass kill people because they feel unappreciated at their jobs. Working class people mostly like their jobs and don’t read Marx because they did not go to college. This is ironic since everyone in Cambodia with glasses were killed which is what would happen here if not for the constitution being in place. Voting rights prevents all of that.
I was thinking about it and Ben Shapiro might literally, physically be my polar opposite in mind, body and spirit. Im not joking.
If I listed a genre of music that was my favourite. My guess is that Ben would say….he doesn’t listen to music at all.
The high rate of schizophrenia in Ashkenaz1s might be ironically reflected in Shapiro’s aphorism, “facts don’t care about your feelings”. Since he wants to abandon it when it comes to anything related to j*ws and judaism, and presumably cancellation and abuse of his Gentile employees and the Gentile people he markets to.
That must cause a lot of cognitive dissonance.
??? I can think of a certain neurodivergence that ashkenazim get in great numbers,
And the primordial fire wouldn’t even be in the top 5 of phenotypes they get.
I censored myself because I thought wordpress wasn’t letting me post due to some no-no word, but it was a cache error and I needed to refresh or something, I think.
Well music to him would be the screams of the children of Gaza.
IQ tests are a very shallow way of measuring how one uses their cognitive resources. Its paper and pencil not a brain scan. If the brain is wired up differently to facilitate different skills or perceptions how would we know? It misses too much to be accurate most times.
I am not saying the tests are arbitrary. (the cowards way out)
The 25% it does capture is highly efficient at being measured, the rest is not being understood at all?
How you get a brain wired up for intelligence is all I want to know?
I need more information on the P-FIT model of intelligence.
If intelligence is going to be reduced to one number (IQ) the what is the relationship of P-FIT to that number.
This may need dimensional reduction techniques such as principle component analysis (PCA) if P-FIT is doing lots of things at the same time we cannot display in 3 dimentions.
The whole point of no pure definition of intelligence existing has to do with this high dimensional field where people can do many things at once. To quantify this we need dimensional reduction and comparison.
At one point in time Facebook was doing this with network analysis.
Standardizing complexity is a big math problem but they had the data on many people to do so and still might be doing so. They were finding the correlations most associated with high intelligence in the data but not with the P-FIT model.
I do not have money right now but I do wish to buy Dr. Haier second book (2021)
Uttal refuted the neuro-reduction of models like P-FIT. Uttal showed the methodological and conceptual issues with such studies. Haier is a charlatan who, unbeknownst to him, refuted the concept of IQ since he admitted that there is no unit for IQ (in his 2014 paper). Psychological traits are non-quantitative.
^says they guy who posted a twitter on how SES matters to brains organization of intelligence.
so brains do make up ones intelligence after all lol
your contradictions are sad
None of this refuted the argument I made.
Wouldn’t the unit just be the ratio of mental age to chronological age since that’s how IQ was originally calculated?
Post this one.
Is MA a physical quantity or magnitude? How is the MA/CA ratio not ciecular, since MA depends on test construction and norms? What’s the lawful relation between the “measured” property and the instrument?
Ultimately, the old way is just a scaling convention for ranking test performance adjusted for age, not a measurement unit grounded in a quantifiable attribute. All psychology is is assigning numerals without the ontological and epistemological foundations of true metrication.
brain organization can be quantified
why not?
pp
if age ratio IQ were used:
A gaussian distribution with 8 billion cannot go past 195 IQ
228 as example made Marilyn Vos Savant age 22 by age 10 and at age 158 by age 79 – this increase is ridicules.
I prefer my system I call token age IQ based on working memory.
A token age of 22 is IQ 165 on a gaussian curve
With a working memory of 32 for miss Marilyn
A token age of 13 is IQ 100 working memory 7
https://anime7cat77-cwpyv.wordpress.com/2026/05/05/twice-as-smart/
IBM Watson personality insights was doing something similar to Facebook but in a professional way. It just depends on the data collected and how it is organized. Watson was build on a platform with huge amounts of computation behind it. Just like a PlayStation 5 can do 10 trillion calculations a second but dedicated to data analysis.
They definitely have better algorithms that in 2012 and 2014
This might be used to find out IQ and other things.
You really don’t need huge data centers like what they are building right now. Those waste water we need to grow crops in the future.
A morphic field doesn’t explain anything.
Rupert Sheldrake just does not undertested homeostatic feedback in biology.
Animals or plants or anything biological utilizes energy in a feedback.
DNA is very important but the rest is not happening because of mystical energy fields, biology adapts by small adjustments stabilizing the system.
Now there is energy all over the place and biology does react to it but the memory is not in the “morphic field”. Over millions of years some feedback systems were better at stabilization than others because of subsystems existing. breathing for example or heart beats or body temperature, hunger thirst. All self regulatory and when damage happens it heals itself by the same processes.
By making it seem like self regulation is in some exterior mystical field this does just not correspond to science.
“But.. But.. racism”
No, its well understood what happens in biology.
Genetics is part of self regulation.
I perfectly understand these views and they are wrong.
Other people feel the need to bully people because they don’t want science to explain intelligence the same way it explains anything else.
Thus names like autism come up since politics corrupts people. very sad.
I do not feel I have to accept accusations of racism or autism because of kooky views on morphic fields and people saying I am stupid and “don’t understand”.
I understand and my views are not based on racism or autism.
Science can explain intelligence like anything else.
post modern redefining or words will not change that fact.
neither will politics or bulling people into submission
As anyone knows people are free to do science to the best of their abilities because it is about understadning reality.
therefore what I know cannot be suppressed
because it is real
We need to start talking about reaction norms again.
Stunting is not the only thing that happens to the brain.
The brain is a dynamic system so growth can be effected by so many things. (things that enhance phenotype not just degrade it)
Executive functioning as example: Mark Zuckerberg gave his baby a toy to improve his vision. It was a geometrical object. This baby is going to be way smarter than normal if he grew up poor.
Videogames lower reaction times in people. The Galton reaction times.
Another thing is that kids with food allergy’s or gut problems get sick and cannot do school well. Kids in school: poor people still exist in The Untitled States of America, they still need better foods.
Not only that but we have ways of understanding what foods are best now. Obese people have less intelligence but we can fix this with Vitamins minerals and DNA tests.
Also trauma, two thirds of people in the USA are traumatized. They don’t have Stable attachment styles.
IQ tests always fluctuate by at lest 1 SD every time a person takes it.
That must be taken into account.
other environment things like poison in foods need to be known as well.
diabetes and Alzheimer’s could be cured but lowers IQ
“Videogames lower reaction times in people.” Who said that? Ben Shapiro? Klein? Summers? Esptein? Name.
I agree you had a terrible environment. I totally agree with that.
Gregory Mitchell was a Mind Development researcher and practitioner for over 30 years. Born in 1947, in his early childhood he was strongly influenced by his grandfathers who were both inventors and innovators.
–
screen time is killing intellectual development in young children (gen z and alpha)
Google “reaction time decline this century Galton” and look at the images
I do not know but psychologist could be looking at a sampling error? the selective population you measure matters.
You basically argued in plain english that stunting effects height and the brain in the exact same proportion/momentum, because it derives from the same semantic label.
What a total clanger.
You could literally hear the plates and dishes crashing everywhere in the kitchen.
Semantics have nothing to do with it. Why would nutrients affect the size of the body much more than they’d effect the size of the brain? Seems reasonable to hypothesize that they’d affect both equally.
Because in most people, execept you and the other clowns, the brain takes the most energy to sustain.
Even so, the BLM activist argues in bad faith. He is basically saying the stuning explains why blacks punch people in the head on the bus.
And it does not.
And he knows that deep down and will never say it because…..BEN SHAPIRO!
No I’m saying nutrition explains most of the IQ gap between American blacks and African blacks. It explains perhaps none of the black-white gaps in the United States. Steve Sailer was the first to notice this. And you have Ben Shapiro backwards. He wants racists like you to vilify blacks so they leave his people alone. He gave us Candace Owens because she gave whites permission to criticize blacks but his strategy backfired when she started criticizing Jews
Candace Owns says more truth in 2 sentences then [redacted by pp, on Jason’s birthday, 2026]
The other day he really ‘went there’ and said Obama is more worshipped than Jesus.
Not even democrats believe that. Simple logical reasoning, is that if 45% of people or whatever say they are ‘relatively or strongly religious’ in america.
And, at best 35%-40% identify as democrats. And of those, maybe half name Obama as their icon.
Theres no way to make the numbers work. And thats assuming a clean break between religious people and democrats, which is not actually true. About 20% of dems would be failrty or overtly religious. Particularly the South.
Nothing Gallup, Ben Shapiro or Puppy ever makes sense. Its almost like its desinged to make them look cartoonishly evil or deranged.
More Americans worship Obama than Jesus as of late 2025 and also briefly after he first got elected. I couldn’t care less about either of them but it’s a fact. It was was very emotional for people when Obama became the first black President and because Trump’s been such a disaster, millions miss him greatly. Many blacks have a picture of Obama on their walls.
Chimps can track 30 preditors at the same time.
There working memory is off the charts.
But they have very little human metacognition.
but according to “science” this increases g (by allot)
Scientists say metacognition is not intelligence.
But then this would make batman not very intelligent at all.
This shows intelligence as a scientific concept is, when defined by “scientists”, is too ambiguous to relate to.
Normal people would say batman is intelligent but not “scientists”.
What the fuck is intelligence if batman is not intelligent?
Take away batman’s metacognition all you have is a rich guy at IQ 150
people see batman as a rich playboy as his persona
Yet because batman has metacognition he is 193 in IQ (1 in 6 billion)
The inability to understand intelligence does not change what intelligence is. It simply means people cannot define it.
When you cannot define something you cannot measure it.
Scientist measuring intelligence are limited by their own understanding.
(to many possibilities exist expanding past them so the try and make them smaller which is not going to work higher up)
I could not get an accurate measure of my head size.
I have a picture of me and my mom.
She is 7 inches shorter than me.
proportionately my head is big.
anyway looking at pp’s charts I found out that 1 IQ point = 6.58 cc
–
IQ = (((cranial capacity cubic centimeters) – 1391)/6.58) + 100
or
estimated cranial capacity cubic centimeters =
((IQ – 100) * 6.58) + 1391
This both men and women
The other day he really ‘went there’ and said Obama is more worshipped than Jesus.
Not even democrats believe that. Simple logical reasoning, is that if 45% of people or whatever say they are ‘relatively or strongly religious’ in america.
And, at best 35%-40% identify as democrats. And of those, maybe half name Obama as their icon.
Theres no way to make the numbers work. And thats assuming a clean break between religious people and democrats.
^^^Explain in detail the reasoning issues I may have had here and why the ‘science’ is true. Im actually open to the strange idea Obama is more popular than jesus in your version of america.
Being strongly religious does not automatically translate into worshipping Jesus or Mohammed or even God. You can think Jesus is God or the son of God and still not idolize him enough to think of him when asked to name your heroes which is what the Harris poll measured.
I actually like Obama. But it would still be comical to see Obamas current approval rating……
Among blacks.
Right now.
Not as high as it used to be but would still be very high. The blacks attacking him on social media are a very small percentage of U.S. blacks. There are millions of older and rural blacks especially in the deep South who’ve never been on social media and only know Obama was the first black President and probably still have his picture in their living rooms, often along side Martin Luther King.
Huh? Blacks have photos of obama on their wall? Show me the citation.
Sam Altman went to Sandford University.
But even if he got a perfect SAT score the highest IQ you could infer would be 150 because of modern tests.
The internet thinks he is 170 but I am not sure.
He is a CEO not an inventor.
He did not invent transformers he got the idea from Elon Musk who got it from Google research team.
170 is exceptionally rare.
You don’t need to be that high to run a software company.
but internet people think chatgpt is cool so he must be smart?
And I may be biased since I only get 115 on IQ tests sometimes.
You just cannot trust internet results on peoples IQ
Hes a clinical psychopath. Look what he did to his sister.
Well well well. Looks like I am vindicated—looks like “IQ” really is just… SES/social class. It matters more for brain organization. The brain-IQ associations were better explained by SES confounding. *Cue AK with some irrelevant babble*
https://x.com/i/status/2065151376015908986
Brain organization matters to intelligence?
But you said it was reductionism?
sad
How does that refute my position? What DOES matter is the environment, as this proves. It showed that the brain-IQ associations were just due to SES. What’s that mean for IQ-ism?
if brain organization can be quantified we can compare people.
why not?
Your reductionist assumption is showing here. This is just another way showing that the Vygotskyian framework is a valid one. Thus, IQ is merely SES, as I’ve been arguing for almost 10 years. QED.
^says development happens in brains
^but also calls anime reductionist for saying brain organization is related to development
What a buffoon
I would need to see the study and how old the subjects were. It could be that models trained to predict IQ from brain scans are better at predicting SES because in childhood shared environment plays a big part in IQ but does the result replicate in adulthood where shared environment effects are thought to vanish? Perhaps not
brain plasticity
detriments can last long into adulthood
look up feral children
Language: The First 5 Years of Life of Learning
Sprouts Youtube channel
9 and 10 years old.
Measureable brain differences linked to IQ in these imaging studies are tainted by SES right when shared environment matters most. This therefore weakens claims that neurocortical thickness, volume, connectivity, etc reflect some innate biological efficiency.
AK, even not accounting for the Uttal critiques of these kinds of studies, this is all of the imaging studies you constantly parade around that shows a non-surprising result (environment matters for brain development) and you’re resistant to it.
So so-called brain correlates of IQ just reflect the environment. So IQ is just social class. QED.
^dishonestly cannot distinguish IQ from intelligence.
Makes it look like intelligence is not in the brain (just to contradict me) but also saying development is in the brain (Which is what I said and keep saying for years).
*nutrition raises intelligence
*education raises intelligence
*the brain is effected by SES
*people can be more intelligent than others because of these
yet some people say: brains have nothing to do with intelligence.
And then post a twitter on how brains get organized to be more or less intelligent from poverty.
why?
why would a person contradict themselves all the time?
because if a brain can be more intelligent
then what?
maybe then it can be quantified?
and that is a big no, no, to them
If intelligence can be effected by SES and we can see this in the brain scans then why reject the fact that brains are involved with intelligence?
Because intelligence is too complex to measure?
then just say it
what is this complexity you speak of?
most intelligence tests are testing fluid intelligence
is that too complex to measure?
what is your problem?
why be such an ass hole about it?
I made a chart and it seems that colder a state is in the united states the more IQ points it has.
Correlation is not causation but it does seem that if you are smarter you go places harder to live.
It is harder to get a job when you don’t have a college degree.
but its a sorting mechanism, many exist.
If SES matters people move where they get harder jobs to do by ability.
The granularity of it is low but some people have more data than I do.
My correlation was 0.61 R squared as to temperature and state IQ
You might even find out that this is higher if there were data on local counties in the states and with school districts.
Development happens in the brain because that is where intelligence is
Why not accept this?
because it’s racist?
morphic fields explains intelligence better?
no
people wont accept it because I said it was real
all else is secondary to the bullying
“shut up anime, everything you say is false even if we have to contradict ourselves”
I simple don’t understand it?
must be because someone hurt them long ago
and they need to blame someone who believes intelligence exists
because school told them they were not intelligent?
so intelligence doesn’t exist and they must be against it?
maybe?
I looked up the social deprivation Index
The place I lived as a child had was in the bottom 8% of SES
Not sure what this means?
I do not score 80 on IQ tests.
My dad smoked cigarettes and had a filthy trailer and was abusive so my mom left him.
After that we lived in a clean trailer and had legos and tv and a computer.
But that should not explain everything.
I received $15,000 to go to college but dropped out because I lacked social intelligence like my mom. I couldn’t write the essay. And my mom would not help me. (she might be IQ 80?)
I don’t know. I cannot drive a car. too afraid.
But I have a house to live in and I can walk to the library.
Sometimes I do math. but I have to take medications. lol
I learned about health products.
They help.
And I can feed the dogs I have.
I am just so tired and confused:
A. chemicals don’t have shapes
B. genetic self regulation does not exist
C. Brains have nothing to do with intelligence
D. development doesn’t happen in the brain for intelligence
E. Believes in marxism ideaology
F. Believes in post modern redefining or words
G. Thinks Darwin was wrong on evolution
For what?
Because racism bad?
ok I guess
I disagree on all that but ok I guess.
A. Where did I say that?
B. Where did I say that? That’s a basic tenet of DST.
C. They’re necessary, not sufficient, for psychological kinds.
D. What does this mean?
E. What?
F. What?
G. Yea, natural selection isn’t a mechanism.
A. called me racist and autistic for believing proteins have shapes. which are needed for chemical feedback loops and biological signaling.
B. called feedback loops “anime’s favorite word” and kept saying biological signals had nothing to do with the chemistry because of racism and autism.
C. calls everything I say reductionistic:
you cannot have it both ways: you reject brains as reductism and say development happens in brains.
which is it?
“AK, even not accounting for the Uttal critiques of these kinds of studies, this is all of the imaging studies you constantly parade around that shows a non-surprising result (environment matters for brain development) and you’re resistant to it.”
I don’t “parade them around” you asshole
who the fuck says development is not real: your strawman is stupid. intelligence exists regardless of IQ tests but this doesn’t mean intelligence is not in the brain. you reject 100% intelligence having anything to do with brains because you call it reductionism but then this is a contradiction to development.
D. it means you reject all the above. point A. is just default true (chemical have shapes) point B. biological signals are required for brain development and require chemical reactions (you reject my views on feedback) C. calling intelligence in the brain reductionism does not make it go away. (this is a strawman you keep doing all the god damn time and is contradictory to development)
E. “Daily cultural Marxism posts” was you theme phrase on your blog a long time. you removed it?
E. yes you redefine words all the time just to make your ideas seem correct when they are not. example below:
F. only if you redefine words is natural selection not a mechanism. But it is a mechanism because of how Darwin defines his terms.
Where did I say that? What, specifically, is it about the “protein have shapes” claim am I denying? What does that even mean to your supposed argument?
your context window is too short
I explained everything three years ago
and you were an ass to me about it
Is MA a physical quantity or magnitude? How is the MA/CA ratio not circular, since MA depends on test construction and norms? What’s the lawful relation between the “measured” property and the instrument?
Ultimately, the old way is just a scaling convention for ranking test performance adjusted for age, not a measurement unit grounded in a quantifiable attribute. All psychology is is assigning numerals without the ontological and epistemological foundations of true metrication.
I do not have to “refute” stuff
whatever that means?
I just have to show a better position exists
fairies cannot be “refuted” as example
so its not scientific
but I can show how the ratio of volume to surface area prevents certain body types
arguments against intelligence requiring me to “refute” them are stupid as trying to refute fairies
the alternative is to show how intelligence is possible
“Intelligence is the dynamic capacity of individuals to engage effectively with their sociocultural environment, utilizing a diverse range of cognitive abilities (psychological tools), cultural tools, and social interactions, and realized through rule-governed practices that determine the correctness of reasoning, problem solving and concept application.”
development happens in the brain.
necessary but not sufficient = no mechanism of intelligence exists (no brain development exists)
fairies are not an explanation of the development of intelligence, brains must be involved
Why you would define intelligence as purely dynamic? There is a static aspect, which is discrete, otherwise there’d be no “measurement” (that is a static, discrete value).
“Sociocultural”? Why are you leaving out the real external, objective environment, which has an objective rule-based structure that is not determined by human minds and interactions? You also leave out where human society and culture comes from… which is humans, which have a pre-existing or apriori well-defined structure that goes beyond the purely contemporary definitions of rightness and wrongness and rules in society and reasoning made by humans.
And a lot of that structure comes from the nonsociocultural world. I.E. physical laws and biological behavior interacting together.
Like AnimeCat says, the brain exists. It has physical structure and laws. These are rules beyond society and culture.
I mean… you’d have to be really deluded not to get that at this point. Do you not?
Well, I do get that intelligence is dynamic because it involves showing that you have “solved” something or created something with you mind, from one point in time to another. I guess the arbitrariness of the definition as purely socially and culturally malleable threw me off.
Defining non-social cognition as “being rational” is not useful, since if you can measure “rationality” you can basically measure what everyone else calls IQ, or at least a quantifiable part of it. (I recall you saying that people can be more rational than others). It’s slippery language.