By the end of the 20th century, Whites, Indians, Coloureds and Blacks in South Africa averaged IQs of 98, 92, 82, and 69 (UK norms) and malnutrition rates of 5.7, 10.9*, 18, and 32 percent respectively (see table 2.13 below):
From The Global Bell Curve (2008) by Richard Lynn
Malnutrition is defined here as the percentage of the population that is stunted. Stunted is defined as two or more standard deviations (SDs) shorter than comparable healthy populations. In theory only 2% of the healthy reference population should be stunted.
But nutrition is not a discrete variable. In theory there’s a perfect continuum between optimum and suboptimum processing of nutrients and each population has their own bell curve.
So if 32% of South African blacks have sub-optimum nutrition compared to only 2% of well nourished populations, then that tells us that the 32nd percentile (-0.47 SD) on the former’s bell curve equates to the 2nd percentile (- 2 SD) on the latter’s. Assuming roughly equal standard deviations, it suggests South Africa’s black bell curve is shifted 1.53 SD to the left of what was considered optimum at the time.
So the stunted children are just the tip of the iceberg. The average black child in South Africa should be 1.53 SD below his genetic potential in physical growth. What about brain size? Also 1.53 SD below genetic potential? Given the 0.4 correlation between IQ and brain size, this would predict IQ would be 0.4 (1.53 SD) = 0.61 SD below genetic potential. Multiplying by the IQ standard deviation of 15 points, this gives 9 points of impairment caused by malnutrition. Adding this to the IQ 69 of black South Africans gives IQ 78.
I applied the same calculations to all the major groups of South Africa:
It is interesting to compare the estimated black genetic IQ of 78 to the average IQ of 85 for African Americans, a presumably well nourished population judging from the fact that they are virtually indistinguishable from white Americans in height. But genetically African Americans are only 75% sub-Saharan, so adjusting for this, they go from 15 points below IQ 100, to 15/0.75 = 20 points below 100 = IQ 80. In other words, virtually all of the difference between unmixed American and South African blacks vanishes when we adjust for presumably stunted brain size.
Similarly, the IQs of Indians and whites rise to their corresponding levels when reared in the UK (a well nourished country).
*The malnutrition of Indians were estimated from the line of best fit predicting poverty rates in table 2.13 to malnutrition rates in table to 2.13: Malnutrition = 0.65(poverty) – 2.79.
100,000 years from now, scientists might discover the bones of today’s Dutch and today’s African pygmies and say:
There’s a height difference of 4.3 standard deviations. This is much greater than the height difference between Homo Sapiens and Neanderthals; the Dutch and the Pygmies must be two different species!
But then another scientist will come along and say:
Height is only one trait. Look how similar their skulls are. Both have nice round skulls compared to the football shaped Neanderthal skulls. Look how flat their faces are compared to the prognathous Neanderthals. So while the height difference might be 4.3 SD, the differences in facial angle and cranial sphericity is so little, so on average, the phenotypic gap between them is much smaller than the gap between either of them and Neanderthals. So these are different races within Homo Sapeins, not different species.
I find it fascinating that despite all the enormous physical variation among different human ethnic groups, we all have the shared phenotype of round cranium, flat face tucked under the brain case, small jaw, and light bones that separate us from Neanderthals.
In 1969, Arthur Jensen wrote an article in the prestigious Harvard Educational Review [HER} that transformed him from highly respected, but little known scholar, to one of the most controversial and influential psychologists of all time. So influential was Jensen, that a new word entered the English language: Jensenism; and a platoon of famous scholars made a career out of trying to debunk him.
The three tenets of Jensenism are:
Compensatory education fails to improve the IQ or scholastic skills of culturally deprived kids.
Genetics explains more of the variance in American IQ than culture.
Genetics likely explains some part of the 15 point black-white IQ gap in the United States
So powerful was Jensenism that President Nixon assigned his staff to report to him on Jensen’s HER article. In 1974 Daniel Patrick Moynihan stated, “The winds of Jensenism are blowing through Washington with gale force.”.
Frank Miele writes:
According to John Ehrlichman, Richard Nixon told him that he believed America’s Blacks could only marginally benefit from federal programs because they were genetically inferior to Whites. All the federal money and programs we could devise could not change that fact. Though he believed that Blacks could never achieve parity in intelligence, economic success, or social qualities, we should still do what we could for them, within limits, because it was the “right” thing to do.
From page 151 of Intelligence, Race and Genetics by Frank Miele
While Nixon was clearly a Jensenista, Jensen was a self-described liberal, stating:
In fact, I voted for Johnson in the 1964 presidential election. I felt strongly enough about it that I voted by absentee ballot because I was in London on sabbatical leave working as a Guggenheim Fellow in Eysenck’s department.
I believed in the Great Society proposals, particularly with respect to education and Head Start. When I returned to California I gave talks at schools, PTA meetings, and conferences and conventions explaining why these things were important and should be promoted. I have always been opposed to racial segregation and discrimination. They go against everything in my personal philosophy, which includes maximizing individual liberties and regarding every individual in terms of his or her own characteristics rather than the person’s racial or ethnic background. How could I think otherwise when at the time I had been steeped in Gandhian philosophy for over 20 years?
From pages 33-34 of Intelligence, Race and Genetics by Frank Miele
But by 1969 he was clearly less liberal when it came to compensatory education for disadvantaged kids. Was he changing his views to gain political traction in Nixon’s more conservative America? Jensen states:
Absolutely false! That way of thinking is completely foreign to me. I am almost embarrassed by my lack of interest in politics and I was even less interested in those days than I am now. The idea of providing any kind of “ammunition,” scientific or otherwise, to help any political regime promote its political agenda is anathema in my philosophy. One always hopes, of course, that politicians will pay attention to scientific findings and take them into consideration in formulating public policy. But I absolutely condemn the idea of doing science for political reasons.
I have only contempt for people who let their politics or religion influence their science. And I rather dread the approval of people who agree with me only for political reasons.
From page 35 of Intelligence, Race and Genetics by Frank Miele
Nonetheless, some racists reached out to Jensen, for help. Jensen states:
After the publicity surrounding the HER article, I did receive a number of letters from so-called citizens’ groups in various Southern states, asking if I would write letters to their local newspapers in support of racial segregation in public schools. I replied that I was, and always have been, absolutely opposed to racial segregation of any kind. One of these people wrote back calling me “just another Berkeley pinko!” He at least gave me the satisfaction of knowing I had angered him.
From page 21 of Intelligence, Race and Genetics by Frank Miele
So after 30 years of arguing that races differ in genetic IQ, what did Jensen think of affirmative action. Jensen states:
When the original concept of Affirmative Action was just catching on in the 1960s it was not a quota system. That only came later. I approved two main facets of its original intent, and I still do: (1) We should make special efforts to ensure that historically underrepresented minorities are fully aware the educational opportunities in colleges and universities, in job training programs, and in employment opportunities are open to all, provided they meet the usual qualifications; and (2) colleges and universities, job training programs, and employers should actively seek out and recruit minority persons who could qualify by the usual standards, including the use of academic talent searches at the high school level, special inducements, and scholarships to encourage academically promising minority students to go on to college.
From page 177 of Intelligence, Race and Genetics by Frank Miele
Have you ever wondered why we have to go all the way to Africa to see a safari? For Africa is the land of 13000 lb elephants and 18 foot tall giraffes.
But what many do not realize is that 40,000 years ago, the whole World looked like an African safari. North America and Eurasia were home to Pachystruthio dmanisensis, a flightless bird that stood 11.5 feet tall and weighed nearly a 1000 lbs.
North America was also home to the short-faced bear which stood up to 14 feet tall, weighed about 1700 lbs, and could run up to 40 miles per hour. And of course who could forget the 13000 lb mammoth, which lived on every continent except Australia.
Scientists call these giant animals “megafauna” (mega = big, and fauna = animals). We still have megafauna in the world, but there used to be a whole lot more of it. In fact, it appears that having a large number of large-bodied animals in an ecosystem is actually the normal state for our planet, at least for the geologic era we are living in today, the Cenozoic (or “Age of Mammals”) . But sometime in the past 50,000 years (very recent geologically), everywhere except for Africa, most of those large animals became extinct. And we still aren’t sure why!
Some scientists think megafauna survived in Africa because humans evolved there so large animals had more time to adapt to us. However members of the genus Homo have been living outside Africa for 2 million years, so Eurasian megafauna had time to adapt to us too. Another theory is that megafauna were killed off by the extreme climate changes that megafauna endured outside Africa.
But in asking why megafauna went extinct everywhere except Africa, politically correct scientists are forced to ignore the elephant in the room (pun intended): HBD. If Arthur Jensen was correct about the black-white IQ gap being genetic, perhaps Africans simply hadn’t evolved the intelligence to hunt large game.
But that can’t be the whole story. If racial differences in IQ evolved because we needed more intelligence to survive the non-tropics, how were Australian aboriginals (who retain a tropical phenotype) able to kill off 100% of their giant mammals? Migrating from Africa to Australia means their ancestors must have spent some time in the non-tropical ice age Middle East. Was this enough time for them to evolve the intelligence to hunt big game or was the big game in Australia simply easier to hunt because it had not had the time to evolve ways to avoid humans?
If cold climate selected humans were especially evolved for hunting big game, and if the big game on continents where humans had never been were especially bad at evading human predators, then these two factors predict the biggest megafauna massacre of all should have occurred in the Americas where both conditions were met: cold adapted hunters (humans entered the Americas from Siberia) entering a continent where humans had never been.
And indeed that seems to be the case. Paleo-biologist Rebecca Terry at Oregon State University says “pretty advanced weaponry was definitely present, and the extinctions in the New World in North America and South America were really extreme as a result.”
11,000 years ago (shortly after modern humans entered the New World), the average weight of a non-human mammal in North America was about 200 pounds compared to only 15 pounds today.
Murray talks of an “orthodoxy” that denies the biology of gender, race, and class. This orthodoxy, Murray says, are social constructivists. Murray is here to set the record straight. I will discuss some of Murray’s other arguments in his book, but for now I will focus on the section on race.
Murray, it seems, has no philosophical grounding for his belief that the clusters identified in these genomic runs are races—and this is clear with his assumptions that groups that appear in these analyses are races. But this assumption is unfounded and Murray’s assumption that the clusters are races without any sound justification for his belief actually undermines his claim that races exist. That is one thing that really jumped out at me as I was reading this section of the book. Murray discusses what geneticists say, but he does not discuss what any philosophers of race say. And that is to his downfall.
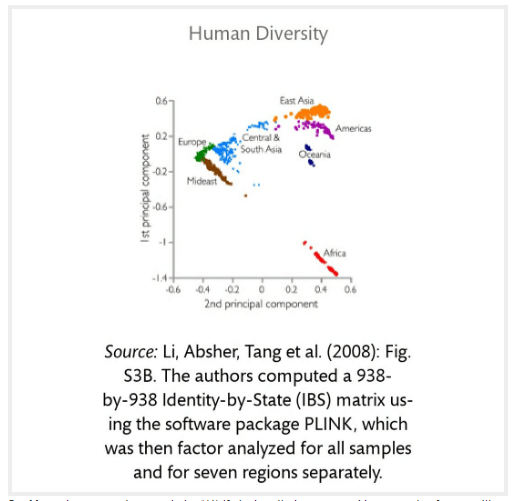
Murray discusses the program STRUCTURE, in which geneticists input the number of clusters they want and, when DNA is analyzed (see also Hardimon, 2017: chapter 4). Rosenberg et al (2002) sampled 1056 individuals from 52 different populations using 377 microsatellites. They defined the populations by culture, geography, and language, not skin color or race. When K was set to 5, the clusters represented folk concepts of race, corresponding to the Americas, Europe, East Asia, Oceania, and Africa. (See Minimalist Races Exist and are Biologically Real.) Yes, the number of clusters that come out of STRUCTURE are predetermined by the researchers, but the clusters “are genetically structured … which is to say, meaningfully demarcated solely on the basis of genetic markers” (Hardimon, 2017: 88).
Races as clusters
Murray then discusses Li et al, who set K to 7 and North Africa and the Middle East were new clusters. Murray then provides a graph from Li et al:
So, Murray’s argument seems to be “(1) If clusters that correspond to concepts of race setting K to 5-7 appear in STRUCTURE and cluster analyses, then (2) race exists. (1). Therefore (2).” Murray is missing a few things here, namely conditions (see below) that would place the clusters into the racial categories. His assumption that the clusters are races—although (partly) true—is not bound by any sound reasoning, as can be seen by his partitioning Middle Easterners and North Africans as separate races. Rosenberg et al (2002) showed the Kalash in K=6, are they a race too?
No, they are not. Just because STRUCTURE identifies a population as genetically distinct, it does not entail that the population in question is a race because they do not fit the criteria for racehood. The fact that the clusters correspond to major areas means that the clusters represent continental-level minimalist races so races, therefore, exist (Hardimon, 2017: 85-86). But to be counted as a continental-level minimalist race, the group must fit the following conditions (Hardimon, 2017: 31):
(C1) … a group is distinguished from other groups of human beings by patterns of visible physical features (C2) [the] members are linked by a common ancestry peculiar to members of that group, and (C3) [they] originate from a distinctive geographic location
[…]
…what it is for a group to be a race is not defined in terms of what it is for an individual to be a member of a race. What it means to be an individual member of a minimalist race is defined in terms of what it is for a group to be a race.
Murray (paraphrased): “Cluster analyses/STRUCTURE spit out these continental microsatellite divisions which correspond to commonsense notions of race.” What is Murray’s logic for assuming that clusters are races? It seems that there is no logic behind it—just “commonsense.” (See also Fish, below.) Due to not finding any arguments for accepting X number of clusters as the races Murray wants, I can only assume that Murray just chose which one agreed with his notions and use for his book. (If I am in error, then if there is an argument in the book then maybe someone can quote it.) What kind of justification is that?
Compared to Hardimon’s argument and definition. Homo sapiens is:
… a subdivision of Homo sapiens—a group of populations that exhibits a distinctive pattern of genetically transmitted phenotypic characters that corresponds to the group’s geographic ancestry and belongs to a biological line of descent initiated by a geographically separated and reproductively isolated founding population. (Hardimon, 2017: 99)
[…]
Step 1. Recognize that there are differences in patterns of visible physical features of human beings that correspond to their differences in geographic ancestry.
Step 2. Observe that these patterns are exhibited by groups (that is, real existing groups).
Step 3. Note that the groups that exhibit these patterns of visible physical features correspond to differences in geographical ancestry satisfy the conditions of the minimalist concept of race.
While Murray is right that the clusters that correspond to the folk races appear in K = 5, you can clearly see that Murray assumes that ALL clusters would then be races and this is where the philosophical emptiness of Murray’s account comes in. Murray has no criteria for his belief that the clusters are races, commonsense is not good enough.
Philosophical emptiness
Murray then lambasts the orthodoxy for claiming that race is a social construct.
Advocates of “race is a social construct” have raised a host of methodological and philosophical issues with the cluster analyses. None of the critical articles has published a cluster analysis that does not show the kind of results I’ve shown.
Murray does not, however, discuss a more critical article of Rosenberg et al (2002)—Mills (2017) – Are Clusters Races? A Discussion of the Rhetorical Appropriation of Rosenberg et al’s “Genetic Structure of Human Populations.” Mills (2017) discusses the views of Neven Sesardic (2010)—philosopher—and Nicholas Wade—science journalist and author of A Troublesome Inheritance (Wade, 2014). Both Wade and Seasardic are what Kaplan and Winther (2014) term “biological racial realists” whereas Rosenberg et al (2002), Spencer (2014), and Hardimon (2017) are bio-genomic/cluster realists. Mills (2017) discusses the “misappropriation” of the bio-genomic cluster concept due to the “structuring of figures [and] particular phrasings” found in Rosenberg et al (2002). Wade and Seasardic shifted from bio-genomic cluster realism to their own hereditarian stance (biological racial realism, Kaplan and Winther, 2014). While this is not a blow to the positions of Hardimon and Spencer, this is a blow to Murray et al’s conception of “race.”
Murray (2020: 144)—rightly—disavows the concept of folk races but wrongly accepting the claim that we dispense with the term “race”:
The orthodoxy is also right in wanting to discard the word race. It’s not just the politically correct who believe that. For example, I have found nothing in the genetics technical literature during the last few decades that uses race except within quotation marks. The reasons are legitimate, not political, and they are both historical and scientific.
Historically, it is incontestably true that the word race has been freighted with cultural baggage that has nothing to do with biological differences. The word carries with it the legacy of nineteenth-century scientific racism combined with Europe’s colonialism and America’s history of slavery and its aftermath.
[…]
The combination of historical and scientific reasons makes a compelling case that the word race has outlived its usefulness when discussing genetics. That’s why I adopt contemporary practice in the technical literature, which uses ancestral population or simply population instead of race or ethnicity …
[Murray also writes on pg 166]
The material here does not support the existence of the classically defined races.
(Nevermind the fact that Murray’s and Herrnstein’s The Bell Curvewas highly responsible for bringing “scientific racism” into the 21st century—despite protestations to the contrary that his work isn’t “scientifically racist.”)
In any case, we do not need to dispense with the term race. We only need to deflate the term (Hardimon, 2017; see also Spencer, 2014). Rejecting claims from those termed biological racial realists by Kaplan and Winther (2014), both Hardimon (2017) and Spencer (2014; 2019) deflate the concept of race—that is, their concepts only discuss what we can see, not what we can’t. Their concepts are deflationist in that they take the physical differences from the racialist concept (and reject the psychological assumptions). Murray, in fact, is giving into this “orthodoxy” when he says that we should stop using the term “race.” It’s funny, Murray cites Lewontin (an eliminativist about race) but advocates eliminativism of the word but still keeping the underlying “guts” of the concept, if you will.
We should only take the concept of “race” out of our vocabulary if, and only if, our concept does not refer. So for us to take “race” out of our vocabulary it would have to not refer to any thing. But “race” does refer—to proper names for a set of human population groups and to social groups, too. So why should we get rid of the term? There is absolutely no reason to do so. But we should be eliminativist about the racialist concept of race—which needs to exist if Murray’s concept of race holds.
There is, contra Murray, material that corresponds to the “classically defined races.” This can be seen with Murra’s admission that he read the “genetics technical literature”. He didn’t say that he read any philosophy of race on the matter, and it clearly shows.
Deflationary realism provides a worked-out alternative to racialism—it is a theory that represents race as a genetically grounded, relatively superficial biological reality that is not normatively important in itself. Deflationary realism makes it possible to rethink race. It offers the promise of freeing ourselves, if only imperfectly, from the racialist background conception of race.
Spencer (2014) states that the population clusters found by Rosenberg et al’s (2002) K = 5 run are referents of racial terms used by the US Census. “Race terms” to Spencer (2014: 1025) are “a rigidly designating proper name for a biologically real entity …” Spencer’s (2019b) position is now “radically pluralist.” Spencer (2019a) states that the set of races in OMB race talk (Office of Management and Budget) is one of many forms “race” can take when talking about race in the US; the set of races in OMB race talk is the set of continental human populations; and the continental set of human populations is biologically real. So “race” should be understood as proper names—we should only care if our terms refer or not.
Murray’s philosophy of race is philosophically empty—Murray just uses “commensense” to claim that the clusters found are races, which is clear with his claim that ME/NA people constitute two more races. This is almost better than Rushton’s three-race model but not by much. In fact, Murray’s defense of race seems to be almost just like Jensen’s (1998: 425) definition, which Fish (2002: 6) critiqued:
This is an example of the kind of ethnocentric operational definition described earlier. A fair translation is, “As an American, I know that blacks and whites are races, so even though I can’t find any way of making sense of the biological facts, I’ll assign people to my cultural categories, do my statistical tests, and explain the differences in biological terms.” In essence, the process involves a kind of reasoning by converse. Instead of arguing, “If races exist there are genetic differences between them,” the argument is “Genetic differences between groups exist, therefore the groups are races.”
So, even two decades later, hereditarians are STILL just assuming that race exists WITHOUT arguments and definitions/theories of race. Rushton (1997) did not define “race”, and also just assumed the existence of his three races—Caucasians, Mongoloids, and Negroids; Levin (1997), too, just assumes their existence (Fish, 2002: 5). Lynn (2006: 11) also uses a similar argument to Jensen (1998: 425). Since the concept of race is so important to the hereditarian research paradigm, why have they not operationalized a definition and rely on just assuming that race exists without argument? Murray can now join the list of his colleagues who also assume the existence of race sans definition/theory.
Murray (2020: 17) asks “Why me? I am neither a geneticist nor a neuroscientist. What business do I have writing this book?” If you are reading this book for a fair—philosophical—treatment for race, look to actual philosophers of race and don’t look to Murray et al who do not, as shown, have a definition of race and just assume its existence. Spencer’s Blumenbachian Partitions/Hardimon’s minimalist races are how we should understand race in American society, not philosophically empty accounts.
Murray is right—race exists. Murray is also wrong—his kinds of races do not exist. Murray is right, but he doesn’t give an argument for his belief. His “orthodoxy” is also right about race—since we should accept pluralism about race then there are many different ways of looking at race, what it is, and its influence on society and how society influences it. I would rather be wrong and have an argument for my belief then be right and appeal to “commonsense” without an argument.
Prestigious Black national merit finalist GondwanaMan writes in the comment section:
… I’ve heard Thomas speak multiple times over the past 10 years and he seems very intelligent but I’ve heard mixed things about his behavior/intellect. Maybe PP can do an IQ analysis I would be very interested…
Thomas came from nothing to become one of the most powerful men on the planent. He is clearly intelligent compared to the average American, but in my opinion he would score lower on an IQ test than most other members of the super-elite.
For one thing, Thomas is known for his chilling silence. Unlike other supreme court judges who ask questions and make comments, Thomas has been largely silent for decades, much like the dim-witted Jason from the Friday the 13th movies.
Conservatives tend to score lower on IQ tests than liberals and blacks tend to score lower than whites, but because blacks are almost never conservative, the rare combination of being both conservative and black doesn’t bode well.
Of course conservatism is a vaguely defined moving target so Thomas may have very intelligent reasons for his political views that are actually quite liberal in the true spirit of the term. For example Thomas opposes affirmative action, not because he’s anti-black, but because he saw first hand how being seen as a token devalued his Yale Law degree. While white law grads had elite law firms at their beck and call, Thomas had to apply to dozens of firms to even be considered. Of course this was the 1970s when there was a lot more racism.
In general he felt that affirmative action benefits light-skinned blacks from elite backgrounds while dark skinned blacks like himself had to work much harder. Of course if racial IQ differences are genomic, we’d expect darker skinned blacks like Thomas to have lower IQs (on average) than their lighter skinned peers like Obama and Corey Booker. From page 45 of the book Strange Justice written by Jane Mayer and Jill Abramson:
Not only was he short, and in his teen years slight, but he also had exceptionally African features years before the Black is Beautiful movement made them desirable. “He was darker than most kids, and in that generation, people were cruel,” recalled Sara Wright, a librarian for the Savannah Morning News who attended elementary and junior high school with Thomas. “He was teased a lot and they’d call him [N word redacted by PP, 2020-03-02] Naps” for his tightly curled hair. “A lot of the girls wouldn’t want to go out with him.”
Thomas himself remembered being called “ABC,” or “America’s Blackest Child.” Even friends recollect taunting him that “if he were any blacker, he’d be blue.” As Lester Johnson, who is now a lawyer in Savannah, recalled, “Clarence had big lips, nappy hair and he was almost literally black. Those folks were at the bottom of the pole. You just didn’t want to hang with those kids.
…The most prominent families in town since before the Civil War were for the most part what a local history of African-Americans called “high yellow,” or mulatto. At the same time, many of those with pure African bloodlines, like Thomas were made to feel inferior.”
…At Yale he talked bitterly about the “light-skinned elite” blacks who had it easier than the darker ones.
pg 45 of Strange Justice
Of course race is only one variable that correlates with IQ and we shouldn’t give it too much emphasis, as some very dark skinned blacks score far higher on IQ tests than 99% of whites and East Asians, however as the below photo with George H.W. Bush shows, Thomas has many physical traits that put him at risk for low IQ.
Thomas is much shorter and more muscular than his fellow elite George H.W. Bush. Height is positively correlated with IQ and weight/height ratio is negatively correlated with IQ. Also the cranial capacity of the elder Bush seems to dwarf Thomas’s. But to his credit, Thomas is wearing glasses and myopia is thought to be genomically linked to high IQ.
So what is his IQ?
It’s unclear if Thomas ever took an official IQ test but he almost certainly took proxy versions like the SAT and LSAT. However these scores are not known so we’re left only with his grades.
The book Strange Justice describes his academic behavior at Holy Cross college:
But much of his time was spent alone, usually studying. His classmates recalled that when they went to dances at nearby schools on Saturday nights, Thomas often preferred to stay in the basement of the college library. When the school threatened to shorten the Saturday night library hours, he petitioned the authorities to keep the facility open. And when others went away during holidays, he stayed in the otherwise empty school, explaining later that he viewed such breaks as a valuable opportunity to get ahead of the other students.
Academically, his efforts paid off. He wrote to a friend that he had managed to maintain a 3.7 grade point average, and he graduated in 1971 with honors, ranking ninth in his class
According to The New York Times, Thomas’s grades at Holy Cross were in the top 7% of his class.
Let’s assume grades are simply an average of IQ and hard work (averaging is appropriate because two variables are not correlated). If we assume Thomas was in the top 1% in hard work (skipping holidays, petitioning the library to stay open), which is 2.33 standard deviations above the class average, how high would his IQ have to be to end up in the top 7% (+1.6 SD). Simple algebra tells us that if he was +2.33 SD in hard work (relative to Holy Cross students), his IQ could be no higher than +0.87 SD for his grades to be +1.6 SD.
So now that we estimate Thomas’s IQ was +0.87 SD relative to Holy Cross students, we need to know what their IQ distribution was.
Circa 2014 Holy Cross had a median SAT score of 1280 out of 1600 which equates to a mean IQ of 128 (U.S. norms).
However we know Harvard students went from an SAT IQ of 143 to an IQ around 128 with an SD of 12 on a test not used to select them (one third regression to the mean) so the actual IQ distribution at Holy Cross (in 2014 and perhaps historically) was likely around 118 with a standard deviation around 12 (compared to the U.S. distribution of 100 with an SD of 15).
Thus Thomas’s estimated IQ is 118 + 0.87(12) = 128 (U.S. norms) or 127 (white norms). In other words, smarter than 96% of white America.
Is this estimate too high?
There is reason to think this estimate might err on the high side. For example on page 201 of the book Yale Law School and the Sixties: Revolt and Reverberations it states:
…Associate Dean Ralph Brown recalled that “we were admitting blacks very indulgently, and a lot of them could barely do the work.” When courses required in-class exams, minorities tended to end up “in the bottom,” Charles Reich said. “You couldn’t disguise that”. One could get around it, he added, by having students write papers that, after several drafts, might well deserve a high grade, as he did for Clarence Thomas. But first semester courses required exams.
Since first semester Yale Law courses require exams, perhaps the best estimate of Thomas’s IQ can be found in this paragraph from Strange Justice:
His academic records remain, with his consent, sealed. But professors and administrators from his era recall him as an average student, hard-working but not particularly brilliant. There is only one professor –Thomas I. Emerson– whose records have been made public. Thomas elected to take Emerson’s first-year course on politics and civil rights in 1972, and Emerson’s notes show that he finished the class near the bottom, with a 69 for the semester. One of only two students who scored lower was Thomas’s friend and later witness against Hill, John Doggett.
Interestingly Doggett is also a black conservative.
Assuming about 20 students per class room, being in the bottom three puts Thomas in the bottom 15%, or roughly 1.13 SD below the class mean.
Although students at the best law schools average around IQ 145 on the LSAT, they likely regress to 128 (with an SD of 12) on tests not used to select them. Thus if Thomas’s bottom 15% performance in Emerson’s law class implies an IQ of:
128 – 1.13(12) = 114 (U.S. norms) or 112 (U.S. white norms).
Higher than 79% of white America.
That sounds about right.
[this article was lightly edited on March 3, 2020]
The NAEP provides ethnic averages and percentiles in both reading and math for 8th graders in 2019. I chose 8th graders because they are the oldest age group for which they have nationally representative samples, since 12th graders only include those who have not yet dropped out of school. Note: scores are reported on 0 to 500 scale.
Reading
whites
blacks
Hispanics
American Indian/Alaska native
Asian/Pacific Islander
Multiracial
90th percentil
314
288
297
293
326
312
Average
272
244
252
248
281
267
10th percentile
227
197
202
198
232
218
Estimated SD
34
36
38
38
37
37
Math
whites
blacks
Hispanics
American Indian/Alaska native
Asian/Pacific Islander
Multiracial
90th percentil
339
306
314
308
364
337
Average
292
260
268
262
310
286
10th percentile
245
215
222
215
252
235
Estimated SD
37
36
36
37
44
40
Although the NAEP is not an IQ test, the correlation between IQ tests and scholastic achievement tests is about as high as the correlation between two IQ tests, making them statistically equivalent in the general population. Further, the main reason people care about racial IQ gaps is because they translate into racial learning gaps, so converting to IQ seems appropriate and the advantage of using the NAEP to infer group IQ gaps is the excellent sampling this data has among subjects who have spent their whole lives learning these skills.
reading IQ
math IQ
composite IQ
whites
100
100
100
blacks
88
88
86
Hispanics
91
90
90
American Indian/Alaska native
89
88
88
Asian/Pacific Islander
104
107
106
Multiracial
98
98
97
For technical details on how these scores were converted to IQ, see technical note below.
Technical note
The reading, math, and composite NAEP scores were converted to IQ by equating the white NAEP means with 100 and the white NAEP SDs with 15. The reading and math SDs were estimated by subtracting the 90th percentile NAEP scores from the 10th percentile scores and dividing by 2.53 (the bell curve Z score difference between these percentiles) .To determine the white mean of the composite score, we simply add the reading and math means, which gives 564. The white SD of the composite score was crudely estimated by assuming the reading and math correlation among all white 8th graders taking the NAEP is the same as the correlation among all college bound 17-year-olds taking the SAT (r = 0.67 according to Herrnstein and Murray). Using the formula for calculating the composite SD (from page 779 of the book The Bell Curve by Herrnstein and Murray):
I am extremely honored that Davide Piffer (who has a blog) was kind enough to give our community an exclusive interview. While the leading geneticists in academia have explained only about 10% of the variance in IQ (or its proxy education) at the individual level, Piffer working on his own has reported near perfect correlations between the mean IQs of entire ethnic groups and their polygenic scores, making him a rock star in the HBD community. Virtually no one else on the planet is doing this kind of cutting edge research (at least not publicly).
In retrospect it makes perfect sense that aggregated data should correlate much better than individual level data. Imagine you visited every country in Eurasia and asked only the first person you met in each country their height. Such a small sample size (n = 1) from each country would tell you nothing about which individual country was taller than which, but if you averaged all the heights from the European countries and compared them to the average heights from the Asian countries, you’d learn a lot about which continent was taller. That’s because the small sample size at the level of individual countries is multiplied by the large sample of countries in each continent.
It’s the same with genomically predicting IQ. The small sample of single nucleotide polymorphisms (SNPs) sampled in each individual is multiplied by the large number of individuals sampled in each ethnic group, so while individual predictions are weak, group predictions are strong because individual error cancels out in the aggregate.
Below is my exclusive interview with Piffer. The interview has been lightly edited to remove typos and other mistakes. I began by asking him about table 5 in a 2019 paper he wrote. My statements are in red, while Davide’s are in blue.
PP: I’m very impressed by your work. But the correlation between PG score & mean IQ is so high in table 5 of Piffer (2019) that it seems too perfect. What would you say to skeptics who think you cherry-picked SNPs or manipulated your formulas to get such perfect results?
DP: Thanks. I didn’t cherry pick SNPs. I used the polygenic score provided by Lee et al and you can see that different PGS construction methods lead to same results… I used EA, EA Mtag, etc, weighted and unweighted..they all give same results. Also my paper replicates my previous findings and what I had predicted from theory years ago. The IQs aren’t cherry picked either because I used the same as I used in previous papers to avoid post hoc results.
PP: In table 1 of Piffer (2019), Peruvians & Colombians seem to have higher polygenic scores than the black populations, yet in Figure 11, Africa scores higher than the Americas. So who has higher polygenic scores: sub-Saharan Africans or Amerindians?
DP: Peruvian and Colombian aren’t pure. They are substantially mixed with Europeans. The groups in figure 11 are natives, so they better reflect the unadmixed population. Also the latter are from low coverage genomes with fewer markers so less reliable. I am working on a high coverage version of same datasets but it will take a while due to my limited funds.
Do you have some basic experience in bioinformatics? I am just looking for someone who could run the code on their laptop because it’s taking me a week to impute each chromosome. So I need to run it on multiple computers. But hey no bother…I will do it myself, it will just take it longer.
PP: No sadly I do not have experience with bioinformatics. But I can ask my blog & twitter readers if anyone has such experience and is willing to volunteer their time.
On table 5 of Piffer (2019) the African American PGS (GWAS sig) is 1.836 lower than the NW European PGS. But since African Americans are only 76% non-white (Bryc et al. 2015), can we roughly infer that un-mixed blacks would be 1.836/0.76 = 2.416 below NW Europeans, giving them a PGS score of 46.834?
DP: yes…also you have unmixed native Africans in the other tables. Kenyans, Yoruba, Mende Sierra Leone, etc
PP: In table 5 Latinos have a PGS (GWAS sig.) of 48.654. Do you think this could be used to estimate the PGS of unmixed Amerindians because according to Bryc et al, 2015, Latino Americans are 65.1% white (mostly southern European), 6.2% black, 18% Amerindian, and 11% unassigned, though the unassigned is broader East Asian/Amerindian so should probably be counted as Amerindian. Since you report the PGS for Southern Europeans and since I estimate the the PGS for pure blacks at 46.834, using simple algebra, I estimate unmixed Amerindians would have a PGS of 47.510.
DP: yes, but you should also cross-check these with the other table with scores for Peruvians and Mexicans and see if they converge.
PP: Good point. In one of your data sets you find a 0.57 correlation between PGS and latitude. Do you agree with Lynn’s cold winter theory of how racial differences in intelligence evolved?
DP: in part, yes. but it doesn’t explain the low Amerindian IQ because Native Americans were in Siberia during the Last Glacial Maximum and then they moved to North America at the end of it, which is also a cold region…So I think most of the differences are due to farming and civilization
PP: Well Lynn argues the anomalies can all be explained by population size. Low population races like Arctic people, Amerindians, Australoids, Bushmen, & pygmies have lower IQs than their climates predict because there weren’t enough positive mutations. Meanwhile high population races like East Asians, whites, South Asians, and West Africans have higher IQs than their climates predict. This would also explain why Neanderthals had lower IQs than their climates predict.
DP: but these SNPs are common among the races..the differences are explained by these common SNPs, not pop specific mutations. pop size is probably related to it through higher competition for resources selecting for higher IQ.
PP: I see…so then it was probably farming and civilization as you say. Just as cold climate boosted IQ because it was a novel environment to adapt to, so was farming, civilization and the literacy and numeracy requirements it imposed. Of course Amerindians also independently created civilization but most remained hunter-gatherers.
DP: yes… plus we don’t know how many of these SNPs are just life history or personality traits like C. stuff that farming selected for. most of them are related to g but a subset will also be related to conscientiousness. Emil et al in their Psych paper vetted their association with g in a sample though so I guess they must be genuine associations with IQ for the most part.
PP: Yes, because no one has given a huge sample (n = 1 million) of genotyped people a highly g loaded test. A perfect study would get a sample of 1 million people (from all over the world) and give them an extremely culture reduced test with many subtests to maximize g loading (i.e. block design, draw a person in the sand, name as many body parts as you can in 1 minute in your own language, pictorial oddities etc) and then enter the composite score, DNA and human development index of each person into a computer and have machine learning create a multiple regression equation predicting IQ using HDI & genomic variants as independent variables. By using such a diverse and global sample, one finds the genomic variants that correlate with IQ everywhere and thus are most likely to be causal.
DP: yes.
PP: Now that the neanderthal genome has been published, why haven’t you tried to estimate their polygenic score? Richard Klein argues that before about 50 kya, modern humans and neanderthals had similar intellect, but suddenly around 50 kya there was a genetic brain change that allowed modern humans to leave Africa, colonize every continent, replace neanderthals & invent art & complex technology. Testing this hypothesis was the main motivation to sequence the neanderthal genome so there’s enormous interest in their intelligence, even in mainstream science.
DP: yes that’s the next step…we’re analyzing genomes from Bronze age now, but Neanderthal would be good. But funds are limited for this kind of research and I am not working in academia.
PP: Above you rejected Lynn’s population size mutation theory on the grounds that all races have all the known IQ related genomic variants, however it also seems you have no high coverage genomes from low population isolated groups like pygmies, bushmen, australoids, arctic people & pure Amerindians. Is it plausible that high coverage genomes of these groups would show they are missing some of the IQ enhancing mutations that appeared in the last 15,000 years?
DP: What I am saying is that you can see a difference even at the common SNPs in their frequencies. I cannot rule out that they are also missing these mutations but that would be an additional factor.
PP: Do you agree with John Hawks’s theory that positive selection in the last 5000 years has been a hundred times faster than in any other period of human evolution because of the explosion of new mutations & environmental change? This is the exact opposite of Gould who argued we have the same bodies and brains we’ve had 40,000 years ago and all subsequent change has been cultural not biological.
DP: from a purely theoretical point of view, yes, but one would need to study ancient genomes to empirically vet that hypothesis.
PP: Is there any strong evidence in support of Michael Woodley’s theory that white genomic IQ has declined by 10 or 15 IQ points since the Victorian era?
DP: I computed the decline based on the paper by Abdellaoui on British [Education Attainment] PGS and social stratification and it’s about 0.3 points per decade, so about 3 points over a century.
It’s not necessarily the case that IQ PGS declined more than the EA PGS..if anything, the latter was declining more because dysgenics on IQ is mainly via education so I think 3 points per century is a solid estimate
Thank you Davide Piffer for this interview. As mentioned above, you can find more of Davide’s thoughts on his blog.
Davide Piffer looked at 2,404 genomic variants found to predict education (a rough proxy for IQ) and used these to create polygenic scores of eight ethnic groups reared in First World conditions. He then compared the polygenic scores with the mean IQ of each group and found a 0.979 correlation.
Table 5 from Evidence for Recent Polygenic Selection on Educational Attainment and Intelligence Inferred from Gwas Hits: A Replication of Previous Findings Using Recent Data by Davide Piffer, 2019
The line of best fit allows us to predict the mean IQ of any group from their PGS (GWAS sig.):
Mean IQ = 9.31(PGS (GWAS sig.)) – 358
Given the 0.979 correlation, genotype predicts IQ remarkably well: Finnish 102, Ashkenazi 108, Southern Europe 99, Estonia 100, NW European 100, African American 83, Latino 95, East Asians 105.
So while our genomic predictions of IQ remain poor at the individual level, Piffer is showing we can predict the mean IQs of ethnic groups with incredible precision, at least when they’re all reared in similar countries.
Because we have only found a tiny fraction of the genetic variants associated with IQ (or its proxy education), the margin of error for predicting any one person’s IQ remains high. But when you try to predict the average IQ of an entire ethnic group, the overestimates and underestimates cancel each other out, and there’s a near perfect correlation between the mean polygenic score and the mean IQ.
A 2015 paper by Kate Cockcroft et al., compares the scores of 349 British middle class university undergrads to 107 lower class black South African undergrads on the WAIS-III (UK edition).
The results were as follows:
The UK students averaged a full-scale IQ of 106.95 (UK norms) while the South Africans averaged IQ 93.27. However because this study was published 18 years after the UK WAIS-III was published, we should adjust for the Flynn effect.
The single best source on recent Wechsler Flynn effects is Weiss et al., 2015 which found that full-scale IQ has been increasing by 0.31 points per year, at least in U.S. children. If we assume it’s the same for UK adults, then the UK students have an adjusted IQ of 101 and the South African students have an adjusted IQ of 88.
What’s more interesting to me is how they did on the culture reduced tests since that’s the more fair comparison.
Test:
Digit Span scaled score
Flynn adjusted Digit Span scaled score
Flynn adjusted Digit Span IQ equivalent
Block Design scaled score
Flynn adjusted Block Design scaled score
Flynn adjusted Block Design IQ equivalent
Compoite IQ based on adjusted scores on both tests
UK undergrads
9.5
9.32
97
10.66
9.76
99
98
Black South African undergrads
9.35
9.17
96
8.67
7.77
89
91
So on a composite score of the most culture reduced spatial & non-spatial test (Block Design & Digit Span), Black South African undergrads average IQ 91. This is 11 points higher than the average Black South African seems to score on the same culture reduced tests.
As of 2013, only 16% of South Africa’s black young adults were attending higher education (compared to about 55% of whites, 47% of Indians and 14% of Coloureds). Thus, simply attending university puts one in the top 16% of this demographic, with the median South African university student being in the top 8%. If there were a perfect correlation between IQ and education, the median South African black university student would have an IQ 21 points higher than the average black South African. In reality his IQ is only 11 points higher, suggesting a correlation of 0.52 (at least on the most culture reduced tests).
This is similar to the 0.57 correlation between IQ and education observed in the United States.