100,000 years from now, scientists might discover the bones of today’s Dutch and today’s African pygmies and say:
There’s a height difference of 4.3 standard deviations. This is much greater than the height difference between Homo Sapiens and Neanderthals; the Dutch and the Pygmies must be two different species!
But then another scientist will come along and say:
Height is only one trait. Look how similar their skulls are. Both have nice round skulls compared to the football shaped Neanderthal skulls. Look how flat their faces are compared to the prognathous Neanderthals. So while the height difference might be 4.3 SD, the differences in facial angle and cranial sphericity is so little, so on average, the phenotypic gap between them is much smaller than the gap between either of them and Neanderthals. So these are different races within Homo Sapeins, not different species.
I find it fascinating that despite all the enormous physical variation among different human ethnic groups, we all have the shared phenotype of round cranium, flat face tucked under the brain case, small jaw, and light bones that separate us from Neanderthals.
One way psychologists estimate IQ heritability (the percentage of variation in IQ linked to variation in DNA) is by correlating the IQs of monozygotic (MZ) twins raised apart. The higher the correlation, the more genetic IQ is thought to be.
However skeptics argue that because MZ twins raised apart still shared the same womb, and still grow up in the same country and sometimes the same town, the high correlation doesn’t prove the genetic effects are independent of environment (maybe the same genotype that increases IQ in the U.S. would decrease it Japan, but we’ll never know if virtually all the twins raised “apart” are still raised in the same country).
As commenter “Mugabe” suggested, the ideal study would have genetic clones separated at conception and gestated and raised by random women all over the developed World, but such a study would be unethical. And even if such a study were possible, and even if it showed strong independent genetic effects, the nature of these effects would remain mysterious. Does DNA directly cause IQ (i.e. coding for bigger and more efficient brains), or does it do so indirectly (i.e. causing us to stay in school longer, where we learn how to think). The problem with even the best designed study of MZ twins separated into random environments is that only the starting environment is random. As we grow old, we select environments that fit our DNA, and although the effects of such environments are counted as genetic effects (since our genes made us choose those environments) they are actually gene-environment feedback loops.
But what if it were possible to clone just our brains, and these cloned brains were reared in environments completely alien to anything we have experienced. You grew up in a nice middle class family, and your cloned brain grows up in a petri dish, where its environment was 100% controlled with no gene-environment feedback loop.
Then we could be sure that any cognitive correlation between us and our cloned brains was not only an independent genetic effect, but a direct one to boot.
It sounds like science fiction, but something similar is actually happening in the lab of Alysson Muotri, a biologist at the University of California, San Diego. Muotri takes skin cells from volunteers, turns them into stem cells, and then makes them grow into tiny pinhead sized balls of brain tissue called organoids.
Of course these organoids are way too tiny to be considered cloned brains, but they are complex enough to make brain waves. And Muotri has already found that cognitively impaired populations have cells that produce underdeveloped brain organoids in the petri dish. For example brain organoids derived from autistic people had about a 50% reduction in synaptogenesis.
Muotri also decided to study Neanderthal brain organoids. Since it’s not possible to get cells from Neanderthals, he edited modern human DNA. Of the 20,000 protein coding genes, only 61 differ between us and them, and of these, only four are highly expressed in the brain so by editing just these four genes, he was able to produce Neanderthalized organoids, or Neanderoids as he calls them. Modern humans had far more spherical skulls than Neanderthals so it’s interesting that our brain organoids are spherical, while theirs look like popcorn.
Muotri notes that like the autistic brain organoids, the Neanderoids have a 50% reduction in synaptogenesis. Neanderoids also show 65% to 75% reductions in firing rate and activity level per neuron per minute. Muotri thinks this may help explain why it took them several hundred thousand years to progress from simple stone tools to, well, simple stone tools. By contrast, in just the last 50,000 years we jumped from simple stone tools to the internet, genetic engineering and traveling to the moon.
image from Muotri’s talk comparing our rate of cultural progress to Neanderthals’
So clearly brain organoids are very good at identifying cognitively impaired populations, but can they measure normal variation in human intelligence?
Muotri could greatly advance our understanding of behavioral genetics if he made brain organoids of a representative sample of Americans of known IQ scores, and then correlated the synaptogenesis, neuron activity level and firing rate of the organoids with the tested IQs of the people from whom they were derived. Perhaps a carefully weighted composite score of all three measures would give the best prediction of IQ, and perhaps such a formula could allow us to estimate how Neanderthal’s would score on IQ tests (if they were reared in our society).
If it’s too difficult to get a representative sample of Americans and test their IQs, he could simply have students at his university donate their cells, and then correlate their brain organoid scores with their SAT scores. Would there be statistically significant differences in the brain organoids of people who score a perfect 1600 on the SAT compared to those who score 1400 compared to those who score 1200 compared to those who score 1000?
Muotri is also trying to teach the brain organoids how to control a robotic body. The speed with which they learn might be considered a low level IQ test. So imagine taking a conventional intelligence test like the Wechsler Adult Intelligence Scale (WAIS) or the SAT, while your mini-brain, raised in a petri dish is taking its own IQ test (learning to control its robotic body). This could be the 21st century version of studies where identical twins raised apart have their IQs correlated. If your score on a conventional intelligence test predicts the speed with which your brain organoid learns to control its robotic body, then that proves IQ tests are measuring a genetic property of the brain that is completely independent from social class and culture because environment is perfectly controlled in the petri dish.
Perhaps in the future instead of universities testing candidates on the SAT, they’ll just test the student’s brain organoids instead to eliminate the cultural bias some think confounds the SAT. For there’s no culture in the petri dish (aside from bacteria culture :-)).
When a prosecutor suspects a murderer is faking his low score on the WAIS to avoid execution (because it’s illegal to execute people with IQs below 70 in some states) he could insist on testing the murderer’s brain organoid instead (since they can’t fake low scores-as far as we know).
On the other hand brain organoids might prove that normal variation in IQ is nowhere near as genetic or biological as its proponents think. I find it fascinating that just four brain genes separating modern humans from Neanderthals produced such dramatic differences in brain organoids. That implies each gene must have huge effects. That’s not at all consistent with research on normal IQ variation among modern humans, which estimates that some 10,000 genomic variants are involved, each one affecting IQ by only a fraction of a point. It’s also possible that brain organoids showcase too early a stage of brain development to correlate with the higher abstract abilities measured by IQ tests (for example infant development scales have weak correlations with adult IQ).
In the below video Muotri discusses his brain organoid research:
I am extremely honored that Davide Piffer (who has a blog) was kind enough to give our community an exclusive interview. While the leading geneticists in academia have explained only about 10% of the variance in IQ (or its proxy education) at the individual level, Piffer working on his own has reported near perfect correlations between the mean IQs of entire ethnic groups and their polygenic scores, making him a rock star in the HBD community. Virtually no one else on the planet is doing this kind of cutting edge research (at least not publicly).
In retrospect it makes perfect sense that aggregated data should correlate much better than individual level data. Imagine you visited every country in Eurasia and asked only the first person you met in each country their height. Such a small sample size (n = 1) from each country would tell you nothing about which individual country was taller than which, but if you averaged all the heights from the European countries and compared them to the average heights from the Asian countries, you’d learn a lot about which continent was taller. That’s because the small sample size at the level of individual countries is multiplied by the large sample of countries in each continent.
It’s the same with genomically predicting IQ. The small sample of single nucleotide polymorphisms (SNPs) sampled in each individual is multiplied by the large number of individuals sampled in each ethnic group, so while individual predictions are weak, group predictions are strong because individual error cancels out in the aggregate.
Below is my exclusive interview with Piffer. The interview has been lightly edited to remove typos and other mistakes. I began by asking him about table 5 in a 2019 paper he wrote. My statements are in red, while Davide’s are in blue.
PP: I’m very impressed by your work. But the correlation between PG score & mean IQ is so high in table 5 of Piffer (2019) that it seems too perfect. What would you say to skeptics who think you cherry-picked SNPs or manipulated your formulas to get such perfect results?
DP: Thanks. I didn’t cherry pick SNPs. I used the polygenic score provided by Lee et al and you can see that different PGS construction methods lead to same results… I used EA, EA Mtag, etc, weighted and unweighted..they all give same results. Also my paper replicates my previous findings and what I had predicted from theory years ago. The IQs aren’t cherry picked either because I used the same as I used in previous papers to avoid post hoc results.
PP: In table 1 of Piffer (2019), Peruvians & Colombians seem to have higher polygenic scores than the black populations, yet in Figure 11, Africa scores higher than the Americas. So who has higher polygenic scores: sub-Saharan Africans or Amerindians?
DP: Peruvian and Colombian aren’t pure. They are substantially mixed with Europeans. The groups in figure 11 are natives, so they better reflect the unadmixed population. Also the latter are from low coverage genomes with fewer markers so less reliable. I am working on a high coverage version of same datasets but it will take a while due to my limited funds.
Do you have some basic experience in bioinformatics? I am just looking for someone who could run the code on their laptop because it’s taking me a week to impute each chromosome. So I need to run it on multiple computers. But hey no bother…I will do it myself, it will just take it longer.
PP: No sadly I do not have experience with bioinformatics. But I can ask my blog & twitter readers if anyone has such experience and is willing to volunteer their time.
On table 5 of Piffer (2019) the African American PGS (GWAS sig) is 1.836 lower than the NW European PGS. But since African Americans are only 76% non-white (Bryc et al. 2015), can we roughly infer that un-mixed blacks would be 1.836/0.76 = 2.416 below NW Europeans, giving them a PGS score of 46.834?
DP: yes…also you have unmixed native Africans in the other tables. Kenyans, Yoruba, Mende Sierra Leone, etc
PP: In table 5 Latinos have a PGS (GWAS sig.) of 48.654. Do you think this could be used to estimate the PGS of unmixed Amerindians because according to Bryc et al, 2015, Latino Americans are 65.1% white (mostly southern European), 6.2% black, 18% Amerindian, and 11% unassigned, though the unassigned is broader East Asian/Amerindian so should probably be counted as Amerindian. Since you report the PGS for Southern Europeans and since I estimate the the PGS for pure blacks at 46.834, using simple algebra, I estimate unmixed Amerindians would have a PGS of 47.510.
DP: yes, but you should also cross-check these with the other table with scores for Peruvians and Mexicans and see if they converge.
PP: Good point. In one of your data sets you find a 0.57 correlation between PGS and latitude. Do you agree with Lynn’s cold winter theory of how racial differences in intelligence evolved?
DP: in part, yes. but it doesn’t explain the low Amerindian IQ because Native Americans were in Siberia during the Last Glacial Maximum and then they moved to North America at the end of it, which is also a cold region…So I think most of the differences are due to farming and civilization
PP: Well Lynn argues the anomalies can all be explained by population size. Low population races like Arctic people, Amerindians, Australoids, Bushmen, & pygmies have lower IQs than their climates predict because there weren’t enough positive mutations. Meanwhile high population races like East Asians, whites, South Asians, and West Africans have higher IQs than their climates predict. This would also explain why Neanderthals had lower IQs than their climates predict.
DP: but these SNPs are common among the races..the differences are explained by these common SNPs, not pop specific mutations. pop size is probably related to it through higher competition for resources selecting for higher IQ.
PP: I see…so then it was probably farming and civilization as you say. Just as cold climate boosted IQ because it was a novel environment to adapt to, so was farming, civilization and the literacy and numeracy requirements it imposed. Of course Amerindians also independently created civilization but most remained hunter-gatherers.
DP: yes… plus we don’t know how many of these SNPs are just life history or personality traits like C. stuff that farming selected for. most of them are related to g but a subset will also be related to conscientiousness. Emil et al in their Psych paper vetted their association with g in a sample though so I guess they must be genuine associations with IQ for the most part.
PP: Yes, because no one has given a huge sample (n = 1 million) of genotyped people a highly g loaded test. A perfect study would get a sample of 1 million people (from all over the world) and give them an extremely culture reduced test with many subtests to maximize g loading (i.e. block design, draw a person in the sand, name as many body parts as you can in 1 minute in your own language, pictorial oddities etc) and then enter the composite score, DNA and human development index of each person into a computer and have machine learning create a multiple regression equation predicting IQ using HDI & genomic variants as independent variables. By using such a diverse and global sample, one finds the genomic variants that correlate with IQ everywhere and thus are most likely to be causal.
DP: yes.
PP: Now that the neanderthal genome has been published, why haven’t you tried to estimate their polygenic score? Richard Klein argues that before about 50 kya, modern humans and neanderthals had similar intellect, but suddenly around 50 kya there was a genetic brain change that allowed modern humans to leave Africa, colonize every continent, replace neanderthals & invent art & complex technology. Testing this hypothesis was the main motivation to sequence the neanderthal genome so there’s enormous interest in their intelligence, even in mainstream science.
DP: yes that’s the next step…we’re analyzing genomes from Bronze age now, but Neanderthal would be good. But funds are limited for this kind of research and I am not working in academia.
PP: Above you rejected Lynn’s population size mutation theory on the grounds that all races have all the known IQ related genomic variants, however it also seems you have no high coverage genomes from low population isolated groups like pygmies, bushmen, australoids, arctic people & pure Amerindians. Is it plausible that high coverage genomes of these groups would show they are missing some of the IQ enhancing mutations that appeared in the last 15,000 years?
DP: What I am saying is that you can see a difference even at the common SNPs in their frequencies. I cannot rule out that they are also missing these mutations but that would be an additional factor.
PP: Do you agree with John Hawks’s theory that positive selection in the last 5000 years has been a hundred times faster than in any other period of human evolution because of the explosion of new mutations & environmental change? This is the exact opposite of Gould who argued we have the same bodies and brains we’ve had 40,000 years ago and all subsequent change has been cultural not biological.
DP: from a purely theoretical point of view, yes, but one would need to study ancient genomes to empirically vet that hypothesis.
PP: Is there any strong evidence in support of Michael Woodley’s theory that white genomic IQ has declined by 10 or 15 IQ points since the Victorian era?
DP: I computed the decline based on the paper by Abdellaoui on British [Education Attainment] PGS and social stratification and it’s about 0.3 points per decade, so about 3 points over a century.
It’s not necessarily the case that IQ PGS declined more than the EA PGS..if anything, the latter was declining more because dysgenics on IQ is mainly via education so I think 3 points per century is a solid estimate
Thank you Davide Piffer for this interview. As mentioned above, you can find more of Davide’s thoughts on his blog.
Lion of the Blogosphere has an interesting article up about the genomics of height and intelligence. He writes:
Height, like intelligence, is a complicated polygenic trait involving hundreds, probably thousands, of genetic variants.
It’s interesting how the discussion has changed in recent years from genes to genetic variants. I even go further and now use the term “genomic variants”.
Lion continues:
But unlike intelligence, it’s not politically incorrect to study the genetics of height, or to assume that if a particular ethnicity is very tall or very short, then it’s because of genetics.
Because if you say a person or ethnicity is genetically smarter, we equate this with genetic superiority, a concept many people find offensive.
But in a way calling a group genetically taller also implies genetic superiority. Height is right up there with intelligence as one of the most universally valued traits. Not only do most women not want to date a guy under 5’9″ but sperm banks don’t even accept their sperm because they’re considered genetic trash.
The culture is awash in height supremacist metaphors: We “look up” to those we admire and “look down” on those we disdain. Taller men make more money, achieve more education, and are more likely to lead corporations and entire nations. “Standing tall” is a metaphor for having dignity.
But of course intelligence is what makes us human. Height is not.
The same techniques could be used to investigate intelligence. It would be beneficial to study the smartest ethnicity (Ashkenazi Jews) and extremely low-intelligence ethnicities like Aboriginal Australians and southern African Bushmen. I’m sure if we did that, we could discover additional genetic variants related to intelligence.
Scientists are working hard on exactly this, but because it’s politically incorrect to label any extant human populations “low intelligence”, they are instead focusing on extinct ones like Neanderthals. From aNew York Times article about Svante Paabo, who played a major role in sequencing the Neanderthal genome:
Reconstructing a Neanderthal genome was a tour de force, we can all agree, but why does it matter?
Paabo spends only a little time directly addressing this question. He argues that the Neanderthal genome can serve as a counterpoint to our own. It enables Paabo and his colleagues to draw up a list of mutations that our ancestors acquired after they split from Neanderthals. Among those mutations may be changes that led to our capacity for language, symbolic thought or the other traits that make us uniquely human.
These genes may hold key clues to the behavioral differences between modern humans and the extinct, archaic human species. According to Svante Pääbo of the Max Planck Institute, they could constitute “a catalog of genetic features that sets all modern humans apart from all other organisms, living or extinct.”
“I believe,” he added, “that in it hide some of the things that made the enormous expansion of human populations and human culture and technology in the last 100,000 years possible.”
What Homo Sapiens accomplished in 50-100k years far outstrips Neanderthal accomplishments over a much longer period of time.
So Pääbo is hoping that by studying the genomic variants that distinguish virtually all anatomically modern humans from virtually all Neanderthals, he’ll discover why our species colonized the entire planet, invented civilization and went to the moon, while Neanderthals languished in the stone age for hundreds of thousands of years.
But what if the biggest changes are very recent? In 2007 sciencemag.org stated:
Plentiful food has made it easier than ever before to survive and reproduce in many parts of the world, so it’s tempting to think that our species has stopped evolving. But a controversial new study says that isn’t so. Far from slowing down, human evolution has sped up in the past 40,000 years and has become 100 times faster in the past 5000 years alone, according to the analysis.
So should we think of the last 5000 years as half a million years of evolution?
Human evolution has been moving at breakneck speed in the past several thousand years, far from plodding along as some scientists had thought… In fact, people today are genetically more different from people living 5,000 years ago than those humans were different from the Neanderthals who vanished 30,000 years ago …
But if they were more similar to Neanderthals, why are they considered members of our own species, and if so much evolution has occurred in the last 5,000 years, how did we manage to look fully modern by 195,000 years ago (the age when our species first categorically appears in the fossil record)?
Commenter “Some Guy” had some questions about polygenic scores for me. His questions are in block quotes with my answers directly below each one.
How good do you think polygenic scores will have to get before they start getting used on an individual level? Like within how many SDs of the true IQ/g/educational achievement?
If one’s polygenic score is extreme enough, it doesn’t have to be very accurate at all to give useful information. For example, let’s say you have several embryos to choose from and one has a polygenic education score of +5 SD. Even though such scores only predict 12% of the variance, because +5 SD is so extreme, you can be about 97% confident that embryo will grow up to be more educated than the average person (assuming he or she is raised in a society similar to the one from which the stats were derived).
One problem with polygenic scores is they don’t seem translate well from one culture to another, suggesting they’re more correlative than causal.
The uses I can think of is to identify children with high potential from poor backgrounds, or as an environmentally unbiased entrance “exam” for schools etc.
What I would like to see them be used for is to estimate the IQs of historical Geniuses like Albert Einstein and to estimate the IQs of ancient human populations. For example Richard Klein believes there was a major genetic change in human cognition that occurred about 50 kya that allowed us to suddenly spread from Africa, replace the Neanderthals, colonize the globe and create representational art. If we compared the polygenic scores of humans both before and after the upper Paleolitic revolution, we could test this idea. Similarly Gregory Clark believes rapid genetic evolution in Europe allowed the industrial revolution.
I would also love to see polygenic IQ scores for the Neanderthals, assuming they would be meaningful in a group that culturally and genomically distinct.
What sort of PGS-IQ correlation would result in polygenic scores that are say within 1 SD of the true IQ? I know you often calculate standard errors from correlations, mind sharing the formula/method?
Within 1 SD with degree of certainty? If you mean with 95% certainty, you would need a correlation of 0.85+ which I doubt will ever be achieved. Even the correlation between two different IQ tests is seldom that high.
The method is to square the correlation to get the percentage of the variance explained, and then subtract that value from 1 to see what percentage is left unexplained.
So for example a PGS that correlated 0.85 with IQ explains 72% of the IQ variance, thus leaving 28% unexplained.
The variance is defined as the standard deviation squared, so since the IQ standard deviation is set at 15, the variance is 225, and 28% of 225 is 63.
The square root of 63 is 7.9 which is what the standard deviation would be if everyone had the same PGS. This is also known as the standard error of the estimate. Now in a bell curve, 95% fall within 1.96 of the mean, so multiplying 7.9 by 1.96 tells us that 95% of say the UK, will have IQs within 15.5 points of the PGS prediction.
So if you have a PGS of +2 SD that correlates 0.85 with IQ, your IQ will likely be 0.85(2) = +1.7 or IQ 126, with a 95% confidence interval of 111 to 142. But of course we’re nowhere near seeing a 0.85 correlation.
To get the general public to really trust polygenic scores for IQ, I’d guess the accuracy would have to be within 5 points of the true score. Within 10 points would lead to people who actually differ by 20 points regularly ending up with the same polygenic score. Since 20 points tend to be the difference between leaders and followers, such errors would be highly noticeable.
I think if they achieved a correlation of 0.7 with IQ they’d be considered credible (especially if the predictive power was maintained across oceans and generations). That’s the correlation between different IQ type tests with each-other and these are routinely used to decide issues as important as who gets into an elite college, who gets excluded from the military, who gets diagnosed as disabled or gifted, and who gets sentenced to death by the courts.
By the way, what do you think about this argument against people who consider intelligence entirely environmental: If that really was the case, then disadvantaged people would NEVER be smarter than people with good backgrounds. So why even bother giving people from poor backgrounds a chance? 100% environmentalism leads to un-egalitarian conclusions, and is easily disproven by the existence of smart disadvantage people.
It’s prima facie absurd, but it wouldn’t necessarily lead to the conclusion that we shouldn’t give deprived people a chance. On the contrary it might lead to the conclusion that changing IQ is simply a matter of changing environments.
The following chart (created by some scientist(s) led by David Reich) shows the genetic divergence between hominin samples as a fraction of the human-chimp difference. So for example, all the human groups have just over a 0.12 genetic divergence with Neanderthals, meaning that the genetic difference between humans and Neanderthals is only 12% as great as the genetic difference between humans and Chimps (source: supplement of Genetic history of an archaic hominin group from Denisova Cave in Siberia.)
The purpose of the chart is to estimate how long ago the different populations diverged from a common ancestor. So since the fossil record tells us that Neanderthals and chimps diverged about 6.5 million years, then humans and Neanderthals should have diverged roughly 0.8 million years ago (12% of 6.5 million) assuming genetic divergence maps to chronological divergence in a linear way.
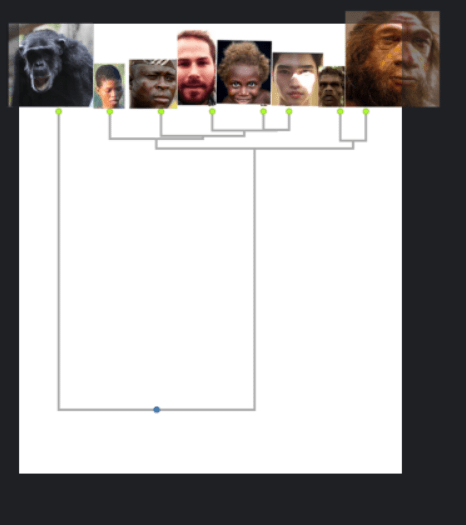
I transformed the genetic distance matrix into a dendrogram, which looks at all the distances and creates the most parsimonious family tree:
Dendogram showing genetic relationship between 8 groups. From left to right: chimps, san, Yoruba, French, Papuan, East Asian, Denisovan, Neanderthals
What’s cool about dendrograms is they let you determine the number of categories and subcategories in a very objective way.
Of course dendrograms are only as good as the data you put into them, and I don’t endorse basing taxonomy simply on genetic relatedness, but if I did, here’s how I’d interpret the above tree:
The first major split is between chimps & everyone else. This is consistent with two well recognized genera of hominins : Pan (i.e. chimps) and Homo (humans and near-humans).
Now within the Homo genus, we see another major split in the tree. Anatomically Modern Humans (AMH) vs Archaic Humans. Thus we can divide the homo genus into at least two major species.
Within the Archaic Humans we can further subdivide into major races: Denisovans and Neanderthals.
Now within our own species, AMH, the dendrogram shows three major races: Capoids, Congoids and Non-Africans.
I’m not saying I agree with this taxonomy since it was only based on genetic distance (much of which is junk DNA) but what’s great about using dendrograms is almost everyone looking at them will assign groups to the same categories and subcategories, even if they don’t use the same words (race, species, genus) to describe them. It’s wholly objective.
But what is needed is a dendrogram based on polygenic scores of actual phenotypes. That way people who have the same phenotypes caused by the same genomic architecture could be grouped together.
Unlike the above dendrogram, which groups based on how recently we share a common ancestor, we need to group based on how much of the common ancestor we share.
[update may 26, 2019: an earlier version of this article misspelled dendrogram]
[2nd update may 26, 2019: an earlier version of this article contained bragging that has since been removed]