• About

Pumpkin Person

~ The psychology of horror

Pumpkin Person

Tag Archives: genetic distance

A principal component analysis of human populations

12 Wednesday Jun 2019

Posted by pumpkinperson in Uncategorized

≈ 53 Comments

Tags

genetic distance, Graping Calculator 3D, minitab, phylogenetic tree, principal component analysis, race

Principal Component Analysis (PCA) is a mathematical technique by which many data points get reduced to a smaller number of more manageable data points.

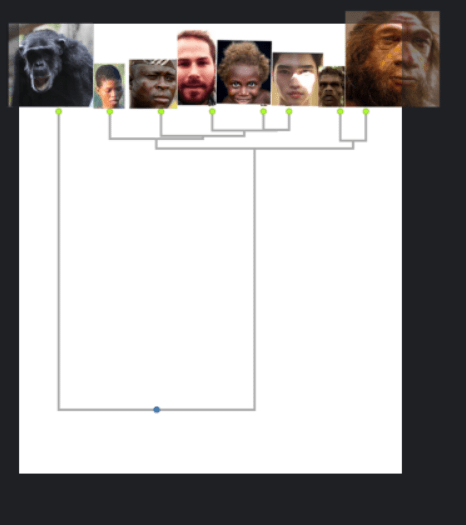
Cavali-Sforza lumped humans into nine major populations. The following shows his phylogenetic tree of these nine populations followed by a matrix showing the genetic distance between them:

Because I wanted to see if these nine populations could be objectively reduced to a smaller number, I made all the distances negative and then entered the genetic distance matrix into a minitab spread sheet.

The reason I made the distances negative is because PC analysis is usually done on correlation matrices where the higher the value, the more similar. In a genetic distance matrix, it’s the opposite, hence the negative signs I added.

The principal component analysis gave the following result.

C1=Africans, C2= Non-European Caucasoid, C3=European Caucasoid, C4= Northeast Asian, C5=Arctic Northeast Asian, C6= Amerindians, C7= Southeast Asian, C8= Pacific Islander, C9= New Guinean & Australian

To determine how many principal components to retain, mathematicians use what’s called the eigenvalue > 1 rule, which in this case means only three components.

The first component explains 54% of genetic variation and since Northeast Asians have the highest loading on this component (0.432), it can be thought of as a measure of Northeast Asianness. Africans are the only group to load negatively on Northeast Asianness (-0.376).

The second component explains 26% of the variation and since Europeans have the highest loading on this (0.526), it can be considered a measure of whiteness.

The third component explains 12% of the variation and since Native Americans have the highest score on this (0.527) it can perhaps be considered a measure of “New Worldliness”.

Now when I plot each of the nine populations in three-dimensional space (x axis = Northeast Asianness, y axis = whiteness, z axis = New Worldliness) with their loadings multiplied by 10 to make differences visible, we find all of the nine populations fit into three major clusters.

made using Graphing Calculator 3D

These three clusters are extremely similar to the three major races of physical anthropology: Mongoloids on the back wall, Negroids on the side wall, and Caucasoids on the floor.

No disrespect to Caucasoids (I’m 100% pure Caucasoid myself). The graph can be reoriented so any group is on the floor.

One anomaly is that New Guineans & Australian aboriginals cluster with Mongoloids, even though they are morphologically closest to Negroid. Of course such anomolies are not uncommon in taxonomy. Birds for example genetically cluster with reptiles, even though they’re not reptiles. Humans cluster with apes, even though we’re not apes.

Such anomalies occur because most of our DNA is junk, so it groups us based on how recently we share common ancestors, not by how much of that common ancestor we shared.

Share this:

  • Twitter
  • Facebook

Like this:

Like Loading...

Genetic distance between humans, neanderthals & other primates

25 Saturday May 2019

Posted by pumpkinperson in Uncategorized

≈ 92 Comments

Tags

anatomically modern humans, David Reich, Denisovans, genetic distance, genus, Neanderthals, race, species, taxonomy

About a year ago I wrote:

The following chart (created by some scientist(s) led by David Reich) shows the genetic divergence between hominin samples as a fraction of the human-chimp difference.  So for example, all the human groups have just over a 0.12 genetic divergence with Neanderthals, meaning that the genetic difference between humans and Neanderthals is only 12% as great as the genetic difference between humans and Chimps (source: supplement of Genetic history of an archaic hominin group from Denisova Cave in Siberia.)

distance4

The purpose of the chart is to estimate how long ago the different populations diverged from a common ancestor.  So since the fossil record tells us that Neanderthals and chimps diverged about 6.5 million years, then humans and Neanderthals should have diverged roughly 0.8 million years ago (12% of 6.5 million) assuming genetic divergence maps to chronological divergence in a linear way.

I transformed the genetic distance matrix into a dendrogram, which looks at all the distances and creates the most parsimonious family tree:

Dendogram showing genetic relationship between 8 groups. From left to right: chimps, san, Yoruba, French, Papuan, East Asian, Denisovan, Neanderthals

What’s cool about dendrograms is they let you determine the number of categories and subcategories in a very objective way.

Of course dendrograms are only as good as the data you put into them, and I don’t endorse basing taxonomy simply on genetic relatedness, but if I did, here’s how I’d interpret the above tree:

The first major split is between chimps & everyone else. This is consistent with two well recognized genera of hominins : Pan (i.e. chimps) and Homo (humans and near-humans).

Now within the Homo genus, we see another major split in the tree. Anatomically Modern Humans (AMH) vs Archaic Humans. Thus we can divide the homo genus into at least two major species.

Within the Archaic Humans we can further subdivide into major races: Denisovans and Neanderthals.

Now within our own species, AMH, the dendrogram shows three major races: Capoids, Congoids and Non-Africans.

I’m not saying I agree with this taxonomy since it was only based on genetic distance (much of which is junk DNA) but what’s great about using dendrograms is almost everyone looking at them will assign groups to the same categories and subcategories, even if they don’t use the same words (race, species, genus) to describe them. It’s wholly objective.

But what is needed is a dendrogram based on polygenic scores of actual phenotypes. That way people who have the same phenotypes caused by the same genomic architecture could be grouped together.

Unlike the above dendrogram, which groups based on how recently we share a common ancestor, we need to group based on how much of the common ancestor we share.

[update may 26, 2019: an earlier version of this article misspelled dendrogram]

[2nd update may 26, 2019: an earlier version of this article contained bragging that has since been removed]

Share this:

  • Twitter
  • Facebook

Like this:

Like Loading...

contact pumpkinperson at easiestquestion@hotmail.ca

Recent Comments

pumpkinperson on The three grades of Homo …
Santocool on The three grades of Homo …
Name on The three grades of Homo …
The Philosopher on The three grades of Homo …
Santocool on The three grades of Homo …
The Philosopher on The three grades of Homo …
illuminaticatblog on The three grades of Homo …
pumpkinperson on The three grades of Homo …
The Philosopher on The three grades of Homo …
Lurker on The three grades of Homo …

Archives

  • January 2023
  • December 2022
  • November 2022
  • October 2022
  • September 2022
  • August 2022
  • July 2022
  • June 2022
  • May 2022
  • April 2022
  • March 2022
  • February 2022
  • January 2022
  • December 2021
  • November 2021
  • October 2021
  • September 2021
  • August 2021
  • July 2021
  • June 2021
  • May 2021
  • April 2021
  • March 2021
  • February 2021
  • January 2021
  • December 2020
  • November 2020
  • October 2020
  • August 2020
  • July 2020
  • May 2020
  • April 2020
  • March 2020
  • February 2020
  • January 2020
  • December 2019
  • November 2019
  • October 2019
  • September 2019
  • August 2019
  • July 2019
  • June 2019
  • May 2019
  • April 2019
  • March 2019
  • February 2019
  • January 2019
  • December 2018
  • November 2018
  • October 2018
  • September 2018
  • August 2018
  • July 2018
  • June 2018
  • May 2018
  • April 2018
  • March 2018
  • February 2018
  • January 2018
  • December 2017
  • November 2017
  • October 2017
  • September 2017
  • August 2017
  • July 2017
  • June 2017
  • May 2017
  • April 2017
  • March 2017
  • February 2017
  • January 2017
  • December 2016
  • November 2016
  • October 2016
  • September 2016
  • August 2016
  • June 2016
  • November 2015
  • May 2015
  • December 2014

Categories

  • ethnicity
  • heritability
  • Oprah
  • Uncategorized

Meta

  • Register
  • Log in
  • Entries feed
  • Comments feed
  • WordPress.com

Blog at WordPress.com.

  • Follow Following
    • Pumpkin Person
    • Join 651 other followers
    • Already have a WordPress.com account? Log in now.
    • Pumpkin Person
    • Customize
    • Follow Following
    • Sign up
    • Log in
    • Report this content
    • View site in Reader
    • Manage subscriptions
    • Collapse this bar
 

Loading Comments...
 

    %d bloggers like this: