Trump’s test scores have been in the news a lot lately. It started over a year ago when Trump’s former lawyer Michael Cohen told congress that he threatened Trump’s university Fordham not to release his SAT scores (which is illegal anyway). An official from Fordham confirmed this.
More recently, Trump’s niece Mary Trump has said that when Trump transferred to the University of Pennsylvania he hired a boy named Joe Shapiro to take his SATs for him. The White House denies this.
More recently still, Trump has been bragging about acing the Montreal Cognitive Assment (MOCA) during a screening for dementia.
Trump may sound like an idiot to most liberals but remember that IQ is scored on an age based curve and many people in their 70s can barely string together a sentence, so the mere fact that he can argue with the press in a fast and entertaining way should put him comfortably above IQ 100 (the population mean). But how much much above 100?
Trump claims to have scored 30 out of 30 on the MOCA but given Trump’s history of exaggerating personal accomplishments (net worth, TV ratings, etc) that’s highly suspect. His doctor confirmed that, but when it comes to presidential politics, even medical reports can’t be trusted.
But assuming he’s being truthful, I emailed Dr. Ziad Nasreddine (the test’s creator) to ask what percentage of non-demented elderly people score perfect on this test. He replied “10% of normals score 30/30”.
Of course the MOCA does not call itself an IQ test, but aside from the brief administration time, incredibly low ceiling and bias towards memory items, it’s content is virtually indistinguishable from one. It includes general knowledge “What’s today’s date?”, picture vocabulary “identify pictures of common animals”, spatial reasoning “draw a cube”, arithmetic “count backwards from a 100 in multiples of 7”, short-term memory “repeat words”, and verbal abstract reasoning “state how common objects are alike”.
Still, I wouldn’t recommend using this as an IQ test in above average populations. A Nobel Prize winning theoretical physicist could have a verbal and mathematical IQ in the stratosphere, but because they lack the spatial IQ to draw a clock at a given time, they’d end up with a score lower than Trump’s.
On the WAIS-IV, if an elderly person scores in the top 10% of the “healthy population”, they’re assigned an IQ of 119, however by excluding the demented from the norms, I’ve long felt the WAIS-IV underestimates elderly IQs. IQ is supposed to reflect your cognitive rank within the range of cognitively normal variation so it makes sense to exclude people with gross chromosomal abnormalities (i.e. Downs syndrome) from the norms, but dementia is arguably just the low end of normal elderly cognitive variation.
Research suggests 13.9% of Americans aged 71+ have dementia, so about 86.1% do not. So if Trump scored in the top 10% of the non-demented, that puts him in the top 8.6% of the general population which equates to an IQ of 120 but obviously since that’s the test’s ceiling, he could be much higher.
When will you do another study on the post 2016 SAT? There was a 60 points inflation. It would be great if you looked into this recent change.
For years I’ve complained that the SAT is normed on college bound students, but in order to convert it to IQ equivalents, we need to know how the general U.S. population would score. Well perhaps someone from the college board was reading because their website has now started publishing two types of norms:
Nationally Representative Sample Percentiles are derived from a research study of U.S. students in grades 11 and 12 and are weighted to represent all U.S. students in those grades, regardless of whether they typically take the SAT.
SAT User Percentiles are based on the actual scores of students in the past three graduating classes who took the current SAT during high school. These user percentiles are reported on tests completed in August 2019 through June 2020.
So for example, a combined score (verbal + math) of 1055, which makes you dead average (50th percentile) among the college bound elite who takes the SAT, would make you slightly above average (59th percentile) among the nationally representative sample.
One problem is even the nationally representative sample is a bit elite because many of the dullest Americans don’t make it to grade 11, let alone grade 12. so how do we adjust for this?
It turns out we don’t have to because only 6% of U.S. high school students now dropout, and even assuming none of this 6% would score high, the percentiles would only change by a fraction of a percent. For example, if you score in the top 1 out of 100 high school seniors, including the high school dropouts would only move you to 1 out of 106. A trivial difference (at least at the high end)
Verbal SAT (Evidence-based reading & writing)
On this section the median high school senior scores 510 so let this = verbal IQ 100. The 98th percentile is 720 so let this = verbal IQ 130. Thus:
Verbal IQ = 27 + 0.14(verbal SAT)
Math SAT
On this section the median high school senior scores 505 and the top 2% score 740, so let these scores equate to math IQs of 100 and 130 respectively. Thus:
Math IQ = 36 + 0.13(math SAT)
Combined SAT (verbal + math)
Overall the median high school senior scores 1055 and the top 2% score 1480, so let these scores equate to composite IQs of 100 and 130 respectively. Thus:
IQ = 26 + 0.07(Combined SAT)
Is the SAT an IQ test?
I have never found a study correlating the SAT with Wechsler IQ in the general U.S. population but I did find such a study correlating the WIAT (which also measures reading and math knowledge) with IQ in a very representative sample of U.S. 16-19 year-olds (n = 142). Reading comprehension and math reasoning correlated 0.71 and 0.82 with Wechsler full-scale IQ respectively (WAIS-III WMS-III Technical Manual page 85-86).
However there are several reasons for thinking the SAT may correlate somewhat less: 1) the enormous importance of the test for some creates huge differences in motivation, test-prep and cheating, and 2) people diagnosed with learning disabilities can take the test without time limits, 3) my research on the Wechsler IQs of Ivy Leagues students suggest they regress at least a third of the way to the mean from their SAT scores, suggesting a correlation no higher than 0.66.
Ghislaine Maxwell was arguably the most powerful woman in the World at certain times because she likely set honey traps for the World’s most powerful men and may have used the leverage to shape World events to her genetic advantage. The most powerful man in America (the sitting President) has historically had an IQ ranging from 119 (JFK) to 143 (Richard Nixon) with a mean of about 130. So we might expect the most powerful woman to also have an IQ around 130, and since Ashkenazi Americans average 10 IQ points above their white counterparts, lets bump her up to 140 (though she may be only half Ashkenazi).
She’s probably at least as smart as her lover Jeffrey Epstein. My research suggests self-made decamillionaires average IQs around 118 and self-made billionaires average IQs around 130 (maybe a little less today since they’ve become so common). Epstein was a self-made centimillionaire so his IQ was perhaps 124. Maybe add 10 points since he was also Ashkenazi so perhaps 134. On the other hand, he was an alleged pedophile, and whatever biological error damaged the sexual parts of his brain may have also damaged the intellectual part too, but it couldn’t have damaged it too much since he was teaching calculus at an elite private school while still in his twenties. Below is a terrifying image of the demented young man with a creepy smile:
He also needed high IQ to hang out so much with Bill Clinton (who Phil Donahue called the most verbally skilled man to ever occupy the White House).
Maxwell came from a far higher class background than Epstein. She attended Oxford, her father was a famous Mossad agent and media tycoon and her mother a respected Holocaust scholar. By contrast Epstein’s Brooklyn parents were so prole that a lady on his childhood street couldn’t understand how their genes produced such a bright son. Epstein might be a good example of high IQ causing success independently of both social class and credentials which Epstein lied about to get ahead.
It seems Maxwell needed a pedophile to lure some of the World’s most powerful men into partaking in this behavior with him and as soon as they did, Maxwell had video that she and whatever organization she worked for could use as leverage. Because achieving the highest levels of wealth and power may require both high testosterone and high psychopathy, such men may lack the sexual restraint and morals to respect age of consent laws and people like Maxwell take advantage by setting honey traps. Avoiding these traps is yet another reason why the rich and powerful need high IQ.
Commenter pumpkinhead has some questions which I posted below in red (with my answers in black).
1) What is the correlation of a childhood IQ test(say WISC) to an adult IQ(say WAIS)? 12 vs 18+ years old lets say…?
Below are all the studies I’ve found on the long-term stability of Wechsler IQ. The median correlation is 0.84.
Approximate age at initial testing
Age at retesting
Correlation
Study
sample size
2
9
0.56
Humphreys (1989)
?
2
15
0.78
Humphreys (1989)
?
9
15
0.47
Humphreys (1989)
?
9.5
23.5
0.89
Mortensen et al (2003)
26
29.7
41.6
0.73
Kangas & Bradway (1971)
48
50
60
0.94
Mortensen & Kleven (1993)
141
60
70
0.91
Mortensen & Kleven (1993)
141
50
70
0.90
Mortensen & Kleven (1993)
141
2) Is the 95% CI usually around 20 points at the average, gets narrower as the IQ increases and then gets wider again once we get to genius levels?
Confidence Intervals used in IQ testing assume a bivariate normal distribution and thus are the same at all IQ levels though the gap between one’s measured IQ and whatever variable it’s being used to estimate (i.e. “true” IQ) increases the further one’s measured IQ is from the mean. But the 95% confidence interval is always 1.96 multiplied by the standard error of the estimate.
3) Are IQ tests for <12 year olds less accurate, get more accurate for 12-17 yo and even more so for adults(18+)?
Even in early childhood the Wechsler IQ tests are incredibly reliable and load extremely high on g (the general factor of all cognitive abilities). But IQ correlates much less with DNA at younger ages so that might be telling us it’s much less accurate in childhood after all.
4) On a more anecdotal level Marylyn Vos Savant is reputed to have scored a 228 at 10(albeit with shoddy extrapolations) and then again in adulthood scored a 186 on the Mega test. That is a 42 point difference, what is the probability that someone could have such a gap with the WISC and WAIS?
The probability would increase the further you get from the mean. So assuming a 0.84 correlation between childhood and adult IQ, someone who was 128 IQ points above the mean (IQ 100) at age 10 (IQ 228), would be expected to be 0.84(128) = 108 points above the mean in adulthood (IQ 208) and we could say with 95% certainty that their adult IQ would be from 192 to 224.
Why did the prediction miss in Marilyn’s case? For starters The 1937 Stanford Binet she took at age 10 has a mean of 101.8 and a standard deviation (SD) of 16.4 while the Mega Test has a mean of 100 and an SD of 16. If both her scores were converted to the Wechsler scale (which uses a mean of 100 and an SD of 15), she would have scored 215 in childhood and 181 in adulthood. Then consider that the Stanford Binet was 19 years old when she took it, and old norms inflate test scores by as much as 3 points per decade (in the short-term) and her childhood score was really more like 209.
Then consider she took two different tests (the Stanford Binet at age 10 and the Mega in adulthood). Even at the same age, different IQ tests typically only correlate 0.8, so the 0.84 correlation between childhood IQ and adult IQ might be more like 0.84(0.8) = 0.67 when different tests are used at each age.
The expected adult IQ of someone who scores 109 points above the mean at age 10 (IQ 209) is 109(0.67) above the mean which equals IQ 173 (95% confidence interval of 151 to 195) so her childhood IQ actually underpredicted her adult IQ which is surprising since her childhood IQ was based on dubious extrapolation of the mental age scale.
One way psychologists estimate IQ heritability (the percentage of variation in IQ linked to variation in DNA) is by correlating the IQs of monozygotic (MZ) twins raised apart. The higher the correlation, the more genetic IQ is thought to be.
However skeptics argue that because MZ twins raised apart still shared the same womb, and still grow up in the same country and sometimes the same town, the high correlation doesn’t prove the genetic effects are independent of environment (maybe the same genotype that increases IQ in the U.S. would decrease it Japan, but we’ll never know if virtually all the twins raised “apart” are still raised in the same country).
As commenter “Mugabe” suggested, the ideal study would have genetic clones separated at conception and gestated and raised by random women all over the developed World, but such a study would be unethical. And even if such a study were possible, and even if it showed strong independent genetic effects, the nature of these effects would remain mysterious. Does DNA directly cause IQ (i.e. coding for bigger and more efficient brains), or does it do so indirectly (i.e. causing us to stay in school longer, where we learn how to think). The problem with even the best designed study of MZ twins separated into random environments is that only the starting environment is random. As we grow old, we select environments that fit our DNA, and although the effects of such environments are counted as genetic effects (since our genes made us choose those environments) they are actually gene-environment feedback loops.
But what if it were possible to clone just our brains, and these cloned brains were reared in environments completely alien to anything we have experienced. You grew up in a nice middle class family, and your cloned brain grows up in a petri dish, where its environment was 100% controlled with no gene-environment feedback loop.
Then we could be sure that any cognitive correlation between us and our cloned brains was not only an independent genetic effect, but a direct one to boot.
It sounds like science fiction, but something similar is actually happening in the lab of Alysson Muotri, a biologist at the University of California, San Diego. Muotri takes skin cells from volunteers, turns them into stem cells, and then makes them grow into tiny pinhead sized balls of brain tissue called organoids.
Of course these organoids are way too tiny to be considered cloned brains, but they are complex enough to make brain waves. And Muotri has already found that cognitively impaired populations have cells that produce underdeveloped brain organoids in the petri dish. For example brain organoids derived from autistic people had about a 50% reduction in synaptogenesis.
Muotri also decided to study Neanderthal brain organoids. Since it’s not possible to get cells from Neanderthals, he edited modern human DNA. Of the 20,000 protein coding genes, only 61 differ between us and them, and of these, only four are highly expressed in the brain so by editing just these four genes, he was able to produce Neanderthalized organoids, or Neanderoids as he calls them. Modern humans had far more spherical skulls than Neanderthals so it’s interesting that our brain organoids are spherical, while theirs look like popcorn.
Muotri notes that like the autistic brain organoids, the Neanderoids have a 50% reduction in synaptogenesis. Neanderoids also show 65% to 75% reductions in firing rate and activity level per neuron per minute. Muotri thinks this may help explain why it took them several hundred thousand years to progress from simple stone tools to, well, simple stone tools. By contrast, in just the last 50,000 years we jumped from simple stone tools to the internet, genetic engineering and traveling to the moon.
image from Muotri’s talk comparing our rate of cultural progress to Neanderthals’
So clearly brain organoids are very good at identifying cognitively impaired populations, but can they measure normal variation in human intelligence?
Muotri could greatly advance our understanding of behavioral genetics if he made brain organoids of a representative sample of Americans of known IQ scores, and then correlated the synaptogenesis, neuron activity level and firing rate of the organoids with the tested IQs of the people from whom they were derived. Perhaps a carefully weighted composite score of all three measures would give the best prediction of IQ, and perhaps such a formula could allow us to estimate how Neanderthal’s would score on IQ tests (if they were reared in our society).
If it’s too difficult to get a representative sample of Americans and test their IQs, he could simply have students at his university donate their cells, and then correlate their brain organoid scores with their SAT scores. Would there be statistically significant differences in the brain organoids of people who score a perfect 1600 on the SAT compared to those who score 1400 compared to those who score 1200 compared to those who score 1000?
Muotri is also trying to teach the brain organoids how to control a robotic body. The speed with which they learn might be considered a low level IQ test. So imagine taking a conventional intelligence test like the Wechsler Adult Intelligence Scale (WAIS) or the SAT, while your mini-brain, raised in a petri dish is taking its own IQ test (learning to control its robotic body). This could be the 21st century version of studies where identical twins raised apart have their IQs correlated. If your score on a conventional intelligence test predicts the speed with which your brain organoid learns to control its robotic body, then that proves IQ tests are measuring a genetic property of the brain that is completely independent from social class and culture because environment is perfectly controlled in the petri dish.
Perhaps in the future instead of universities testing candidates on the SAT, they’ll just test the student’s brain organoids instead to eliminate the cultural bias some think confounds the SAT. For there’s no culture in the petri dish (aside from bacteria culture :-)).
When a prosecutor suspects a murderer is faking his low score on the WAIS to avoid execution (because it’s illegal to execute people with IQs below 70 in some states) he could insist on testing the murderer’s brain organoid instead (since they can’t fake low scores-as far as we know).
On the other hand brain organoids might prove that normal variation in IQ is nowhere near as genetic or biological as its proponents think. I find it fascinating that just four brain genes separating modern humans from Neanderthals produced such dramatic differences in brain organoids. That implies each gene must have huge effects. That’s not at all consistent with research on normal IQ variation among modern humans, which estimates that some 10,000 genomic variants are involved, each one affecting IQ by only a fraction of a point. It’s also possible that brain organoids showcase too early a stage of brain development to correlate with the higher abstract abilities measured by IQ tests (for example infant development scales have weak correlations with adult IQ).
In the below video Muotri discusses his brain organoid research:
I have always doubted the historical consensus that Africans sold their own people into slavery. The whole point of slavery is that you’re forced to work without pay. If whites were powerful enough to force millions of blacks to work without pay, they would have been powerful enough to take those workers from black countries without having to pay for them in the first place.
Also, if they were going to pay for slaves, then why go all the way to Africa to get them? The whole point of going to a less technologically advanced region to get slaves is that you can take the slaves by force.
Lastly, if you believe in HBD (which many people dismiss as racist pseudoscience), the average white American is about 15 IQ points higher than the average black American and that gap would have perhaps been 20 points before white genes entered the U.S. black gene pool in large numbers. A 20 point IQ gap (if it reflects a genuine gap in intelligence) is so large that whites would have been dominant enough to simply help themselves to whatever resources they wanted in sub-Saharan Africa (including human ones) without having to pay anyone anything. In fact if whites really had to pay for slaves, it calls HBD into question because it implies a business deal among equal races, not an advanced race enslaving a more primitive one.
Ironically, Professor Black Truth agrees that whites stole (rather than paid for) black slaves but he uses it to argue their moral inferiority, not their cognitive superiority:
Professor Black Truth is a youtube personality who reminds me of a black version of “Philosopher” and other alt-right extremists. Just as Philosopher thinks Ashkenazi elites conspire to undermine white interests (by propping up blacks), professor Black Truth thinks the elite serves white interests and conspires to oppress blacks (by propping up tools for white supremacy).
I estimate Professor Black Truth to be more verbally intelligent than 99.75% of Americans (verbal IQ 142(U.S. norms)) but he draws bad conclusions on social issues. He thinks Michael Jackson was innocent and has yet to progress beyond Chomsky talking points when it comes to U.S. foreign policy.
Estimated social IQ? 104 (slightly above the U.S. average)
Estimated overall IQ? About 128 (higher than 97% of America).
Of course that’s very rough because as a listener I can only observe his verbal skills and social understanding, not the many other abilities that are also part of intelligence.
In my opinion he is bitter that his high IQ didn’t take him as far in life as he thought it would and is resentful of the patronizing praise he probably got from much less intelligent white frat boys in college. Unlike Obama (who he views as a closet homosexual), his high IQ probably made him more of a freak than a star, and so he rationalizes his modest success by viewing Obama and other black elites as tools for white supremacy,
Despite his flawed analysis, he’s an extremely talented broadcaster with a darkly entertaining exaggerated delivery, much like a comic book villain. In this episode he accuses Ocasio-Cortez of being an anti-black bigot:
Using twin studies, scientists divide phenotypic variation into three categories: DNA variation, shared environmental variation, and unshared environmental variation. Shared environment are all the experiences MZ twins reared together have in common (same upbringing, same schools, same womb) while unshared environment are all the experiences they don’t share (position within the womb, getting hit on the head, having an inspiring teacher).
The best estimate using massive datasets suggest that within Western democracies, DNA explains 41% of IQ variation at age 9, 55% at age 12, 66% at age 17, and 74% in adulthood. By contrast shared environment explains 33% at age 9, 18% at age 12, 16% at age 17, and 10% in adulthood (Bouchard 2013, figure 2). That leaves unshared environment explaining 26% of the variation at age 9, 27% at age 12, 19% at 17, and 16% in adulthood.
You don’t have to believe these associations are causal, but they are real. They’ve been more or less replicated using studies comparing (1) MZ twins with DZ twins, (2) MZ twins raised apart, (3) unrelated people reared in the same home. Although all of these methods depend of different assumptions, they all converge on the same conclusion: the predictive power of DNA skyrockets from childhood to adulthood while the predictive power of shared environment plummets. The same pattern (known as the Wilson effect) has also been observed for other phenotypes and in other species.
But why? Shouldn’t environment get more important as we age since experience has increasing time to accumulate? One theory is that more and more genes become active as we age. A more popular theory is that we select environments that maximize our genotype, so environment becomes just a magnifier of genes, not a causal force in its own right. So genetically smart people will stay in school and genetically strong people will lift weights and take steroids etc. People invest in where they’re more likely to be rewarded.
But here’s where things get really interesting. The Wilson effect behaves differently on different types of IQ tests. In his book Does your Family make you smarter? James Flynn notes that cognitive inequality increases from childhood to later adulthood (because good genes cause good environments and bad genes cause bad environments, the smart get smarter and the dumb get dumber, relative to the average person their age) but this pattern is much more pronounced on some tests than others.
Flynn describes three types of tests:
Type 1: Tests that show large family effects (shared environment) that decay slowly. This include tests involving vocabulary (define “rudimentary”), general knowledge (How old is the Earth?) verbal abstraction (how are a brain and a computer the same?) and social comprehension (why do you need a passport to travel?)
Type 2: Tests that show small family effects that decay fast. These include spatial manipulation (use these two triangles to make a square) and noticing incongruities (what’s missing or absurd in a picture of a common object or scene).
Type 3: Tests that show that large family effects that decay fast. These tests include clerical speed and arithmetic.
Flynn argues that type 1 tests involve skills that children learn from observing their parents talk, hence the large family effect. By contrast he says of type 2 tests:
Aside from the occasional jigsaw puzzle, they have no part in everyday life. Children never see their parents performing these cognitive tasks as part of normal behavior. Family effects are weak, even among preschoolers. Since these subtests match environment with genetic potential so young, they would be an ideal measure (for, say, 5-year-olds) of genes for intelligence.
From pages 53-54 of Does Your Family Make You Smarter? by James Flynn
In other words, Type 2 tests measure “novel problem solving”, while type 1 tests measure acquired abilities. A more provocative interpretation is type 2 tests measure real intelligence, while type 1 just measure knowledge and experience. This is the age-old distinction between aptitude tests vs achievement tests, culture fair vs culture loaded, fluid vs crystallized.
And yet Flynn largely rejects Cattell-Horn-Carroll’s theory that fluid ability (novel problem solving) is invested to acquire crystallized ability (accumulated knowledge) writing:
…fluid skill is just as heavily influenced by family environment as the most malleable crystallized skill (vocabulary) and therefore, neither skill deserves to be called an investment and the other a dividend.
From page 132 of Does Your Family Make You Smarter? by James Flynn
Flynn of course is referring to the greatest irony in the history of psychometrics and the biggest mistake of Arthur Jensen’s career: the Raven Progressive Matrices (long worshiped by Jensen and Jensenistas as the most culture fair measure of pure intelligence ever invented) is a type 1 test!
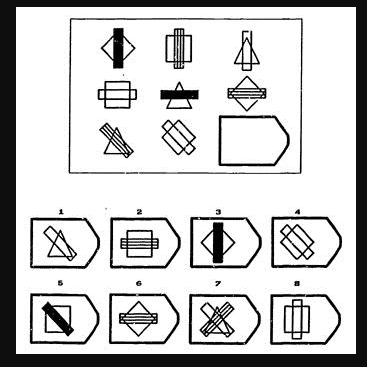
Which of the 8 choices completes the above pattern? Image from from Carpenter, P., Just, M., & Shell, P. (1990, July)
But let’s not throw the baby out with the bath water. There’s no need to abandon CHC investment theory just because a major test got mischaracterized. But at the same time, it doesn’t feel right to reclassify the Raven as a crystallized test, Research is needed to understand why the Raven is so culturally sensitive when it superficially looks like a measure of novel problem solving. Is it measuring some kind of implicit crystallized knowledge we’re not conscious of like being familiar with patterns, columns and rows and reasoning through the process of elimination, or are the family effects on the non-cognitive part of the test (having the motivation to persist and concentrate on such an abstract task). Flynn argues that the brain is like a muscle, but if so, the Raven is an exercise most have never done before, so why isn’t it a type 2 test?
Flynn might argue that if your family helped you with abstract problems in algebra or had philosophical discussions about hypothetical concepts, you’ve been exercising for the Raven all your life, but this seems like a bit of a stretch. All the research shows that cognitive training has narrow transfer (i.e. practicing chess will only make you slightly better at checkers, and not at all better at scrabble) though perhaps the Raven’s uniquely abstract (general) nature allows it to slightly buck this trend.
Modern IQ tests force test scores to fit a normal distribution, but I’ve long suspected the distribution of intelligence is anything but normal. After all, if you look at the distribution of wealth and income (a crude measure of intelligence), you find the richest people are worth millions of times more than the poorest. And that’s just because they’re not paying their fair share, as Elizabeth Warren would have us believe. We see the same skewed distribution in academic output, with the most productive scientists publishing orders of magnitude more than the least productive.
A member of Prometheus society once hypothesized that the human mind works in parallel, so that complex problem solving speed doubles every 10 IQ points (he later suggested 5)?
And yet at the same time, Arthur Jensen seemed to believe intelligence was normally distributed and in support of this cited cognitive measures that form a natural scale with equal intervals and a true zero point such as the total number of words a person knows or the number of digits they can repeat after one hearing, both of which were normally distributed. What was missing however from Jensen’s examples was complex on-the-spot problem solving.
Thanks to my research on how people today would score on the oldest Wechsler tests (the ancient WBI) I have some novel data on how long it takes people to solve visuo-spatial items. The WBI includes a subtest called Object Assembly where you have to fit a bunch of odd shaped cardboard cutouts together to make a familiar object, and over the past decade or so, this was administered to a relatively random sample of White young adults (n = 17). One seven piece item was easy enough that all 17 were able to complete it within the 3 minute time limit, yet hard enough that no one could solve it immediately.
Normally I wouldn’t show items from an actual IQ test, but the WBI is over 80 years old and Object Assembly is no longer part of current Wechsler subtests.
[update april 1, 2020, I decided to remove the photos to be safe, but it’s too bad because those were gorgeous photos I took]
When one test participant saw these cardboard cutouts being placed on the table, he apologized for being unable to contain his laughter. A painful reminder that my life’s work is considered a joke by much of the population. And yet for all their apparent absurdity, these silly little tests remain the crowning achievement of social science with one’s score being largely destiny .
Even on this one item, there seemed to be a correlation between IQ and occupation/education. The time taken to complete the puzzle ranged from 14 seconds (a professional with a Masters degree in Engineering from a top Canadian university) to a 137 seconds (a roofer with only a high school diploma). Below are the times of all 17 participants ranked from fastest to slowest.
In a normal distribution, 68% fall within one standard deviation of the mean. In this distribution, 71% fell within one standard deviation of the mean (22 to 82 seconds) which is pretty damn close. Also in a normal distribution, 95% fall within two standard deviations (-8 to 112 seconds) and in my sample, 94% did (even closer!).
So simply by picking at least a moderately g loaded novel problem that is both easy enough that no one gives up, yet hard enough that everyone is forced to think, and measuring performance on a natural scale (time taken in seconds) a normal curve emerges, though a somewhat truncated one (the slowest time is much further from the mean than the fastest, perhaps because human hands can only assemble puzzles so fast, regardless of how quick the mind is).
To convert from time in seconds to IQ, all one needs to do is make the natural mean of 52 seconds equal to the IQ mean of 100, and make each natural standard deviation (30 seconds) faster or slower than 52 seconds, equal to 15 IQ points (the IQ standard deviation) above or below 100, respectively.
Thus the elite Masters degree in Engineering professional gets an IQ of 119 (14 seconds) and the high school only roofer gets an IQ of 58 (137 seconds). But note that even though IQ appears to be a true interval scale (meaning an X point gap between any two points on the IQ scale are equivalent), it is not a ratio scale, meaning IQs can not be meaningfully multiplied. So even though IQ 119 is about twice as high as IQ 58, the difference in actual problem solving speed is about an order of magnitude. This is because unlike height, weight and time in seconds to solve puzzles (which can be meaningfully multiplied) the IQ scale has no true zero point.
Of course the normal curve only applies to the biologically normal population, so it’s interesting to note that it’s now standard procedure to exclude pathological cases from IQ test norming samples. Indeed one man was excluded from my sample after he told me that years ago he had suffered a stroke (quite unusual for a man in his thirties). This man struggled greatly with the above puzzle, only joining 25% of the cuts within the 3 minute time limit. The only way to estimate what his time would have been had he not given up is divide 3 minutes by 25% which gives 12 minutes (720 seconds). This is more than 22 standard deviations slower than the mean of the normal sample, and equivalent to an IQ of -234! Such extreme deviations remind us how sensitive the normal curve is to the normality of the sample.
*one person solved the puzzle in 67 seconds, but the ear pieces were reversed, so only 75% of the cuts were correctly joined. I thus considered this equivalent to a perfect performance at 75% of the speed (67 seconds/0.75 = 89 seconds).
Have you ever wondered why we have to go all the way to Africa to see a safari? For Africa is the land of 13000 lb elephants and 18 foot tall giraffes.
But what many do not realize is that 40,000 years ago, the whole World looked like an African safari. North America and Eurasia were home to Pachystruthio dmanisensis, a flightless bird that stood 11.5 feet tall and weighed nearly a 1000 lbs.
North America was also home to the short-faced bear which stood up to 14 feet tall, weighed about 1700 lbs, and could run up to 40 miles per hour. And of course who could forget the 13000 lb mammoth, which lived on every continent except Australia.
Scientists call these giant animals “megafauna” (mega = big, and fauna = animals). We still have megafauna in the world, but there used to be a whole lot more of it. In fact, it appears that having a large number of large-bodied animals in an ecosystem is actually the normal state for our planet, at least for the geologic era we are living in today, the Cenozoic (or “Age of Mammals”) . But sometime in the past 50,000 years (very recent geologically), everywhere except for Africa, most of those large animals became extinct. And we still aren’t sure why!
Some scientists think megafauna survived in Africa because humans evolved there so large animals had more time to adapt to us. However members of the genus Homo have been living outside Africa for 2 million years, so Eurasian megafauna had time to adapt to us too. Another theory is that megafauna were killed off by the extreme climate changes that megafauna endured outside Africa.
But in asking why megafauna went extinct everywhere except Africa, politically correct scientists are forced to ignore the elephant in the room (pun intended): HBD. If Arthur Jensen was correct about the black-white IQ gap being genetic, perhaps Africans simply hadn’t evolved the intelligence to hunt large game.
But that can’t be the whole story. If racial differences in IQ evolved because we needed more intelligence to survive the non-tropics, how were Australian aboriginals (who retain a tropical phenotype) able to kill off 100% of their giant mammals? Migrating from Africa to Australia means their ancestors must have spent some time in the non-tropical ice age Middle East. Was this enough time for them to evolve the intelligence to hunt big game or was the big game in Australia simply easier to hunt because it had not had the time to evolve ways to avoid humans?
If cold climate selected humans were especially evolved for hunting big game, and if the big game on continents where humans had never been were especially bad at evading human predators, then these two factors predict the biggest megafauna massacre of all should have occurred in the Americas where both conditions were met: cold adapted hunters (humans entered the Americas from Siberia) entering a continent where humans had never been.
And indeed that seems to be the case. Paleo-biologist Rebecca Terry at Oregon State University says “pretty advanced weaponry was definitely present, and the extinctions in the New World in North America and South America were really extreme as a result.”
11,000 years ago (shortly after modern humans entered the New World), the average weight of a non-human mammal in North America was about 200 pounds compared to only 15 pounds today.