North American IQ: circa 1937 to circa 2014

Tags

, , , , , ,

The Flynn effect, popularized by James Flynn, refers to the fact that IQ tests supposedly get easier with time. Although by definition the average IQ of American or British (white) people is always 100, the older the IQ test, the easier it is to score 100. Thus to keep the average at 100, tests like the Wechsler must be renormed every 10 years or so, otherwise the average IQ would increase by about 3 points per decade.

Although scholars continue to debate whether the Flynn effect reflects a genuine increase in intelligence (perhaps caused by prenatal nutrition or mental stimulation) or just greater test sophistication caused by modernity, there’s been remarkably little skepticism about the existence of the Flynn effect itself.

Malcolm Gladwell writes:

If an American born in the nineteen-thirties has an I.Q. of 100, the Flynn effect says that his children will have I.Q.s of 108, and his grandchildren I.Q.s of close to 120—more than a standard deviation higher. If we work in the opposite direction, the typical teen-ager of today, with an I.Q. of 100, would have had grandparents with average I.Q.s of 82—seemingly below the threshold necessary to graduate from high school. And, if we go back even farther, the Flynn effect puts the average I.Q.s of the schoolchildren of 1900 at around 70, which is to suggest, bizarrely, that a century ago the United States was populated largely by people who today would be considered mentally retarded.

While few people believe our grandparents were genuinely mentally retarded, it’s taken for granted that they would have scored in the mentally retarded range by today’s standards.

But is this true? I began having doubts over a decade ago when I examined the items on the first Wechsler intelligence scale ever made: the ancient WBI (Wechsler Bellevue intelligence scale). Meticulously normed on New Yorkers in the 1930s, this test remains far and away the most comprehensive look we have at early 20th century white North American intelligence, and while some of the subtests looked easy by today’s standards, others, especially vocabulary, looked harder.

The Kaufman effect

What also struck me was how little instruction, probing or coaching people got when taking the ancient WBI, compared to its modern descendant the WAIS-IV. This matters a lot because the way the Flynn effect is calculated on the Wechsler is by giving a new sample of people both the newest Wechsler and its immediate predecessor, in random order to cancel out practice effects, and then seeing which version they score higher on. If they average 3 points lower on the WAIS-IV normed in 2006 than on the WAIS-III normed in 1995, it’s assumed IQ increased by 3 points in 11 years.

The problem with this method (as Alan Kaufman may have discovered before me) is that the subset of the sample that took the newer version first has a huge advantage on the older version compared to the norming sample of the older test (over and above the practice effect which is controlled for), because the norming sample of the older test was never given coaching and probing.

Statistical artifact

A Promethean once said maybe the Flynn effect is just a statistical artifact of some kind. He never told me what he meant, but it got me thinking:

One problem with how the Flynn Effect is calculated on the Wechsler is that it’s assumed that gains over time can be added. For example it’s assumed that you can add the supposed 7.8 IQ gain from WAIS normings 1953.5 -1978 to the 4.2 IQ gain from normings 1978 – 1995 to the 3.7 IQ gain from normings 1995-2006, for a grand total of 15.7 IQ points from normings 1953.5 – 2006.

This would make sense if he were talking about an absolute scale like height, but is problematic when talking about a sliding scale like IQ. For example, suppose the raw number of questions correctly answered in 1953.5 was 20 with an SD of 2. By 1953.5 standards, 20 = IQ 100 and every 2 points = 15 IQ points above or below 100. Now suppose in 1978, people averaged 22 with an SD of 1. That’s a gain of 15 IQ points by 1953.5 standards. Now suppose in 1995 people average 23 with an SD of 2. That’s a gain of 15 IQ points by 1978 standards. Adding the two gains together implies a 30 point gain from 1953.5 to 1995, but by both 1953 and 1993 standards, the difference is only 23 points.

Changing content

Another problem with studying the Flynn effect is the content of tests like the Wechsler is constantly changing. This is especially problematic when studying long-term trends in general knowledge and vocabulary. If words that are obscure in the 1950s become popular in the 1970s, then people in the 1970s will score high on the 1950s vocabulary test. Meanwhile the 1970s vocabulary test may contain words that don’t become popular until the 1990s, Thus adding the vocabulary gains from the 1950s to the 1970s to the gains from the 1970s to the 1990s, might give the false impression that people in the 1990s will do especially well on a 1950s vocabulary test, when in reality, many words from the 1950s may have peaked in the 1970s and are even more obscure in the 1990s than they were in the 1950s.

An ambitious study

Given the Kaufman effect, the statistical artifact, and changing content, I realized the only way to truly understand the Flynn effect is to take the oldest quality IQ test I could find and replicate its original norming on a modern sample.

In 2008 I made it my mission to replicate Wechsler’s 1935-1938 norming of the very first Wechsler scale. Ideally I should have flown to New York where Wechsler had normed his original scale, but if Wechsler could use white New Yorkers as representative of all of white America (WWI IQ tests showed white New Yorkers matched the national white average), I could use white Ontarians as representative of all of white North America (indeed white Americans and white Canadians have virtually the same IQs). The target age group was 20-34 because this was the reference age group Wechsler had used to norm his subtests.

It took over a decade but I was gradually able to arrange for 15 randomly selected white young adults to take the one hour test. They were non-staff recruited from about half a dozen fast food locations in lower to upper middle class urban and suburban Ontario. The final sample was not perfectly representative of white North America (they were a bit less educated and much less female) and testing conditions were not optimum (environments were sometimes noisy, at least one person had a few beers before testing; another was literally falling asleep during the test) and 15 people is way to small a sample to draw statistically significant conclusions about 11 different subtests. One man with a conspicuously low score was removed from the sample because he had suffered a stroke.

Nonetheless, the below table shows how whites tested in 2008 to 2019 compared to Wechsler’s 1935-1938 sample, with the last column showing the expected scores of the 21st century sample, extrapolating gains James Flynn calculated from 1953.5 to 2006 (see page 240 of his book Are We Getting SMARTER?) to the current study: circa 1937 to circa 2013.5.

Note: the 11 subtests were scaled to have a mean of 10 and an SD of 3 in the original young adult norming sample, while the verbal, performance and full-scale IQs were scaled to have a mean of 100 and an SD of 15. Note also that vocabulary is alternate test, not used to calculate either verbal or full-scale IQ on the WBI. One third of my sample did not take Digit Symbol so for these, Performance and full-scale IQs were calculated via prorating.

 
Test: Nationally representative sample of young white adults (NY, 1935 to 1938) Randomish sample of young white adults (2008 to 2019, ON, Canada) Expected WBI scores in 2008-2019 based on Flynn’s calculated rate of increase
Information (general knowledge test) 10 (SD 3) 8.07 ( SD 2.6) 12.3
Similarites (verbal abstract reasoning) 10 (SD 3) 12.93 (SD 2.94) 15.54
Arithmetic (mental math) 10 (SD 3)

7.2 (SD 3.78)

(this subtest contained a unit conversion item that seemed biased against Canadians)

11.02
Vocabulary 10 (SD 3) 8.73 (SD 2.6) 14.95
Comprehension (Common sense & social judgement) 10 (SD 3) 9.33 (SD 3.2) 13.93
Digit Span (attention & rote memory) 10 (SD 3) 9.47 (SD 2.23) 11.46 
Picture Completion (visual alertness) 10 (SD 3) 10.47 (SD 3.16) 14.52
Picture Arrangement (social interpretation) 10 (SD 3) 9.8 (SD 2.54) 13.35
Block Design (spatial organization) 10 (SD 3) 12.53 (SD 3.07) 12.91
Object Assembly (spatial integration) 10 (SD 3) 11.47 (SD 1.77) 14.06
Digit Symbol (Rapid eye-hand coordination) 10 (SD 3)

10.8 (SD 2.82)

(note: only 10 of the 15 subjects took this subtest)

14.66

Verbal IQ

100 (SD 15) 99.8 (SD 14.46)  
Performance IQ 100 (SD 15) 106.47 (SD 12.11)  
Full-scale IQ 100 (SD 15) 103.4 (SD 13.63) 122

Conclusion

The Flynn effect is dramatically smaller than we’ve been led to believe, at least on tests of specific information that may become obscure over generations. By contrast certain verbal skills (categorizing) and spatial analysis have indeed increased by amounts comparable with Flynn’s research. It’s unclear if these are nutritional gains caused by increasing brain size, neuroplastic gains caused by cultural stimulation, or mere teaching to the test caused by schooling, computers and brain games.

Increasing U.S. head size: 1946 to 2012

Tags

, ,

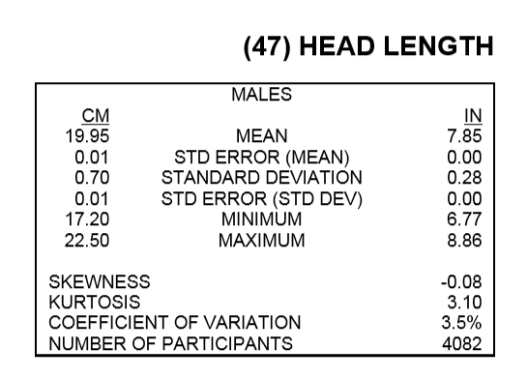
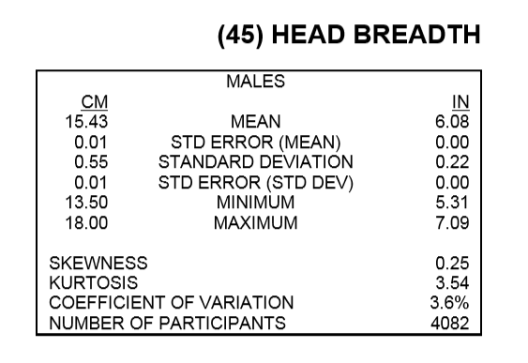
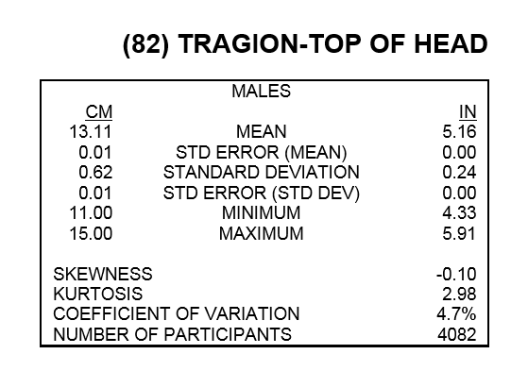
In THE BODY SIZE OF SOLDIERS _ U.S. Army Anthropometry-1966 is some craniometric data from 1946 (and 1966):

Meanwhile in 2012 ANTHROPOMETRIC SURVEY OF U.S. ARMY PERSONNEL: METHODS AND SUMMARY STATISTICS we get comparable stats from 2012:

headcircumferenceusmen2012
headlengthmale2012
headbreadthmen2012
headheightmen2012

Discussion

By 1946 standards,adult male U.S. head circumference, head length, head breadth and head height increased by 0.5, 0.64, 0.39 and 0 standard deviations (SDs) respectively.

Using Lee & Pearson’s formula for guessing cranial capacity from external head size measurements, volume increased from 1456 cc to 1499 cc, an increase of about 0.47 SD in 66 years.

However the true increase is likely larger, because in 1946 there was a draft so the upper class (who have bigger heads) were represented in the army. In 2012, not so much.

Also, changing U.S. demographics, particularly immigration from poorer countries where people are smaller, would negate some of the increase in the non-immigrant population.

Creepy scene on HBO’s Euphoria

Tags

, ,

HBO has already given us the best TV show of all time (six feet under) and the best documentary of all time (Leaving Neverland) and now it strikes again with one of the best teen dramas of all time (Euphoria),.

Teen dramas have really changed a lot since I watched Dawson’s Creek in high school. This is much edgier, much more diverse, and much darker. Unlike the lilly white wholesome Dawson of my generation, the main character on this show Rue, is like a female Melo (see the comment section), a mixed race bad-ass who has sex with whites, dances to rap, and is not afraid to play hardball. She looks like she may have been cast by the show’s executive producer Drake.

Rue’s white drug dealer is very protective of Rue and thinks of her as his baby sister. So when the tall popular white jock blackmails Rue’s best friend, the drug dealer is having none of it. Even though the jock laughs in the drug dealer’s face and calls him “half-a-retard”, you can tell he’s spooked.

We’re so used to seeing the tall popular jock get his way by beating and blackmailing others, that to see this “half-a-retard” threaten him had me cheering from the couch.

Obviously dialogue on these shows is not meant to be over-analyzed or taken too literally, but what exactly is “half-a-retard”? I interpret it as someone who is roughly half way between average (IQ 100) and “retarded” (IQ below 70) intelligence, or someone who would score below 70 on only half the Wechsler scale (i.e. either the verbal half or the non-verbal half, but not both).

You might say the drug-dealer’s IQ is impaired by drugs and not genetically low, but because those with low genetic ability are more likely to end up on drugs, they serve to exaggerate cognitive inequality, while maintaining the genetic rank order. IQ after all is not an absolute score, but a ranking of where one stands compared to others of his generation and as we become adults, the absolute difference between ranks widens while inter-rank mobility remains limited.

Wechsler full-scale IQ vs General Ability Index

Commenter illuminaticatblog wanted me to comment on his his most recent Wechsler intelligence test scores:

Illuminaticatblog is a treasure trove into the long-term stability of the Wechsler scales because he’s been tested so many times.

One thing that jumps out about his scores is that you see a large 15 point gap (a full standard deviation) between his General Ability Index and his Full-Scale IQ.

Both scores are intended to summarize a person’s intelligence level, but the GAI excludes certain cognitive functions that are considered unfair to neuro-atypicals such as Working Memory and Processing Speed.

Which of the two scores you want to go with depends on your definition of intelligence. I define intelligence as the adaptability to use whatever body and environment you’re in to get whatever you want, and since working memory and processing speed have huge adaptive value, I prefer the full-scale IQ, since it includes them.

Indeed my income and occupational status depend deeply on processing speed. I have a government job where after negotiating with clients, I must rapidly type reports full of facts and figures. The faster I can type, decide, and retain stats in short-term memory, the higher my productivity and the more likely I am to get my lucrative contract renewed. Half my job is like one long Digit-Symbol subtest, though physical energy can be just as important as cognition. I’ve found myself cutting carbs to stay alert and pan-handling pink caffeine pills from a co-worker.

This blog attracts a lot of high IQ people, but it also attracts a lot of neuro-atypicals, which is why commenters tend to score higher on the SAT than on more holistic tests like the Wechsler. I also suspect commenters here in general would do better on GAI than full-scale IQ.


When IQ is destiny: the sad case of Kenny Countie

As I’ve mentioned before, one of the reasons I find IQ so fascinating is that the woman who tested me as a child (a South Asian woman clad in traditional Indian garb) looked like a fortune teller.

Because teachers were not qualified to administer the Wechsler intelligence scales, the Indian woman would drive for hours in the fierce winter blizzards, wearing sandals in the snow, to schools in the middle of old country roads leading to nowhere, just to test a single child., who she would escort to in my case a brick room in the back of the resource room with a circular table, where out of her orange fluorescent folder poured a never ending series of jig-saw puzzles, colorful blocks, and cartoon stories about black kids on tarot like cards, all as her stop clock would tick loudly.

And then she would vanish, and test scores would be locked in the filing cabinet of the school’s dark basement, collecting dust for decades.

Unlike the SAT which is actively shapes a person’s destiny, official IQ tests like the WISC-R simply predicted it.

One such child whose destiny was predicted by an IQ test, was Kenny Countie.

County was an incredibly gifted athlete, and a popular outgoing young man with many friends. But he had a very low IQ, and sadly, IQ is often destiny.

Like me he joined the army reserves as a young man, but after being honorably discharged, he began dating an older wealthy woman who asked him to live with her on her gorgeous and luxurious farm.

At the time people thought “just goes to show IQ is NOT destiny. Despite his low IQ, Kenny has won the game!”

But his mother knew better. Who was this mysterious woman who was taking over her son’s life? Kenny had depended on his mother for everything, and now they had completely lost contact as he lived in the remote country.

A few months later he was spotted at Walmart in a wheelchair, badly bruised, being pushed around by the mysterious older woman.

Finally his mother had enough. She went to the farm, confronted the older woman and demanded to know where her son was.

“He’s over there” said the older woman, pointing to a garbage bag full of flesh and bones.

It was a moment his mother would never recover from. Her innocent loving trusting son naively thought he had won the good life when he was invited to the farm to live with his new girlfriend, but instead was sacrificed to fulfill her sadistic desire to dominate vulnerable men.

It’s one thing for some childhood IQ test to have told her that her son would grow up to be disposable, but quite another to have him literally end up in a garbage bag and at the age of only 24.

Generally speaking, IQ is destiny.

Marianne Williamson

Tags

, , ,

Black nationalal merit finalist GondwanaMan wanted me to write about Democratic presidential candidate Marianne Williamson.

While much of America is just discovering this woman for the first time (she was the most googled candidate at the end of June), longtime Oprah fans have known of this woman for decades.

In 1992 she published a book called A Return to Love. Oprah was so inspired by it that she went out and bought 1000 copies, and soon her audience was also buying it in droves, making it a massive bestseller.

In 2001 Williamson appeared on Oprah’s show immediately after 9/11. While the establishment wanted war with Afghanistan, Oprah and Williamson were virtually the only public figures urging restraint.

It was great to see two of the most intelligent and spiritually evolved voices in the subject coming from women.

Had America listened to these two brilliant women, it could have avoided the longest war in the country’s history.

It is interesting to ask what Williamson’s IQ is.

Although her cranial capacity is much smaller than Oprah and Chris Langan ‘s, she was Oprah’s spiritual guru and has a Langian type philosophy, calling the universe self-organizing and self-correcting.

What she lacks in brain size, she may makeup for in high IQ Ashkenazi genes allowing her to punch above her brain weight.

On the other hand, she sounds kind of flaky in the first Democratic debate, talking about how she’s going to defeat Donald Trump with “love”. Rhetoric that works well on a new agey daytime talk show does not always translate to more political forums and Williamson has yet to adapt.

Tales of the City on NETFLIX

Tags

, , , , ,

pumpkinperson rating: 7/10

Tales of the City is a provocative series about a group of gays in San Francisco, one of whom is a genetic superior.

The genetic superior is lesbian but her girlfriend transitioned into a man, causing great confusion in the relationship.

The genetic superior (right) has a far larger cranial capacity than the boyfriend (left) who used to be her girlfriend.

Although the genetic superior wants to be open-minded, woke and supportive of her girlfriend becoming a man, deep down she wishes he was still a she, and so the two break up.

Sensing an opportunity, an older very wealthy bisexual woman gets naked in the Jacuzzi, hoping the genetic superior will take an interest.

She does:

Later that day, the older woman gets a knock on the door of her mansion. When she opens, it’s the genetic superior who grabs her and passionately kisses her.

The older woman is older not just as an individual, but also as a race, since Caucasoid morphology appears in the fossil record earlier than the new and improved skulls known as Mongoloid do.

Aside from the genetic superior, the show has little racial diversity, aside from a somewhat black gay guy who looks like a young Obama.

The black guy is dating an older white man who takes him to dinner with his older white friends. This turns out to be a huge mistake when the black guy tries to lecture his elders that the term “tranny” is politically incorrect.

An older gay is furious that the young black would dare lecture them about political correctness, because they were the generation that fought for the very gay rights he now enjoys, the generation that saw half their friends die of AIDs, so how dare this young kid sit on his politically correct high-horse and try to police their vocabulary.

Humiliated by the backlash, the black storms out of the house and feels betrayed than his older boyfriend did not defend him.

Oprah surprises superfan in Montreal

Tags

, , ,

Oprah was in classy Montreal last week and she surprised a school teacher who is such a huge fan, she incorporates Oprah’s teachings into her lesson plan.

Most celebrities kind of take it for granted when fans gush about how much the celeb means to them, but Oprah actually listens earnestly, perhaps because Oprah attracts high quality fans: white suburban women-the crown jewel of the white race.

Meanwhile on Friday Bill Maher argued that if Oprah were to run for president in 2020, she’s the ONLY Democrat who could definitely beat Trump.

Testing Stephen Jay Gould’s drunkard’s walk hypothesis

[the rules of this game were updated on June 22, 2019, to prevent zero scores]

Below is a list of people who have commented on this blog. Each person will represent a life form that started 3.5 billion years ago. All started with a complexity score of 1 which is the lowest level of complexity.

Now once a day the computer will randomly pick a number from -1 to +1 for each of you, that will be added to your scores. Since evolution would never select for zero complexity, any score that falls below 1 just remains at 1 by default. If your score hits 100, you’ve evolved into a complex multi-cellular oganism.

Every day the average score of all survivors will be recorded to see how the mean increases over time. The purpose of this exercise is to test Stephen Jay Gould’s claim that random variation leads to increasing complexity when you start near zero and have nowhere to go but up.

Obviously mean complexity will increase at first, but for how long can it continue? We shall see.

These numbers will be updated daily:

mikey blaze 3

Loaded 1

G-man 2

caffeine withdrawals 2

billy 4

illuminaticatblog 1

pumpkinperson 4

pumpkinhead 6

Rahul 4

social justice warrior 1

mug of pee 5

melo 2

marsha 1

race realist 5

james thompson 2

name 3

thinking mouse 3

Hippopotamusdrome 6

richard harper 2

akarlin 2

Munchkin Person 4

bruno 7

deal with it 3

June 21, 2019: mean 1, median 1, mode 1, lowest 1, highest 1, SD 0

June 22, 2019: mean 1.35, median 1, mode 1, lowest 1, highest 2 , SD 0.49

June 23, 2019: mean 1.52, median 1, mode 1, lowest 1, highest 3 , SD 0.73

June 24, 2019: mean 1.70, median 2, mode 1 & 2, lowest 1, highest 3 , SD 0.70

June 25, 2019: mean 1.91, median 2, mode 1, lowest 1, highest 4, SD 0.97

June 26, 2019: mean 1.83, median 2, mode 2, lowest 1, highest 5, SD 0.94

June 27, 2019: mean 1.78, median 1, mode 1, lowest 1, highest 6, SD 1.24

June 28, 2019; mean 1.96 median 2, mode 1, lowest 1, highest 5, SD 1.22

June 29, 2019: mean 2.04 median 2 mode 1 lowest 1 highest 6 SD 1.33

June 30, 2019: mean 2.08, median 2 mode 1 lowest 1 highest 6 SD 1.35

July 1, 2019: mean 2.43, median 2, mode 2, lowest 1, highest 6, SD 1.34

july 2 2019 mean 2.87 median 2 mode 1, 2 & 4 lowest 1 highest 7 SD 1.71

july 3 2019 mean 3.17 median 3 mode 2 lowest 1 highest 7 sd 1.75

Is evolution progressive?

Tags

, , ,

Paleontologist Dale Russell believed that had dinosaurs not gone extinct, they would have evolved into big brained bipeds very similar to us

In a trivial sense, almost everyone agrees that evolution is progressive in some ways. The average life form on Earth today is far bigger, more complex, more intelligent and more beautiful than the average life form 3.5 billion years ago, when life began.

However this does not prove that evolution favors more complex organisms because they’re superior, which is what is truly meant by evolutionary progress. It could just be that it takes time for complex life to evolve, and since life started with minimal complexity, it had nowhere to go but up.

Stephen Jay Gould uses the analogy of a drunkard’s walk. Gould’s anology is explained by Robert Wright:

A drunk is heading down a sidewalk that runs east-west. Skirting the sidewalk’s south side is a brick wall, and on the north side is a curb and a street. Will the drunk eventually veer off the curb, into the street? Probably. Does this mean he has a “northerly directional tendency”? No. He’s just as likely to veer south as north. But when he veers south the wall bounces him back to the north. He is taking “a random walk” that just seems to have a directional tendency.

If you get enough drunks and give them enough time, one of them may eventually get all the way to the other side of the street. That’s us: the lucky species that, through millions of years of random motion, happened to get to the far north, the land of great complexity. But we didn’t get there because north is an inherently valuable place to be. If it weren’t for the brick wall—that is, the fact that no species can have less than zero complexity—there would be just as many drunks south of the sidewalk as north of it, and the randomness of all their paths would be obvious. Gould writes, “The vaunted progress of life is really random motion away from simple beginnings, not directed impetus toward inherently advantageous complexity.”

The problem with this metaphor is how far North does the drunk need to get before the wall no longer explains his progression? If you found 100 drunks that were all 100 miles North of the wall and came back a month later and found those same drunks were now on average 200 miles North, then obviously something other than the wall is moving them North because once you get 100 miles North, the odds of randomly stumbling 100 miles South are like the odds of flipping a coin and getting 100 consecutive heads.

So Gould’s argument can plausibly explain why single cellular organisms evolved into multi-cellular organisms, but it can’t seem to explain why organisms that are already 100 miles North of the wall also show increasing complexity.

Paleontologist Dale Russell (1989) found that the encephalization quotient (ratio of brain weight to expected brain weight for body size) of mammals more than tripped in 65 million years of evolution. It seems extremely unlikely that this tripling can be explained by Gould’s “no where to go but North” metaphor because brain size can certainly decrease in size, and even vanish all together.

On the other hand, there might be a survivor bias in Russell’s dataset in that the descendants of those mammals that decreased their brain size are no longer considered mammals, leaving only bigger brained mammals in the sample.

What is needed is a study that compares the brain size of extinct animals with the brain size of their living descendants. If most of the latter are bigger brained than most of the former, then Gould’s metaphor is debunked, and evolution really is progressive.