• About

Pumpkin Person

~ The psychology of horror

Pumpkin Person

Category Archives: Uncategorized

Was the World’s strongest man, from 1938 to 1953, black?

10 Wednesday Aug 2016

Posted by pumpkinperson in Uncategorized

≈ 43 Comments


220px-john_davis_weightlifter

I recently posted evidence that in the U.S., the average black can out-bench press the average white, and that blacks dominate elite body building.  Despite this evidence, many readers insist that whites are stronger than blacks because of their muscle fibres and because no black has ever won the World’s strongest man competition.

However I recently stumbled upon an article from the May 7, 1984 issue of Jet magazine which claims that from 1938-1953, a black named John Henry Davis was known as the World’s Strongest Man.

strong

According to The Complete Encyclopedia of African American History (page 717), in 1948:

The first black heavyweight lifting champion in the Olympics was John Davis, of Brooklyn.  He had thoroughly established himself in the field in 1941 when he set a record of 1,005 pounds for three lifts.  Davis was Olympic champion again in 1952.  Once called “the world’s strongest man,” he was the first weightlifter known to hoist 400 pounds over his head, a feat he accomplished in the 1951 National AAU senior championship in Los Angeles.


Share this:

  • Share on X (Opens in new window) X
  • Share on Facebook (Opens in new window) Facebook
Like Loading...

Which race is physically strongest?

08 Monday Aug 2016

Posted by pumpkinperson in Uncategorized

≈ 125 Comments

A video of big brained Oprah arm wrestling Jewish Rosanne Barr:

According to HBD, blacks are the most masculine, aggressive and athletic race, so I was surprised to discover a large subset of HBDers (on the internet) who believe whites are stronger than blacks.

One reason they believe this is because of Allen’s Rule, a theory claiming that body types evolve to become more linear in warm climates and more rounded and compact in cold climates. Round forms, having smaller surface area to volume ratios, are thought to freeze less easily. There’s also Bergmann’s Rule which asserts, for similar reasons, that body size evolves to be large in cold climates and small in warm climates.

Thus, it’s assumed that blacks evolved to be tall and small (good for warm climates) while whites evolved to be short and big (good for cold climates).  A short and big physique is then presumed to be good for weight-lifting.

The problem with this view is it’s too simplistic.  Allen’s Rule and Bergmann’s Rule are not the only factors that influence the evolution of physique.  There’s also Rushton’s rule, which argues cold climates select for less masculine, dominant and sexual traits.

One reason Allen’s rule makes sense to people is their image of black physiques comes from Third World African countries where malnutrition is rampant.  Of course people in those countries are especially skinny, but when you compare blacks and whites reared in the same country, blacks are heavier, despite being a bit shorter.

The average male American white age 20-39 is 70.4 inches tall and 193.5 lbs.

The average male American black age 20-39 is 70.1 inches tall and 202.4 lbs.

See table 6 and table 12.

The average black American can bench press more than the average white American

Of course weight and strength are not the same thing.  In order to compare the races in strength, I found a study of police officers which compared the bench pressing ability of black and white officers, both at the time they were recruited, and after years on the job.  The study found that upon recruitment, the average white man could bench press 84.2 kg (standard deviation = 21.2), the average black could bench press 95.1 kg (SD = 24.6).  In other words, black men are 0.51 SD stronger than white men.  If we convert strength to farmilliar IQ scale, where the white mean is set at 100 and the white SD is set at 15, then white men have a (sex adjusted) SQ (Strength Quotient) of 100, and black men have an SQ of 108.

Both races improved after years of on the job training, but the gap remained.  Black women could also bench press more than white women, both at recruitment, and especially after training in both groups.

Blacks dominate American body building

What happens when we move from the average and look at the extremes? Here’s a list of the top 15 body builders of all time.  For apples to apples comparison, I excluded all the non-Americans, to make a list of the top AMERICAN body builder’s of all time:

1. Ronnie Coleman (Black)
2. Arnold Schwarzenegger (White)
3. Kai Greene (Black)
4. Phillip Health (Black)
5. Flex Wheeler (Black)
6. Johnnie O. Jackson (Black)
7. Lee Haney (Black)
8. Lou Ferrigno (White)
9. Kevin Levrone (Black)

So blacks are only 12.6% of America, but 78% of the top body builders in American history.  And this is what we should expect.  The nature of the bell curve is such that if black men are 8 points higher than white men in SQ, they should be dramatically overrepresented among those with the most extreme SQs.  This is analogous to how American Jews (with IQs 10 points higher than U.S. whites) are greatly overrepresented among Nobel Prize winners.

World’s Strongest Man

There is a major anomaly however.  As blogger Racerealist told me, nine Americans have won the World’s Strongest Man competition, and not a single Black was among them.  Indeed not a single Black has won from any country.

If the average black is stronger than the average white, and if top black body builders outcompete top white body builders, why has there not been a single black among the World’s Strongest men winners?

There are several possibilities:

1) It’s just a statistical anomaly caused by small sample size.  Most well nourished blacks live in America, and only 9 Americans have won.  Once 20 Americans have won, we might see several blacks included.

2) The average white is weaker than the average black, but there might be certain white ethnic groups that are especially strong

3) whites have lower mean strength but might have a greater standard deviation; however the police study above did not find this, and it fails to explain why black dominate body building

4) whites dominate strongest man competitions because they’re not athletic enough to do anything else, while the strongest blacks play lucrative sports like boxing, football and basketball instead.

Share this:

  • Share on X (Opens in new window) X
  • Share on Facebook (Opens in new window) Facebook
Like Loading...

50% of American adults can’t read an 8th grade book

21 Tuesday Jun 2016

Posted by pumpkinperson in Uncategorized

≈ 24 Comments

According to this source, 50% of American adults can’t read an 8th grade book.  Since the 50th percentile of American IQ is average IQ; about 100 (U.S. norms; 97 U.S. white norms), then on the IQ scale, 8th grade reading level = IQ 100 (97 on U.S.white norms).

More than 20% of U.S. adults read below the fifth grade level.

Since the 20th percentile of Americans is IQ 88 (U.S. norms; 84 on white norms), then on the IQ scale, 5th grade reading level = IQ 88 (84 on white norms).

From here, we can make simple linear formulas converting reading levels to IQ equivalents:

U.S. norms:

IQ  = 68+4(reading level)

U.S. white norms:

IQ = 62.333+4.333(reading level)


Share this:

  • Share on X (Opens in new window) X
  • Share on Facebook (Opens in new window) Facebook
Like Loading...

Pumpkin Person World exclusive: Muhammad Ali did NOT score IQ 78 on his army test

08 Wednesday Jun 2016

Posted by pumpkinperson in Uncategorized

≈ 30 Comments

The tragic death of boxer Muhammad Ali has inspired much commentary, including from iconic blogger Steve Sailer and National merit finalist ruhkukah who recently said on this blog:

Muhammad Ali, who just passed away, may be one of the best examples of the failure of IQ to capture every aspect of human mental ability. He was one of the most charismatic men of his time, known for his unique verbal facility, in addition to being a great boxer and athlete.

Ali’s actual IQ score: 85 not 78

For decades it’s been reported that Muhammad Ali scored the equivalent of 78 on army testing (I first saw the figure in Daniel Seligman’s 1992 book A Question of Intelligence), but upon doing a bit of research, I realize that everyone has been wrong.  Ali scored at the 16th percentile on the test, which for whatever reason, sources are equating with an IQ of 78, but on a standard scale with a mean of 100 and a standard deviation of 15, the 16th percentile of Americans is actually IQ 85. Someone clearly made a clerical error, and it got repeated over and over and over again. No one bothered to fact check, until now.

Of course these norms include non-whites which tends to inflate them relative to the traditional white normed IQ scale.  On the other hand they exclude women, which deflates the norms.  Since the inclusion of non-whites negates the exclusion of women, Ali likely scored 85 on sex-combined white norms (the traditional IQ scale and the international IQ scale).

However ruhkukah’s point still stands.  Even an IQ of 85 sounds very low for a man as impressive as Ali, but we have to put in perspective.

Average IQ of the subculture boxers are recruited from? About 74

Boxers are generally drawn from the most violent segment of the black underclass, since their job is essentially sanctioned assault.  Thus the population Ali must be compared to is the black incarcerated population, a sample of which had a mean IQ of 78.47 (SD = 8.24) (U.S. norms) on the WAIS-R.  After adjusting for inflated norms (the study was published in 1987 and the WAIS-R was normed in 1978), this becomes a mean IQ of 75.77 (SD = 8.24).  But because the WAIS-R norming included non-whites, the white mean was driven up to 101.4 and the white SD was driven down to 14.65.  Converting to white norms (the traditional standard), where the white mean and SD by definition are 100 and 15 respectively, the black inmates now have a mean of 74 and an SD of 8.44.

Statistically expected IQ of the greatest boxer of his generation: About 85

Americans like Ali, born from 1925 to 1942 are the “Silent Generation” and there were 20 million of them.  Of these, 1.2 million were black males, and of those, given that in the 20th century, about 29% of U.S. black males ended up in jail during their lives, perhaps 348,000 of these 1.2 million black males were part of the tough subculture from which boxers are recruited.

Assuming Ali was the best fighter in this group, he’d be 4.53 SD above them in boxing performance and given the 0.8 correlation between performance and “raw talent”, we’d expect Ali to be 0.8(+4.53 SD) = +3.62 SD above this group in raw kinesthetic ability.

Given the 0.35 correlation between IQ and physical coordination found by the U.S. Department of Labour cited in Seligman’s 1992 book, we’d expect Ali’s IQ to be 0.35(+3.62 SD) = +1.27 SD above his ethno-social class.

This is probably an overestimate given that correlations tend to be smaller in homogenous subgroups.

Nonetheless, the prediction hits the mark. If the black male gangster class has a mean IQ of 74 with an SD of 8.44, Ali’s expected IQ would be 1.27(8.44) + 74 = 85 which is exactly how he scored on the Army intelligence test!

IQ isn’t everything

Some might question how someone so verbally quick and charismatic, not to mention iconic and influential, could have had an IQ of “only” 85, but I actually think the low IQ was part of his charm because it gave him a childlike innocence and enthusiasm that the public found endearing.  But for all his gifts, in the end Ali struggled to adapt the situation to his advantage (the ultimate test of intelligence). His promoters got rich at the expense of his health, while the final decades of Ali’s life were tragic.

Nonetheless he will go down in history as one of the most admired people of the 20th century for his athletic gifts, creativity (he’s been called the first rapper), stage presence, moral courage in opposing the Vietnam war, and the pride, dignity, and status he brought to his people.  He will be deeply missed.

Share this:

  • Share on X (Opens in new window) X
  • Share on Facebook (Opens in new window) Facebook
Like Loading...

The incredible correlation between IQ & income

11 Thursday Feb 2016

Posted by pumpkinperson in income, Uncategorized

≈ 131 Comments

[Update May 25, 2024: A much more up to date version of this article can be found here]

In this post, I summarize all that I have learned about the actual test scores of different income levels.  In particular, I compare actual psychometric data of seven U.S. economic classes: (1) the homeless, (2) welfare recipients, (3) median Americans, (4) self-made millionaires (5) self-made decamillionaires, (6) self-made billionaires, and (7) self-made decabillionaires, and largely confirm my repeated assertion that average IQ increases by 8-10 points for every ten-fold increase in income, though there may be a few major exceptions to this overall trend.  Also, by analyzing the slope of the standardized regression line predicting IQ from income, I find evidence that the true correlation between IQ and income (at least in America) is much higher than the 0.23  reported in a 2006 meta-analysis and even higher than the 0.4 correlation asserted by Arthur Jensen, and may even approach 0.5.

I also find tentative but shocking evidence that the IQ gap between the richest and poorest Americans may exceed an astonishing 70 points!

In this analysis I am limiting myself entirely to test score data so IQ estimates based on ethnic composition or educational achievements of various economic classes are only occasionally mentioned to buttress the actual psychometric results.  In several cases, the data is somewhat anecdotal, and speculative statistical inferences are sometimes made.

Technical note

For each economic class, I provide two normalized Z scores; one measuring the median financial success, and one measuring the mean or median cognitive ability.  The normalized Z scores are just measures of where each economic class ranks (in financial success or IQ) compared to a reference group (in this case U.S. adults in general, or U.S. adults of a specific age).  For example a Z of +2.33 means you’re in the top 1%, and a Z of -2.33 means you’re in the bottom 1%.  A Z of 0 means you’re right in the middle, etc.

THE HOMELESS: Mean IQ 83 (U.S. norms); IQ 80 (U.S. white norms)

Homeless_Man

Image found here

Median financial success: 0.09 percentile of U.S. adults (normalized Z = -3.13)

In 2015, roughly 423,750 American adults were homeless on a given night: One in 572 American adults (0.17%).  Thus it can be estimated that the median homeless person is financially in the bottom 0.09%

 Median cognitive ability: 12.8 percentile of U.S. adults (normalized Z = -1.17)

A 2004 study found that 90 homeless men living in a large shelter in Milwaukee, Wisconsin, had a mean WASI full-scale IQ of 83.92 (standard deviation = 15.24).  The WASI was published in 1999, and this study was published in 2004, so we should subtract 1.5 points for old norms which are thought to expire at a rate of 0.3 points a year (the Flynn effect), so the homeless likely have a mean IQ of 82.5 (U.S. norms) or about 80 (U.S. white norms).

One problem with this study is that 81% of the sample was black (much higher than the 45% among homeless Americans in general) and these tend to score lower on IQ tests, at least in the general population, however a UK sample of homeless obtained virtually identical scores on the WASI, despite being 96% white.

In the  UK study, the WASI full-scale IQ distribution of the homeless has a mean of 84.3. In this study, published in 2011, the WASI norms were by now even more outdated, so we should probably subtract 3.6 points for old norms, so this homeless sample have a mean IQ of 80.7 (U.S. norms) or about 78 (U.S. white norms).

Given the IQ of 80.7 (U.S. norms) among the the virtually all-white U.K. homeless sample, the IQ of 82.5 among the mostly blacks American sample is unlikely to be deflated by race, thus 83 is considered the best estimate of the American homeless.

WELFARE RECIPIENTS: Mean IQ 92 (U.S. norms); IQ 90 (U.S. white norms)

washington_house

Image found here

Median financial success: 8.5 percentile of U.S. adults (normalized Z = -1.4)

About 17% of U.S. adults between age 18 and 64 receive public assistance.  Thus the median welfare recipient can be thought of as in the bottom 8.5% financially.

Mean cognitive ability: 30 percentile of U.S. adults (normalized Z = -0.53)

It’s common knowledge in psychometric circles that reading comprehension tests are statistically equivalent to IQ tests, and a literacy study found that about 2/3 to 3/4 of adult welfare recipients (about 71%) have what’s classified as Level 1 or Level 2 literacy.  By contrast, 1/2 of the general adult population are at these levels.

Since by definition, 1/2 of Americans have IQs below 100, it can be deduced that 71% of welfare recipients have IQs below 100.  In a normal distribution, the 71 percentile is 8 IQ points (0.53 sigma) above the mean, so if IQ 100 is the 71 percentile among welfare recipients, the average welfare recipient should have an IQ 8 points less.

In other words, American welfare recipients average IQ 92 (U.S. norms) or about 90 (U.S. white norms).

Some might object that my analysis falsely assumes welfare recipients have the same IQ variance as the general U.S. population, but the above cited studies of the homeless suggest that poor Americans do indeed have a similar variance to Americans on the whole.

MEDIAN AMERICAN:  Mean IQ 100 (U.S. norms); IQ 97-98 (U.S. white norms)

avhouse

A house fit for the median American.  Image found here

Median financial success: 50th percentile of U.S. adults (normalized Z = 0)

By definition, the median American is at the 50th percentile financially.

Median cognitive ability: 50th percentile of U.S. adults (normalized Z = 0)

By definition, the median American is at the 50th percentile cognitively.

SELF-MADE MILLIONAIRES: Mean IQ of 118 (U.S. norms); IQ 117 (U.S. white norms)

millhouse

A house fit for a millionaire.  Image found here

Median financial success: 99th percentile of Americans in their 50s (normalized Z = +2.33)

According to the 2000 book The Millionaire Mind by Thomas J. Stanley, which reported on a survey of 773  millionaires (defined here by household, not individual net-worth), the typical self-made millionaire is a 54 year-old man.  In the year 1998 (when the millionaires were surveyed), it took an individual income of about $340,000 to make the top 1% for 52-58-year-olds.  The surveyed millionaires had a median income of $436,000, but because this was household income, their spouses likely contributed, so in individual income they were likely not much higher than the top 1%

Mean cognitive ability: 88th percentile of U.S. adults (normalized Z = +1.2)

The average self-reported SAT score of the millionaires Stanley survey was 1190, which Stanley adjusted to about 1100 because of self-reporting bias (millionaires who were “A students” were more likely to recall their scores than “C students”).  Since 90% of the sample were college graduates it’s likely virtually all took the SAT.

Since the typical self-made millionaire in the sample was 54 as of 1998, it’s likely he took the SAT circa 1961 (when he was 17).  According to the book The Bell Curve (page 422), if all American young adults (not just the college bound elite) had taken the SAT in 1960, the average score (IQ 100; U.S. norms) would have been 784.  Meanwhile prior to 1974, an SAT score of 1300 was considered Mensa level (IQ 130).  Extrapolating from these two data points, the average self-made millionaire has an IQ of 118 (U.S. norms); 117 (U.S. white norms).

SELF-MADE DECAMILLIONAIRES: Mean IQ of 118 (U.S. norms); IQ 117 (U.S. white norms)

David-Beckham-house

Image found here

Median financial status: 99.9th percentile of Americans in their 50s (normalized Z = +3.1)

20% of Stanley’s millionaire sample earned at least $1 million a year in household income, and many of these probably earned much more than that, and presumably the bulk of this was individual income made by by the head of households Stanley surveyed, not their spouses.  Anyone in their 50s who has been earning a million a year for a long period of time, likely has, or will have, a net worth over $10 million (decamillionaire status).  In the year 1998 (when the millionaires were surveyed), it took an individual income of about $1.25 million to make the top 0.1% for 52-58-year-olds.

Mean cognitive ability: 88th percentile of U.S. adults (normalized Z = +1.2)

Above I noted that millionaires had a mean SAT score equating to IQ 118 (U.S. norms); 117 (U.S. white norms).  Because Stanley found virtually no correlation between income or net-worth among the millionaires themselves it might be assumed that the decamillionaires in his sample also averaged IQ 118.  Of course if the data was not normalized, the zero correlation might be misleading.

SELF-MADE BILLIONAIRES: Mean IQ 133 (U.S. norms); IQ 132 (U.S. white norms)

tenmill

Image found here

Median financial success: 99.99993 percentile for baby boomers (normalized Z = +4.8)

About 80 million Americans were born between 1946 and 1964 (the baby boomers).  People in this age groups are about 42% of the richest Americans.   There are 277 self-made billionaires in America (see appendix A of this document).  If we assume 42% of these are boomers, then 116 of America’s 80 million boomers are self-made billionaires, which means the median self-made billionaire boomer is the 58th most prosperous out of 80 million, equating to the 99.99993 percentile.

Mean cognitive ability: 98.6 percentile of U.S. adults (normalized Z = +2.2)

Several boomer billionaires have SAT scores that are apparently publicly known.  Bill Gates claims to have scored 1590 and Paul Allen reportedly scored 1600.  On the pre-1995 SAT, these scores equate to IQs of about 170.  I can no longer find any internet sources reporting Steve Ballmer’s composite SAT scores,  but he reportedly scored a perfect 800 on the math section of the SAT which seems to equate to an IQ of 150, but given that he hit the ceiling on the test, and is rumored to be in the same IQ league as Gates himself, this is likely an underestimate.  Perhaps the best publicly known measure of his IQ is his performance on William Lowell Putnam Mathematical Competition where he performed even better than Gates.  If this source is reliable, Ballmer got one of the 100 best scores on the exam in 1974, but probably not one of the top 45, so let’s split the difference and assume he came in 73rd.

Ballmer was one of the 4,308,000 Americans born in 1956, and assuming almost all of the top math talent from his cohort went on to compete in the 1974 Putman (and whatever shortfall was made up by top foreign talent and by older and younger talent), then Ballmer’s score equates to the top 73 out of 4,308,000 (one in 59,000 level) which equates to an IQ of 162.

Thus at least three of the roughly 116 self-made boomer billionaires in America (2.6%) have tested IQ equivalents of at least 162+.  It’s possible some of these scores have been exaggerated, but it’s also possible there are other super brilliant self-made billionaires with unknown  high test scores.  Both possibilities negate one another, making 2.6% perhaps a reasonable estimate.

In the general U.S. population, the top 2.6% have IQs of 129+, but in the self-made boomer billionaire population, the top 2.6% have IQs of 162+.  This suggests their entire bell curve is shifted 33 IQ points to the right, so just as the average American has an IQ of 100, the average self-made boomer billionaire should have an IQ of 133, though given that the average is extrapolated from just three outliers (Gates, Allen and Ballmer) who all got rich from one company (Microsoft), it should be interpreted with great caution.  Nonetheless, it is roughly consistent with research showing that 43% of self-made billionaires attended colleges indicative of top 1% ability (IQ 135+) (see table 1 of this document) and is also roughly consistent with the ethnic composition of the Forbes 400 richest American list, though there are some anomalies.

Some might object that my estimate for the average IQ of self-made boomer billionaires assumes the super rich have the same IQ variance as the general U.S. population, however a study of the homeless (cited way above) found that even folks at the economic extreme have a standard deviation of 15, like Americans as a whole.

SELF-MADE DECABILLIONAIRES: Mean IQ 151 (U.S. norms); IQ 151 (U.S. white norms)

firstbill

A home fit for a decabillionaire.  Image found here

Median financial status: 99.99999th percentile of baby boomers (normalized Z = +5.23)

Of the 80 million Americans baby boomers, only 13 were self-made decabillionaires in the Oct 19, 2015 issue of Forbes magazine, so the median self-made decabillionaire boomer is the 6.5th most prosperous person in that age group (one in 12.3 million)

Mean cognitive ability: 99.97 percentile of U.S. adults (normalized Z = +3.4)

Of the 13 self-made decabillionaire boomers, at least three (23%) reportedly have test scores equating to IQs of 162+ (Gates, Allen and Ballmer as mentioned above).

If we assume that the IQs of self-made decabillionaire boomers are roughly  normally distributed with the same variance as in the general U.S. population (see above), then the fact that 23% have 162+ IQs implies an average IQ of 151, though given the small number of data points, this could just be a fluke.

But it’s worth noting that self-made decabillionaires have perhaps roughly double the rate of elite college attendance as U.S. self-made billionaires in general.  Futher, when I analyzed the ethnic and racial background of self-made decabillionaires in 2009 (all generations) it implied a mean IQ of about 150.

Despite this corroboration, an IQ of 151 is so incredibly high that it should still be considered tentative.  And even assuming its veracity, it may only apply to decabillionaires of the baby boomer cohort and younger.  Older decabillionaires came of age before the rise of high tech and big data, and thus may not have needed anywhere near as much IQ to get rich.

One might not think an IQ of 151 is that extreme for elites given that SAT IQ equivalents this high are not uncommon at the most elite colleges in America, however it’s worth repeating yet again that the IQs of elite college students will regress precipitously when they move from the SAT (the test that selected them) to a neutral IQ test.  By contrast, decabillionaires were mostly selected by the market, and only partly by their SAT scores creating opportunities, so unlike Ivy League students,  their SAT IQ equivalents are perhaps not inflated by selection bias.

Summary

Below is a summary of the data in bar graph form:

supernew

Below is a summary of the above data in table form.

economic class median earned income median wealth financial success (normalized u.s. z for age grouping) iq (u.s. z) iq (u.s. norms) iq (u.s. white norms)
self-made decabillionaires 10 figures 11 figures +5.23 +3.4 151 151
self-made billionaires 9 figures 10 figures +4.8 +2.2 133 132
self-made decamillionaires 7 figures 8 figures +3.1 +1.2 118 117
self-made millionaires 6 figures 7 figures +2.33 +1.2 118 117
median income 5 figures 5 figures 0 0 100 97-98
welfare 4 figures 4 figures -1.4 -0.53 92 90
homeless 3 figures 1 figure -3.13 -1.17 83 80

For every ten-fold increase in income, mean IQ increases 8-10 points

The simplest way to think of the IQ income relationship is that for every ten-fold increase in income, average IQ increases 8-10 points (U.S. white norms).  Of course there are some major anomalies.  Self-made decabillionaires are 10 times more prosperous than self-made billionaires, yet appear to score 19 IQ points higher, though these numbers are tentative given limited data.  Meanwhile self-made decamillionaires are ten times more prosperous than self-made millionaires, yet appear, based on Thomas Stanley’s research, to be equally intelligent.  One possible reason for this is that the the correlation between IQ and money is partly mediated by years of education, but once you have enough education to be a millionaire (i.e. law school or medical school), even more schooling doesn’t help much. and may even have opportunity costs.

These anomalies notwithstanding,  when I graphed average IQ (Y axis) as a function of income (number of figures earned per year)(X axis), there was a nice linear relationship overall:  IQ (U.S. white norms) = 9.487319(number of figures) + 52.57971

figures

Standardized regression slope & correlation coefficient

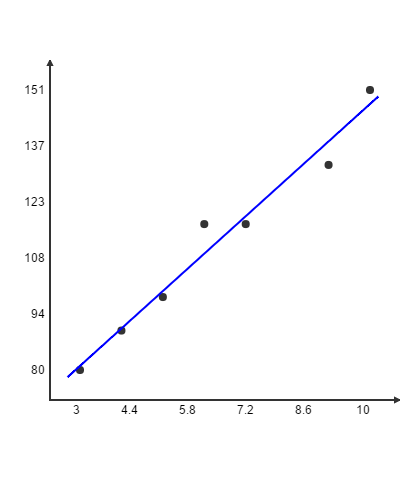
I also graphed average IQ as a function of money again, but this time expressed as normalized Z scores, with average IQ of the seven economic classes on the Y axis, and median financial success on the X axis:

five

IQ Z score = 0.489421(financial normalized Z score) + 0.135804

As the above graph shows, there’s a virtually perfect (r = +0.97) correlation between economic class and mean/median measured intelligence, when both variables are expressed as normalized Z scores.

Note, this near-perfect correlation between median financial success and mean IQ  should not be confused with the correlation between individual IQ and individual financial success.   The former is known as as an “ecological” correlation commonly used in epidemiological research, and tends to be higher because individual level variation cancels outs.  However because the Z scores are based on the normalized distributions of individuals, the slope of the regression line (+0.49) will equal the individual level correlation.

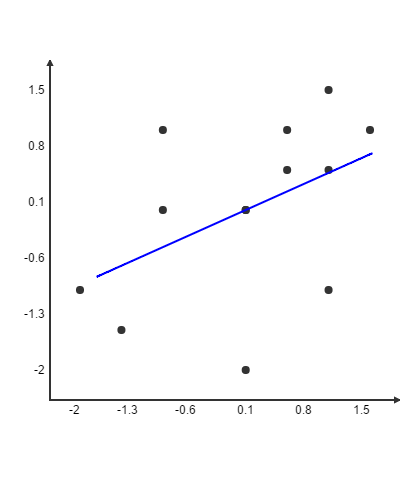
The actual scatter plot of a random group of individuals (with IQ Z on the Y axis and income Z on the X axis) would probably look as follows:

genpop

Notice first that the range of Z scores on both the X and Y and axis is much less.  That’s because most people in a random sample of Americans are ordinary in both income and IQ.  Note also the enormous variation around the line of best fit.

Now if you extended the range of X and Y much much further, and if you plotted the mean Y for every X, instead of every Y for every X, you should get a scatter plot that looks very much like the ecological scatter plot.

But note that in both the the ecological scatter plot, and the individual scatter plot, the slope should be the same because the line of best fit can be thought of as a line connecting the average Y of a given X, so graphing average Ys instead of individual Ys, does not change the line of best fit, it simply eliminates almost all the scatter around it.

Discussion

A correlation of 0.49 is more than double the 0.23 correlation between IQ and income reported in a 2006 meta-analysis by Tarmo Strenze and nearly triple the 0.16 correlation between IQ and net-worth found in a 2007 study by Jay L Zagorsky, however it is similar to the 0.4 correlation between IQ and income asserted by authoritative Arthur Jensen in his 1998 book The g Factor.

Why did my indirect method (regression slope analysis) result in double the correlation found by Strenze’s meta-analysis of direct studies of IQ and income?

Many studies are based on individual income instead of household income.  Because many women (and some men) choose not to work outside the home, their individual incomes are technically zero, but they should not be considered the equivalent to a homeless person with zero income, because they are in fact working in the home and thus earning at least some of their household income.  Because there’s no agreement on how to quantify such indirect forms of income, it’s not counted which greatly limits the IQ-income correlation.  Using household income instead of individual income seems to result in a higher correlation between IQ and income (+0.37) but even this is an imperfect solution, because all adults within a household don’t contribute equally to the household income.

In addition, many studies use only a single year’s income which is obviously quite unreliable, since massive income fluctuations can occur from year to year.

In my analysis, both of these problems were sidestepped because data points were collected primarily from head of households (self-made millionaires, self-made billionaires) or non-households (the homeless) so you didn’t have to worry about how to deal with indirect income (i.e. the spouse of a millionaire who technically earns nothing, but earns her million dollar life by being a good wife).

Also, my analysis focused on fairly stable economic classes (homeless, welfare, millionaires, billionaires) that reflect lifelong patterns of financial success, and not just a single year’s income.

All this may explain why I found a much higher IQ-income correlation than is usually reported.

A reader informed me of an excellent analysis by Dalliard of Human Varities who found that in a large representative sample of Americans in their 30s and 40s, a single year’s income correlated 0.31 with IQ, but averaging income over many years increased the correlation to 0.36.  When Dalliard looked at the correlation in only men (thus, also sidestepping the complication that many women earn their lifestyle as wives instead of through direct income), the correlation leaped to 0.48 (virtually identical to the 0.49 correlation I also found by sidestepping these two problems).

Share this:

  • Share on X (Opens in new window) X
  • Share on Facebook (Opens in new window) Facebook
Like Loading...

Former “CIA guy” claims Obama scored IQ 128 on the WISC

26 Tuesday Jan 2016

Posted by pumpkinperson in Uncategorized

≈ 43 Comments

Last night I couldn’t sleep again so I once again placed my Ipad by my bed and went looking for some conspiracy theory podcast to listen to.  Nothing better then turning off all the lights and listening to paranoid people talk.  In this particular interview, these podcast hosts I’ve never heard of were talking to some self-proclaimed CIA guy I never heard of who was making all these bizare claims about the Obama administration, and how he’s now free to talk because he’s moved to Canada.

I started to fall asleep, and then when I woke up, imagine my surprise when about 22 minutes into the podcast, the self-proclaimed CIA guy is claiming that when Obama was a child, he took the WISC (Wechsler Intelligence Scale for Children) and obtained an IQ of 128.  Now the WISC was originally normed in 1947.5 and published in 1949.  In 1972, it was substantially revised and renormed, and published as the WISC-R.  It was revised and renormed again in 1989 (WISC-III) and there’ve been a couple versions since then (WISC-IV and WISC V).

Let’s say Obama took the test in 1971 when he was 10.  Then his IQ of 128 needs to be reduced to 121 because IQ test norms become obsolete at a rate of about 0.3 points a year, thanks to the Flynn effect, which was not acknowledged in those days.  On the other hand if he took the WISC-R the year it was released (1974), his IQ would only need to be reduced to 127.

But is this story even true?  In all the years I’ve seen bloggers and their readers obsess about President Obama’s IQ, no one has ever mentioned this stat.   The self-proclaimed CIA guy claims to have got it from the Chinese.  The Chinese government has been known to spy on America, and they are more open to the idea of IQ and HBD than Americans.  Given that there is a lot of racism in Asia, they might have been intrigued by the fact that America had a black president and perhaps they were curious to see if he was dumb enough to take advantage of, and went snooping through his childhood records.

On the other hand, this “CIA guy” might just be making stuff up to get attention.  A lot of the other claims he makes (Obama was born in Kenya, Obama’s dad is Frank Marshall Davis) sound so silly, that it’s hard to believe anything he has to say.  But then I fell asleep again and missed most of the interview.

Share this:

  • Share on X (Opens in new window) X
  • Share on Facebook (Opens in new window) Facebook
Like Loading...

The new SAT has a higher ceiling than I thought

10 Tuesday Nov 2015

Posted by pumpkinperson in Uncategorized

≈ 52 Comments

On my other blog I wrote the following:

The SAT is said to correlate about as well with IQ as two different IQ tests correlate with one another.  In his book Real Education (pg 69-70), Charles Murray claims that only 17 year olds capable of getting an 1180+ on the post 1995 SAT (Critical Reading + Math) are true college material.  Although 35% of American 17 year olds take the SAT, he estimates that only 10% of 17 year would score 1180+ if all of them took it..  In other words, 1180+ is equivalent to an IQ of 120+.

In his book Coming Apart (pg 375) he estimates an SAT score of 1400 is equivalent to an IQ of 135.  From these two data points, we can create the following formula for converting SAT into IQ equivalents:

IQ = 39.545 + 0.068(SAT score)

Note, this formula only applies to the post 1995 SAT.  Before 1995 the SAT was much harder.

This formula works well for individuals, but should never be used to estimate the median IQ of a college.  This is because elite colleges select for SATs, so the estimated median IQ will be artificially inflated by a selection bias.

Now when I plug in a perfect SAT score of 1600 into this formula, I get an IQ of 148 (U.S. norms). The problem is, I just read that 453 students scored 1600 on the new SAT in 1996-7 (out of approximately 3,500,000 17 year olds in the United States). That means 1600 equates to an IQ of 154 (U.S. norms).

So drawing a line of best fit through this data point, in addition to the two I got from Charles Murray, gives the following revised formula:

IQ equivalent = 23.835 + 0.081(new SAT score)

Share this:

  • Share on X (Opens in new window) X
  • Share on Facebook (Opens in new window) Facebook
Like Loading...

Revised formula for estimating IQ from bio-demographics

17 Sunday May 2015

Posted by pumpkinperson in Uncategorized

≈ 66 Comments

As I stated in a previous post:

Many years ago, I noticed that IQ was correlated with a great many physical and demographic traits such as head size, height, income, education, etc. This gave me the idea of trying to estimate peoples’ IQs based on bio-demographics. A member of Prometheus society brilliantly suggested that “multiple regression” would be the classic application for my idea, and he also suggested that I use religiosity as one of the demographic traits.

Well it turns outs psychologists have been using demographic traits like education and occupation to estimate premorbid IQ in people suspected of dementia for years, but they don’t include biological traits except for race. I thought it would be interesting to use a wide range of bio-demographic traits so using data from 144 Canadians (age 26 to 76) I created an equation to estimate your IQ. The sample was heavily skewed towards my demographic (Ontario men in their thirties) but the formula might still work on working age North Americans in general.

This formula has been substantially revised and adapted for use in Americans.

INSTRUCTIONS

Start by assuming your IQ is -1.251, and then add or subtract based on the following 25 instructions. Be honest or your estimate will not be accurate.

Education

1. If you graduated from elementary school, add 6.212 points

2. If you graduated from high school, add another 6.212 points

3. If you have a university degree, add another 6.212 points.

4. If you have a graduate degree or attended an elite college or high school, add another 6.212 points.

5. If you both attended an elite college AND have a graduate degree, add yet another 6.212 points.

Head Size

6. Multiply your cranial circumference (in inches) by 2.768 and add the resulting number of points.

Height

7. Multiply your height (in inches) by 0.418 and add the resulting number of points

Weight

8. Multiply your weight (in pounds) by 0.0927 and subtract the resulting number of points

Race

9. If you’re less than half-black, add 2.666 points

10. If you’re less than a quarter black and less than a quarter Native American, add another 2.666 points

11. If you’re more than 75% Northeast Asian, or more than 50% Ashkenazi Jewish, add another 2.666 points

12. If you’re more than 75% Ashkenazi Jewish, add yet another 2.666 points

Media preferences

13. Which of the following do you most prefer for entertainment: a) fun TV shows like sitcoms, reality TV, game shows, sports, and popular talk shows, b) intellectual TV shows about science, history or politics, c) fun books like romance novel or thrillers, or d) intellectual books like literary novels or academic texts.  If you chose “a” add 0 points,  if you chose “b” add 3.451 points, if you chose “c”, add 6.902 points, and if you chose “d”, add 10.353 points.

Sex

14. If you’re male, subtract 5.1 points

Income

15. Multiply the number of figures in your yearly pre-tax income by 1.869 and add the resulting number of points.  If you’re retired, use your peak earnings, adjusted for inflation. If much of your earnings go into your business or if you’re too rich to have a conventional income, simply divide your individual net worth by ten to approximate your income.

Religiosity 

16. If you believe in God, subtract 3.901 points.

17.  If you’re a creationist who does not believe in evolution, subtract another 3.901 points.

Political conservatism

18. Which of these U.S. political parties would you most like to see in power: The Green party, the Democrats, or the Republicans? If you picked the Green party, subtract 0 points, if you picked the Democrats, subtract 3.405 points, and if you picked the Republicans, subtract 6.81 points.

Alcoholism

19. If you’re an alcoholic, subtract 2.282 points

Smoking

20. If you’re a smoker, subtract 2.282 points

Age

21. Multiply the number of years you’ve been alive by 0.194 and add the resulting points

Birth Order

22. Multiply your birth order by 0.885 and subtract the resulting points. So if you’re your biological mother’s third born, multiply 3 by 0.885 and thus subtract 2.655 points.

And your IQ is…

23. Subtract 100 from all your points

24. Divide by 0.8

25. Add 100


Share this:

  • Share on X (Opens in new window) X
  • Share on Facebook (Opens in new window) Facebook
Like Loading...

High IQ Bill Gates towers as the richest American, 21 years in a row!

13 Monday Oct 2014

Posted by pumpkinperson in Uncategorized

≈ 85 Comments

Tags

Bill Gates, billionaires, Forbes, IQ

Forbes magazine just came out with their annual list of the 400 richest Americans and, for the 21st year in a row, Bill Gates tops the list, with over $80 billion. Just to qualify for the Forbes 400 this year, you need about $1.5 billion. It’s interesting to speculate on what Bill Gates’ IQ might be. In India, Gates was asked exactly that, though he didn’t give a number:

Way back in 1997, columnist Dan Seligman wrote the following:

It seems marvelously symbolic that William H. Gates III, the guy listed as number one on The Four Hundred, has an obviously breathtaking IQ. The figure 170 keeps getting into print, which would make him almost certainly the highest on this list or any other list you’re likely to be looking at soon. To be sure, one occasionally sees conjectures that Steven Ballmer, Microsoft’s executive vice president, worldwide sales and support, is in the same IQ league as Bill himself. Ballmer is number six among The Four Hundred. It also seems symbolic of the new order that their company has made IQ a public and explicit criterion for hires of senior personnel.


Anyhow, it seems reasonable to view The Four Hundred as a subset;an especially lucky subset;of the emerging cognitive elite.

One wonders where the 170 figure originated. I remember leafing through one of Gates’ biographies and seeing a quote from a teacher estimating his IQ to be about 160 or 170, but no actual test score was cited. So my guess is that’s where the 170 figure started. It’s also been widely reported that Gates scored a perfect 800 on the math section of the notoriously difficult old SAT (before the test was dumbed down circa 1995). Reports about his verbal score are a little inconsistent. For example, biographers Stephen Manes and Paul Andrews write:

Toward the end of the year, Lakeside senior classman Bill Gates took on a different marketing project: the selling of William Henry Gates. Potential customers? College admissions officers. Bill had scored 800 on his math SAT and five achievement tests (although only in the low 700s on the verbal SAT), and he put it, “I wanted to know which personality of mine would appeal to the world at large.

This would imply an overall SAT score in the low 1500s (which is spectacular for the old SAT) however in this Q&A, the interviewer states the Gates got an even more impressive 1590, and asks Gates if he ever wonders what question he got wrong. Gates replies:

The truth is, that was the verbal SAT. I got 790 the first time. I told my parents their vocabulary wasn’t large enough. I was criticizing them. So I did go back and take it and do better the next time.

Kind of clever how Gates managed to look like he was answering the question without actually confirming or denying the 1590 score. Assuming Gates did score 1590 on the old SAT, then according to the Prometheus MC Report (see section 8.3.3), that equates to a WAIS IQ of 169, or roughly 170. Even if he only scored around 1500, that would still equate to an IQ of 151 (99.97%ile). Either way, the man is likely smarter than the average Ivy League professor, the average Nobel prize winning scientist, and any American president of the last 100 years.

However even the old SAT might not have contained enough truly novel and complex problems to gives Gates an accurate test score. More informative are the opinions of his classmates at Harvard who actually got to observe him compete in an extremely high level academic environment. Despite writing a fairly negative book about Gates, Paul Allen admits his former friend was brilliant, stating:

I was decent in math, and Bill was brilliant, but by then I spoke from my experience at Washington State. One day I watched a professor cover the blackboard with a maze of partial differential equations, and they might as well have been hieroglyphics from the Second Dynasty. It was one of those moments when you realize, I just can’t see it. I felt a little sad, but I accepted my limitations. I was O.K. with being a generalist.


For Bill it was different. When I saw him again over Christmas break, he seemed subdued. I asked him about his first semester, and he said glumly, “I have a math professor who got his Ph.D. at 16.” The course was purely theoretical, and the homework load ranged up to 30 hours a week. Bill put everything into it and got a B. When it came to higher mathematics, he might have been one in a hundred thousand students or better. But there were people who were one in a million or one in 10 million, and some of them wound up at Harvard. Bill would never be the smartest guy in that room, and I think that hurt his motivation. He eventually switched his major to applied math.

Is Harvard math really so selective that even one in a 100,000 talent plus hard work only gets you a B? If so, it would imply Gates has an IQ of 164.

An anonymous commenter on Steve Sailer’s blog wrote:

Regarding Gates academic ability, I think the general consensus from people who knew him at Harvard was that he may not have the very best at mathematics, but that he was second to none in computer science. He was taking graduate courses as a freshman and apparently never taking notes and blowing the curve for the rest of the class. A doctoral student said that Gates would just sit with his arms behind his back and correct the algorithms being written on the board anytime the prof made a mistake. He also said everyone else in the class hated him, but that he would ask him questions on occasion, and that his answers were always penetrating and beyond anything this guy could have thought of on his own.


Gates apparently wrote an outstanding paper in theoretical computer science that solved a problem presented to him a math class that he co-authored with his professor who is now at UC-Berkeley.

Sounds like Gates has an IQ of at least 160 and possibly 170. Considering the average American has an IQ around 100 and the average self-made billionaire has an IQ around 130, is it any wonder Gates became the richest man in America? Compared to Gates the average self-made billionaire is mildly retarded, and the average American is so profoundly retarded they can not even feed themselves. Becoming the richest man in the country must have been like taking candy from a baby. At his peak, he was the first centibillionaire in world history, and probably would still be that rich had potentially jealous government officials, perhaps eager to take a nerd down a peg, decided not to go after him.

I really admire Gates because instead of being the typical high IQ nerd who just sits around playing computer games or working in academia, he decided to go out into the real world and compete with the alpha males at their own cutthroat game of Darwinian capitalism…and he beat the living shit out of them!

Share this:

  • Share on X (Opens in new window) X
  • Share on Facebook (Opens in new window) Facebook
Like Loading...

Correcting ethnic IQ differences for nutrition

01 Wednesday Oct 2014

Posted by pumpkinperson in Uncategorized

≈ 41 Comments

Tags

ethnicity, Flynn effect, IQ, nutrition, race, Richard Lynn

Readers of the New York Times have long known that there might be genetically based ethnic differences in IQ, but few people appreciate that nutrition also plays a huge role in IQ. For example, thanks to malnutrition, British whites in the 19th century had real IQ’s around 76 (on modern norms), though this was spuriously pushed down to IQ 66 by lack of schooling (see the Flynn effect). By comparison, in his book Race Differences in Intelligence, scholar Richard Lynn reports the following IQ’s for 10 major populations:

North East Asians: IQ 105
Europeans: IQ 99
Arctic peoples: IQ 91
Southeast Asians: IQ 87
Native Americans: IQ 86
Pacific Islanders: IQ 85
Non-white Caucasoids: IQ 84
Sub-Saharan agriculturalists: IQ 67
Australian aboriginals: IQ 62
Sub-Saharan hunter/gatherers: IQ 54

How much of these scores were affected schooling? Probably not much because virtually all the samples were school children. A major exception being sub-Saharan hunter’gathers, but Lynn estimated their IQ largely by comparing them to equally unschooled neighboring agriculturalist who score IQ 67 with schooling. Since the Bushmen scored about a dozen points lower, it was reasonable to assume that with schooling, Bushmen would score in the mid 50s. Although IQ tests are supposed to measure native ability, few tests are 100% culture fair so it’s necessary to control for schooling when comparing disparate cultures.

So if schooling did not affect these scores, what about nutrition? Although Lynn concedes that malnutrition adversely affects the IQ’s of third-world peoples, no attempt was made to correct the IQ’s for this effect. However on page 184, Lynn provides a table showing the prevalence of malnutrition for various geographic regions. The table lists several measures of malnutrition (i.e. percent underweight, percent wasted, percent stunted, percent anemic) and averaging across the different measures that are provided, implies that as of 1996, malnutrition afflicted 30% of Sub-Saharan Africa, 14% of the Middle East & North Africa, 45% of South Asia, 21% of East Asia & Pacific, and 16% of Latin America & Caribbean. Elsewhere in the book he claims that 25% of Australian aboriginals are malnourished.

I estimated that for each percentage of the population that is nutritionally deficient enough to be proclaimed malnourished, the average IQ of the population is lowered by 0.43 IQ points. This estimate is based on the fact that Lynn notes that African Americans with virtually no white admixture have IQ’s 13 points higher than their genetic counterparts in sub-Saharan Africa, 40% of whom are malnourished. Thus 40 multiplied by 0.43 lowers a population’s IQ 13 points below its potential. So correcting the IQ’s of all the ethnic groups for the level of malnutrition in the regions that they live, gives the following:

Northeast Asians: IQ 105 (no corrections, they live in first world countries)

Europeans: IQ 99 (no corrections, they live in first world countries)

Southeast Asians: IQ 96 (corrected for 21% malnutrition in East Asia & the Pacific Islands)

Pacific Islanders: IQ 94 (corrected for 21% malnutrition in East Asia & the Pacific Islands)

Arctic people: IQ 91 (no corrections, they live in first world countries)

Non-white Caucasoids: IQ 90 (corrected for 14% malnutrition, since they mostly live in the middle east/North Africa)

Native Americans: IQ 89 (many live in Latin America which has 16% malnutrition, others live in first-world North America, I split the difference & corrected for 8% malnutrition)

Sub-Saharan agriculturalists: IQ 80 (corrected for 30% malnutrition in Sub-Saharan Africa)

Australian aboriginals: IQ 73 (corrected for 25% malnutrition mentioned by Lynn)

Sub-Saharan hunter/gatherers: IQ 67 (corrected for 30% malnutrition in Sub-Saharan Africa)

Share this:

  • Share on X (Opens in new window) X
  • Share on Facebook (Opens in new window) Facebook
Like Loading...
Newer posts →

contact pumpkinperson at easiestquestion@hotmail.ca

Recent Comments

Anime's avatarAnime on The 2009 V reboot: One of the…
Elmo Bunn's avatarElmo Bunn on The 2009 V reboot: One of the…
Anime's avatarAnime on The 2009 V reboot: One of the…
Boss Nation's avatarBoss Nation on The 2009 V reboot: One of the…
Anime's avatarAnime on The 2009 V reboot: One of the…
pumpkinperson's avatarpumpkinperson on The 2009 V reboot: One of the…

Archives

  • January 2026
  • December 2025
  • November 2025
  • October 2025
  • September 2025
  • August 2025
  • July 2025
  • June 2025
  • May 2025
  • April 2025
  • March 2025
  • February 2025
  • January 2025
  • December 2024
  • November 2024
  • October 2024
  • September 2024
  • August 2024
  • July 2024
  • June 2024
  • May 2024
  • April 2024
  • March 2024
  • February 2024
  • January 2024
  • December 2023
  • November 2023
  • October 2023
  • September 2023
  • August 2023
  • July 2023
  • June 2023
  • May 2023
  • April 2023
  • March 2023
  • February 2023
  • January 2023
  • December 2022
  • November 2022
  • October 2022
  • September 2022
  • August 2022
  • July 2022
  • June 2022
  • May 2022
  • April 2022
  • March 2022
  • February 2022
  • January 2022
  • December 2021
  • November 2021
  • October 2021
  • September 2021
  • August 2021
  • July 2021
  • June 2021
  • May 2021
  • April 2021
  • March 2021
  • February 2021
  • January 2021
  • December 2020
  • November 2020
  • October 2020
  • September 2020
  • August 2020
  • July 2020
  • May 2020
  • April 2020
  • March 2020
  • February 2020
  • January 2020
  • December 2019
  • November 2019
  • October 2019
  • September 2019
  • August 2019
  • July 2019
  • June 2019
  • May 2019
  • April 2019
  • March 2019
  • February 2019
  • January 2019
  • December 2018
  • November 2018
  • October 2018
  • September 2018
  • August 2018
  • July 2018
  • June 2018
  • May 2018
  • April 2018
  • March 2018
  • February 2018
  • January 2018
  • December 2017
  • November 2017
  • October 2017
  • September 2017
  • August 2017
  • July 2017
  • June 2017
  • May 2017
  • April 2017
  • March 2017
  • February 2017
  • January 2017
  • December 2016
  • November 2016
  • October 2016
  • September 2016
  • August 2016
  • June 2016
  • February 2016
  • January 2016
  • November 2015
  • May 2015
  • January 2015
  • December 2014
  • November 2014
  • October 2014

Categories

  • ethnicity
  • heritability
  • income
  • Oprah
  • Uncategorized

Meta

  • Create account
  • Log in
  • Entries feed
  • Comments feed
  • WordPress.com

Blog at WordPress.com.

Privacy & Cookies: This site uses cookies. By continuing to use this website, you agree to their use.
To find out more, including how to control cookies, see here: Cookie Policy
  • Subscribe Subscribed
    • Pumpkin Person
    • Join 684 other subscribers
    • Already have a WordPress.com account? Log in now.
    • Pumpkin Person
    • Subscribe Subscribed
    • Sign up
    • Log in
    • Report this content
    • View site in Reader
    • Manage subscriptions
    • Collapse this bar

Loading Comments...

    %d