Is the Flynn effect only 1 point a decade?

The Flynn effect is generally assumed to be 3 points a decade, at least on the Wechsler administered in the U.S.. However my own research in getting a modern sample of young adults in 2008 to 2019 to take the 1937 Wechsler, found they only scored 7 points higher than 1937 norms, suggesting a gain of only 1 point per decade. Of course my sample size was only 17 people so maybe the results will change if I get more data, but then I discovered something interesting.

In the UK, the Raven Standard Progressive Matrices shows a Flynn effect of several points a decade in adults, but only about 1 point a decade in kids (the same as I found for adults on the Wechsler).

Source: The Raven’s progressive matrices: change and stability over culture and time by
J Raven
Source: The Raven’s progressive matrices: change and stability over culture and time by
J Raven 

Richard Lynn once noted that the Raven Flynn effect is much larger in adults than in kids, a difference he attributed to schooling. Because the generation gaps in schooling are much larger in adults than in kids, schooling contributes to the adult Raven Flynn effect but not the children one, with the latter being a genuine rise in intelligence caused by prenatal nutrition, while the former is mostly spurious.

How does schooling affect a test as culture reduced as the Raven? Lynn argued that it was a disguised a math test that required addition, subtraction and distribution. I don’t buy it. The Flynn effect is supposed to be a fluid test so by definition it shouldn’t require much knowledge. Also, if the adult Raven Flynn effect were driven by learning arithmetic, why didn’t my research find an adult Flynn effect on the Wechsler Arithmetic subtest (in fact I found a negative Flynn effect on that subtest).

Instead I suspect schooling’s impact on the Raven is motivational, not cognitive. Because the Raven is not a fun like the subtests on the original Wechsler, only those who stay in school tend to have the confidence, interest and intellectual discipline to try their best. Those who drop out of school early (specifically the Roma in Serbia) complained that the test was giving them a headache.

Years ago I administered a version of the Raven to a woman in a bar who credited the test with her then passing her exam to attend college (because the Raven made her focus). I also once administered the WAIS-III Matrix Reasoning test (a Raven rip-off added to newer versions of the Wechsler) to a male relative, but he hurried through each item and scored the equivalent of IQ 120. When a female relative scored 135 he demanded to take the test again. This time he agonized over each item, studying the patterns for many minutes, and clocked in at 130.

So Victorian adults would have probably scored around IQ 65 on the Raven, but as kids they probably would have scored around 90. The IQ 90 should be considered a valid measure of their intelligence and makes perfect sense because as Jensen noted, the real component of the Flynn effect is likely caused by the 20th century rise in brain size and predictable from the brain size-IQ correlation. Don’t know the average brain size of Victorians but they were 1.68 SD shorter (11 cm). Assuming their brains were 1.68 SD smaller, and assuming IQ and brain size correlate at least 0.32, we should expect them to have been about 0.32(1.68 SD) = 8 IQ points less intelligent.

Richard Lynn also noted that the Flynn effect being larger on Wechsler Performance IQ than Wechsler verbal IQ is consistent with the nutrition theory because a study of identical twins found that the one born with a smaller head (presumably because of prenatal malnutrition) scored lower on the Wechsler at age 15, but only on the Performance subtests. But this was before the Wechsler added the Raven rip-off on which the malnourished twins would have likely showed some IQ impairment, but not as much as found on hard-core Performance tests. The Raven functions more like a measure of Wechsler full-scale IQ because you can either see the solution (Performance IQ) or talk your way to it logically (Verbal IQ).

RIP James Flynn (1934 to 2020)

Sadly it’s now being confirmed by many media outlets that James Flynn did indeed die this month. Flynn was a New Zealand IQ researcher (a cognitive archeologist really) best known for discovering the Flynn effect (the phenomenon by which IQ scores become inflated at a rate of about 3 IQ points a decade). Some have quibbled over the effect being named for him since others had noted it in the past, but these previous discoveries were largely local or one-time events that were quickly forgotten. Flynn established it as a consistent, predictable worldwide phenomenon that was so important, IQ scores had to be adjusted for it and tests required frequent re-norming. Had he not pushed the issue, most measured IQs would probably still be many points too high, thus distorting not only individual diagnosis, but the results of massive studies, and many prison inmates would be wrongly sentenced to death because their IQs were above 70 (making them criminally responsible).

Most of Flynn’s research focused on successive standardizations of the Wechsler intelligence scales where a sample of people would be tested twice on both the newly normed version and the previous version to make sure there was a high correlation. It was consistently noted that IQs would always be a little higher on the newer version. For example scores on the 1954 WAIS (Wechsler Adult Intelligence Scale) were about 3 points higher than on the 1937 Wechsler. It was later found that scores on the 1978 WAIS were about 7 points higher than on the 1954 WAIS. Scores on the 1995 WAIS were about 3 points higher than on the 1978 WAIS. Finally, scores on the 2006 WAIS were about 3 points higher than on the 1995 WAIS.

Before Flynn’s discovery in the 1980s, such gains were just dismissed as tests becoming outdated and requiring new items and were generally too small to be considered significant. But Flynn’s genius was to add the gains of successive test normings to argue that a massive increase had occurred. For example, if you add up all the Wechsler adult gains from 1937 to 2006, you get 16 points (the same as the infamous black-white IQ gap within the United States). Since no one believed the IQ gains are genetic, Flynn used them to argue we shouldn’t believe racial IQ gaps are either.

For years I suspected that Flynn’s method of adding up gains from successive test normings was overestimating the Flynn effect and in 2008 I decided to prove it. I asked for the original 1937 Wechsler for Christmas (known as the ancient WBI) and gathered random strangers to take it. Of course this was a very time consuming project and I soon got distracted. In 2019 I became obsessed with completing the project and truth be told, one of the reasons I got obsessive was that being in his mid 80s, I worried Flynn would die before I could tell him about the research (one of my biggest regrets was Arthur Jensen dying before I could ask him my biggest questions). I did not know Flynn, but he was always kind enough to reply the few times I had sent him an email. By December 2019 I had a sample size of 17 people and as usual, Flynn was kind enough to reply to my emails.

Of course 17 people was not enough and I had really hoped to share with him the results of a much larger data-set but sadly the coronavirus made it too dangerous to get data in 2020, and now Flynn is gone.

May he rest in peace.

From homeless to Harvard: antjuanfinch’s IQ

Commenter antjuanfinch runs a web site where one can take IQ tests that are fun and well programmed (though the norms may need revising). In the real World, antjuanfinch is a twenty-something African American who despite growing up in poverty with mentally ill parents, ended up at the most prestigious university on the planet: Harvard.

Recently, antjuanfinch was mysertiously offered a chance to take the WAIS-IV (4th edition of the Wechsler adult intelligence scale) for free and in the age of covid, this was taken on-line. atjuanfinch self-reported his scaled scores on each of the subtests which I posted below, along with index scores and full-scale IQ I calculated from the manual (which in some cases differed slightly from what atjuanfinch reported).

It should be noted that the scaled scores are expressed on a scale where the U.S. mean for each age group is 10 (SD 3) and the index scores/full-scale IQ use a scale where the U.S. mean for each age group is 100 (SD 15). Thus to convert the scaled scores to IQ equivalents, simply multiply by 5 and add 50. In the third column, scores are adjusted for the fact that the WAIS-IV norms were 16-years-old at the time of testing and these norms (at least in the short-term) tend to become inflated by the equivalent of a few IQ points a decade though this might be an over-correction since the Flynn effect may have stagnated or even reversed in recent years. We’ll have a better idea when the WAIS-V is released.

 scores before Flynn effect adjustmentsadjusted for the Flynn effect
Vocabulary (word knowledge)1917.73
Similarities (verbal abstraction & thought organization)1918.11
Information (long-term memory & environmental awareness)1211.36
Matrices (visual pattern recognition)1615.24
Visual Puzzles (spatial reasoning)1413.62
Figure Weights (quantitative comparison)1514.24
Digit Span (rote memory & attention)1413.62
Letter number sequencing (mental math)1413.62
Coding (rapid eye-hand coordination)1110.75
Symbol Search (visual scanning)1413.75
Verbal comprehension index141134
Perceptual Reasoning index129125
Working Memory index122119
Processing speed index114114
Full-scale IQ135130
Adjustments for Flynn effect were made using page 240 of Are We Getting SMARTER? by James Flynn. I assumed that the rate of change that occurred between the norming of the WAIS-III (1995) and the WAIS-IV (2006) has continued to 2020. Flynn had no data for Visual Puzzles, Figure Weights, Symbol Search or Letter-number sequencing so rates for Block Design, Matrix Reasoning, Coding & Digit Span were assumed for each of those subtests respectively.

The results show that atjuanfinch is a man of very superior intelligence. His full-scale IQ of 130 exceeds that of 98% of Americans his age and is even above of the average of his fellow students at the World’s most prestigious university.

Comparison with Billy

It is interesting to compare his WAIS-IV scores to those of Billy, another brilliant black commenter on this blog. To better illustrate the comparison, I used the five index scores of the WISC-V (most recent Wechsler for children) rather than the four-factor model used by the most recent adult Wechsler.

Table 2
  Billy antjuanfinch
 verbal crystallized  145+  134
 spatial  118  118
 non-verbal conceptual  140  128
 working memory  125  119
 processing speed  111  114

It is interesting how both of these men have the same profile: verbal crystallized > non-verbal conceptual > working memory > spatial > processing speed.  Coincidence?  Both these men are brilliant blacks and brilliant folks by definition are high in g (general intelligence factor) and thus tend to do best on the most g loaded indexes. Verbal and conceptual tests tend to be the most g loaded, while processing speed is the least g loaded so smart people tend to be unexceptional there.  Processing speed is also a problem for those who are neuro-atypical which is common among this blog’s commenters though there’s no evidence these two commenters are in that camp. 

In addition, blacks tend to do better on verbal as opposed to spatial tests,  perhaps because their ancestors never left the tropics so there was less natural selection for the spatially demanding skills needed to survive ice age winters (building shelter, sewing tight figure hugging clothes, making fire, hunting mammoths).  A similar cognitive difference evolved between the sexes, with men doing hunting and today scoring better on spatial tests.

antjuanfinch’s mother

It’s interesting that atjuanfinch reports his mother’s IQ as being 102.  Given the 0.45 parent-offspring IQ correlation,  and the fact that the average African American has a WAIS-IV IQ of 87.7,  we’d expect atjuanfinch’s mother to have an IQ of:

[atjuanfinch’s IQ – (U.S. black mean)](parent-off spring correlation) + black mean [130 – 87.7](0.45) + 87.7

42.3(0.45) + 87.7

107 (only 5 points from the score atjuanfinch reported).


Guest article by Illuminaticat

[The following is a guest article and does not necessarily reflect the views of Pumpkin Person]

Relaxation is required to solve problems. If you can’t relax well doing something that is where anxiety comes in. Something becomes contorted. It is the result of problem-solving becoming difficult. Too many variables emerge and attention cannot find solutions. There is no way out. That is anxiety simplified. If a person is relaxed will be able to find solutions at a normal pace. In the Flow state problems appear as fast as the person can solve them and at the level of being solvable by the person.

Flow, in fact, is a savant characteristic. Entering flow creates increased creativity and is domain transferable. The faster the brain makes connections the more is generated. So as I did once I started creating anything that popped into my mind. I did this for an entire week. At its peak, I was doing highly complex starship schematics and chemistry psychology.

I did this with alchemy as well. A system of symbolic induce enlightenment. Flow must be built up over time. I had been doing a lot of work prior to the week t peaked. I listened to music. I read signs in events to create synchronicities. I let it all carry me away. Remember that Flow is doing everything with no resistance. You are programming the mind to automatically be creative. That means putting things together in one’s head.

The faster one can create, the less resistance to creating things one achieves. And the more complex the creations become. Even in abstract ways not measured by IQ tests. What brought me down from the Flow state was that I became paranoid and overly stressed by life events. Anxiety contorted my brain and I lost my ability to instantly create on impulse. Now it takes effort. The best part of Flow is effortlessness when thinking.

Effortless thinking is a good way to detect intelligence. If a problem is hard for 99% of the population but easy for 1% then it takes more mental effort than can be mustered by most. But that percent that does so with no effort required instantly can solve it. The brain must be organized to take in the information deconstruct it and rearrange the variables to make a solution in as little time as possible.

The brain is pointing to itself and changes how it points to itself based on what is experienced in the world. The brain is checking to see what works or not. Checking what goes together or not. The effortlessness of people’s things comes from the brain’s capacity to see what goes together in a networked representation in the head.

Flow is a synergy between having the internal and external components work together. This way what goes together enhances perception and more can go together than normal. Intelligence is a map of reality and how to survive.

Chris Langan interviewed in 2019

I enjoyed the interview below. I wonder what IQ is required to understand his CTMU. Some argue that communication breaks down when IQ differences exceed 2 standard deviations (SD) so assuming Chris is around +5.9 SD (at least on his second Mega Test attempt) one might expect +3.9 SD to be the threshold but that sounds too high.

I do remember one freakishly high IQ person a couple decades ago who kept a very low profile and claimed people 2 SD above Langan’s level (impossible on the Mega Test) realized the flaws in his theory. This person aggressively lashed out at Langan by saying something like CTMU can’t disprove the unreal’s real: “You can’t deny it and your theory is WRONG!”. Of course this critic could have been the one who was wrong.

Equipercentile equating (Mega vs SAT)(PATMA vs WAIS)

One might wonder how a man like Ron Hoeflin (who had very little income or power) was able to create a test that measured one in a million level U.S. intelligence. After all , wouldn’t you need to administer a test to several million Americans to reliably estimate how well a one a million mind would perform?

But the clever Hoeflin found a shortcut called equipercentile equating, and when I first heard about it a couple decades ago, it blew my mind. Hoeflin didnt need to give the Mega Test to millions of people because millions of people had already taken the SAT, so all Hoeflin had to do was ask people who took his Mega Test to reveal their SAT scores. Assuming they didn’t lie or selectively report, it was simply a matter of equating the distribution of Mega scores with the distribution of SAT scores and then equating a one in a million SAT score (perfect 1600 pre-1995) with its counterpart in the Mega score distribution.

The Prometheus MC Report explained it as follows:

If one assumes that raw scores on the Mega and the SAT are monotonically related to mental ability, i. e., that a higher raw score on either test correlates with higher mental ability, then there is some function z1(n) that relates raw scores on the Mega to standard intelligence scores z and there is some function z2(m) that relates raw scores on the SAT to standard scores z, where z = (IQ-100)/16. It is plausible to assume that the joint probability distribution of z1 and z2 is just the bivariate normal distribution p(z1,z2,r) for some correlation r. This function is symmetric in z1 and z2. Thus, for any random sample for which raw scores exist for both the SAT and Mega, if we have n scores with z1 > 4, then we would expect n scores with z2 > 4. These would not generally be the same n individuals in each case. Thus, if we know the 1-in-30,000 cutoff on the SAT (raw score=1560), and if there are N people in the sample of people taking both the SAT and the Mega scoring at this level or higher on the SAT, then counting down the highest N Mega scores from the sample would give a reasonable estimate of the 4-sigma cutoff on the Mega (raw score=36). Ron Hoeflin showed that, if you do this for several different cutoffs, then the resulting Mega normalization is linear over a range of scores including 36. This linearity feature seems to be standard on IQ tests over their range of applicability.

We are aware that there are difficulties in this argument (e.g., with respect to self-reporting of SAT scores, nonrandomness of sampling, small sample sizes, and mathematically allowed but “unphysical” test scores associated with ceiling effects).

To this day I have no idea what “unphysical” test scores are by they sound fascinating!

In my opinion equipercentile equating only works if (1) both tests being paired are more or less equally correlated with g (or some other factor(s)), and (2) the people in your sample were not selected by one of the tests being equated. So if your sample were Harvard undergrads, you wouldn’t want to equate Mega scores with SAT scores because the undergrads were selected by the SAT and thus would be expected to regress to the mean on any other test they take. Much better to equate their LSAT scores to their Mega scores.

Equipercentile equating the PATMA & the WAIS

I noticed that at least six commenters had reported both their PATMA and WAIS scores.  The first two columns of table 1 rank the commenters by their PATMA scores.  The second two rank them by their WAIS scores.  This side by side ranking allows us to equate PATMA scores with their WAIS equivalent.  In some cases commenters took a version of the WAIS over a decade after its norms were published so scores might be inflated by a few points because of the Flynn effect.  

Table 1
Name PATMA score WAIS IQ Name
 Ganzir  10  150+  Teffec P
 Teffec P  10  150  Ganzir
 Dexter  9  141  Billy
 Billy  8  133  Dexter
 Gman  7  120  Gman
 Illuminaticat  6  112  Illuminaticat


Although the sample size is small,  preliminary data suggests an absurdly high correlation between the two tests (r = 0.94!).  Indeed the line of best fit predicts:

Expected WAIS IQ = 9.025(PATMA score) + 59.125

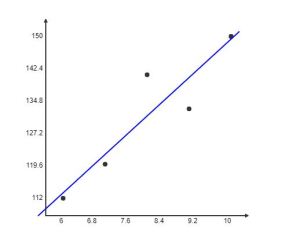
Instead if we graph the data by score of equivalent rank (rather than scores made by the same person) it seems the PATMA has an incredibly linear relationship to IQ (r = 0.9975) expressed by the equation:

WAIS IQ Equivalent = 9.625(PATMA score) + 54.125:


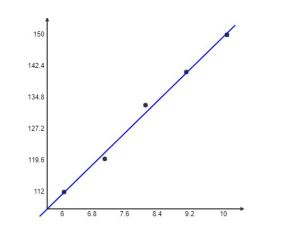
Note the subtle distinction between formulas.  The first is telling us the expected WAIS IQ of someone with a given PATMA score.  The second is telling us what WAIS IQ you’d get if you performed as well or as poorly on the WAIS as you did on the PATMA.

Notice that only two people in this extremely bright sample scored a perfect 10 on the PATMA and only two people also scored 150+ on the WAIS (incidentally the same two people).  This suggests a perfect 10 on the PATMA equates to about a 150 IQ (+3.33 SD) however this is a conservative estimate because Teffec P suspects his PATMA score might have benefited from reading this blog (teaching to the test) and his WAIS score was likely suppressed by ceiling bumping (his median scaled score was the highest possible scaled score and much higher than his mean scaled score).  Correcting for this suggests that on a ceiling-free WAIS he would have scored 164.  So if his PATMA score is too high and his WAIS score is too low, than we get a very different equivalents:

Table 2
Name PATMA score WAIS IQ Name
 Ganzir  10  164  Teffec P
 Dexter  9  150  Ganzir
 Teffec P  8  141  Billy
 Billy  8  133  Dexter
 Gman  7  120  Gman
 Illuminaticat  6  112  Illuminaticat

However for now I’ll stick to the flawed but real data in table 1 rather than the speculation that is table 2.

Very high ceiling IQ test

Tags

Commenter Ganzir wrote the following in some emails he sent me:

Have you been interested in taking the original Mega Test? If so, you’re semi-in luck because Bill Bultas’ alliqtests website hosts Brainbreaker, its nearly isomorphic predecessor: 
Verbal section
Non-verbal section
Note that the auto-scoring norms are severely deflated because people can review the answers and retake the test. If you want to better estimate your IQ from this test, you can use the norms here, although Mega norms would probably work too since the tests are so similar.
I scored 19 on the verbal section. To my eternal regret, I rage-quit the non-verbal section partway through and looked at the answers, so now I can’t take it, but I think I would have scored 5-10. That would give me an IQ of 149-154, perfectly in line with my other scores on high-quality tests.
Note: the auto-scoring key answer for verbal item #24 is incomplete, although I can’t specify further without potentially giving away the answer…

…I forgot to mention that those norms have σ=16, so on the σ=15 scale that would be about 146-151, which is slightly more concordant with my other scores.

Quick update on PATMA norms

Tags

, ,

Excluding the 10 troll perfect scores by commenter Mug of Pee, it seems 186 readers have shared their PATMA scores in the anonymous poll. By normalizing the distribution of my readers’ PATMA scores and assuming a mean IQ and SD of 129 and 19 respectively compared to the U.S. mean and SD of 100 and 15 respectively, the following chart was achieved.

PATMA scorefrequency among PP readerspercentile rank among PP readersIQ (U.S. norms)IQ (U.S. white norms)
102294.08159158
94177.15143141
84947.04128126
74426.6118116
62110.48105102
563.039491
421.089188
310.548682
20  
10  
00  

I’m very happy that despite having no time limit, the PATMA appears to have such a high ceiling. I estimate that only about 10,000 people in all of America could score perfect on the PATMA.

Re-norming the Verbal (Gc) Test

Recently my readers and I took the quick and enjoyable Verbal (Gc) Test developed by Antjuan Finch. Finch provides the following norms for his test:

I polled my readers on how they did on this quiz

I converted these results into percentiles and then normalized Z scores, but because my readers are far smarter and more variable than the general U.S. population (mean 100, SD 15) the Z scores were multiplied by an SD of 19 and added to a mean of 129 (U.S. norms). Despite adding the Z scores to such a high mean, my IQ equivalents were still much lower Finch’s:

30 = 78 percentile (among PP readers) = IQ 144

29 = 48 percentile = IQ 128

28 = 34 percentile = IQ 121 (Very Bright)

27 = 25 percentile = IQ 116

26 = 20 percentile = IQ 113

25 = 16 percentile = IQ 110 (Bright)

24 = 14 percentile = IQ 109

23 = 13 percentile = IQ 107

22 = 9 percentile = IQ 104

21 = 6 percentile = IQ 100 (U.S. average)

19 to 20 = 5 percentile = IQ 97

18 = 3 percentile = IQ 94

A quick verbal IQ test

So there’s a quick online verbal IQ test supposedly by a Harvard student who once commented on this blog.

I decided to take a look just to see what type of computer program was used to create it, and before I knew it the the test was timing me. Well I better take it now I thought, since I’ve already seen a couple questions but I was annoyed to have been caught off guard by the immediate timer.

Once I started reading the questions I thought “Oh easy peasy! Like Oprah doing long division in the fourth grade.”

I was surprised by how well I did because although my childhood verbal IQ was a superior 120, it was much, much lower than my non-verbal IQ (partly because my general knowledge was mediocre). On the other hand, as an adult I scored in the 99.9 percentile on a test of written expression and perhaps this test gets at that specific part of verbal ability since it’s all about choosing the right word to complete the sentence.

The test has only 30 questions to be completed in 15 minutes, and remember, it starts timing you as soon as you start. If you think you are ready, press this link and then share your score in the anonymous poll.