Principal Component Analysis (PCA) is a mathematical technique by which many data points get reduced to a smaller number of more manageable data points.
Cavali-Sforza lumped humans into nine major populations. The following shows his phylogenetic tree of these nine populations followed by a matrix showing the genetic distance between them:
Because I wanted to see if these nine populations could be objectively reduced to a smaller number, I made all the distances negative and then entered the genetic distance matrix into a minitab spread sheet.
The reason I made the distances negative is because PC analysis is usually done on correlation matrices where the higher the value, the more similar. In a genetic distance matrix, it’s the opposite, hence the negative signs I added.
The principal component analysis gave the following result.
To determine how many principal components to retain, mathematicians use what’s called the eigenvalue > 1 rule, which in this case means only three components.
The first component explains 54% of genetic variation and since Northeast Asians have the highest loading on this component (0.432), it can be thought of as a measure of Northeast Asianness. Africans are the only group to load negatively on Northeast Asianness (-0.376).
The second component explains 26% of the variation and since Europeans have the highest loading on this (0.526), it can be considered a measure of whiteness.
The third component explains 12% of the variation and since Native Americans have the highest score on this (0.527) it can perhaps be considered a measure of “New Worldliness”.
Now when I plot each of the nine populations in three-dimensional space (x axis = Northeast Asianness, y axis = whiteness, z axis = New Worldliness) with their loadings multiplied by 10 to make differences visible, we find all of the nine populations fit into three major clusters.
made using Graphing Calculator 3D
These three clusters are extremely similar to the three major races of physical anthropology: Mongoloids on the back wall, Negroids on the side wall, and Caucasoids on the floor.
No disrespect to Caucasoids (I’m 100% pure Caucasoid myself). The graph can be reoriented so any group is on the floor.
One anomaly is that New Guineans & Australian aboriginals cluster with Mongoloids, even though they are morphologically closest to Negroid. Of course such anomolies are not uncommon in taxonomy. Birds for example genetically cluster with reptiles, even though they’re not reptiles. Humans cluster with apes, even though we’re not apes.
Such anomalies occur because most of our DNA is junk, so it groups us based on how recently we share common ancestors, not by how much of that common ancestor we shared.
The following chart (created by some scientist(s) led by David Reich) shows the genetic divergence between hominin samples as a fraction of the human-chimp difference. So for example, all the human groups have just over a 0.12 genetic divergence with Neanderthals, meaning that the genetic difference between humans and Neanderthals is only 12% as great as the genetic difference between humans and Chimps (source: supplement of Genetic history of an archaic hominin group from Denisova Cave in Siberia.)
The purpose of the chart is to estimate how long ago the different populations diverged from a common ancestor. So since the fossil record tells us that Neanderthals and chimps diverged about 6.5 million years, then humans and Neanderthals should have diverged roughly 0.8 million years ago (12% of 6.5 million) assuming genetic divergence maps to chronological divergence in a linear way.
I transformed the genetic distance matrix into a dendrogram, which looks at all the distances and creates the most parsimonious family tree:
Dendogram showing genetic relationship between 8 groups. From left to right: chimps, san, Yoruba, French, Papuan, East Asian, Denisovan, Neanderthals
What’s cool about dendrograms is they let you determine the number of categories and subcategories in a very objective way.
Of course dendrograms are only as good as the data you put into them, and I don’t endorse basing taxonomy simply on genetic relatedness, but if I did, here’s how I’d interpret the above tree:
The first major split is between chimps & everyone else. This is consistent with two well recognized genera of hominins : Pan (i.e. chimps) and Homo (humans and near-humans).
Now within the Homo genus, we see another major split in the tree. Anatomically Modern Humans (AMH) vs Archaic Humans. Thus we can divide the homo genus into at least two major species.
Within the Archaic Humans we can further subdivide into major races: Denisovans and Neanderthals.
Now within our own species, AMH, the dendrogram shows three major races: Capoids, Congoids and Non-Africans.
I’m not saying I agree with this taxonomy since it was only based on genetic distance (much of which is junk DNA) but what’s great about using dendrograms is almost everyone looking at them will assign groups to the same categories and subcategories, even if they don’t use the same words (race, species, genus) to describe them. It’s wholly objective.
But what is needed is a dendrogram based on polygenic scores of actual phenotypes. That way people who have the same phenotypes caused by the same genomic architecture could be grouped together.
Unlike the above dendrogram, which groups based on how recently we share a common ancestor, we need to group based on how much of the common ancestor we share.
[update may 26, 2019: an earlier version of this article misspelled dendrogram]
[2nd update may 26, 2019: an earlier version of this article contained bragging that has since been removed]
It’s common knowledge in psychometrics that U.S. whites average about one standard deviation (15 IQ points) higher than U.S. blacks and have done so since the first mass tests were administered in WWI.
But could the gap extend much further in space and time? Tens of thousands of years further.
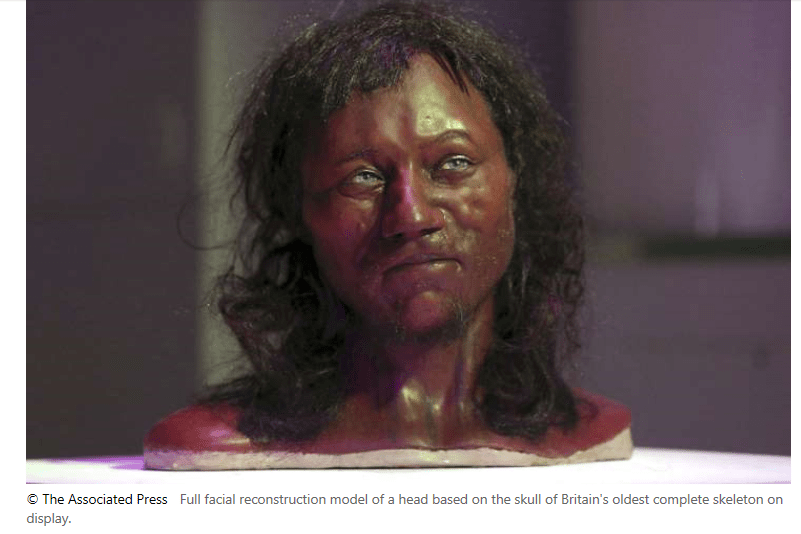
At first it sounds absurd: there were no IQ tests 15,000 years ago, and there weren’t any white people. The earliest Europeans had dark skin, and they were largely replaced by Middle Easterners spreading agriculture.
Archaic European
Nonetheless, there were people living in Europe 15,000 years ago and to the degree they resemble today’s Europeans (phenotypically and genetically) they’re a proxy for archaic whites.
Similarly, the oldest lineage in Africa are Bushmen, and to the degree they resemble modern Africans, they’re a proxy for archaic blacks.
The archaic whites left the following rock art over 15,000 years ago.
IQ 74 (1963 US norms)IQ 144 (1963 U.S. norms)
The archaic blacks left the following rock art, perhaps much more recently.
IQ 74 (1963 U.S. norms)IQ 118 (1963 U.S. norms)
When I asked readers to rate the two archaic white paintings using the quality scale of the Dale-Harris Draw-A-Man test, the median votes were 3 and 11, giving the archaic whites a mean score of 7.
votes for the first European paintingvotes for the second European painting
For archaic blacks, the median votes were 3 and 8, giving archaic blacks a mean score of 5.5.
votes for the first African painting
votes for the second African painting
That’s a difference of 1.5 points. Since the standard deviation for incipient adults (age 15) on the Goodenough-Harris quality scale is 1.7, archaic whites over 15 thousand years ago were already nearly one standard deviation (15 IQ points) higher than archaic blacks living later.
From Children’s Drawings as Measures of Intellectual Maturity by Dale B. Harris
Of course with such a tiny sample size, this conclusion is EXTREMELY tentative and requires far more research.
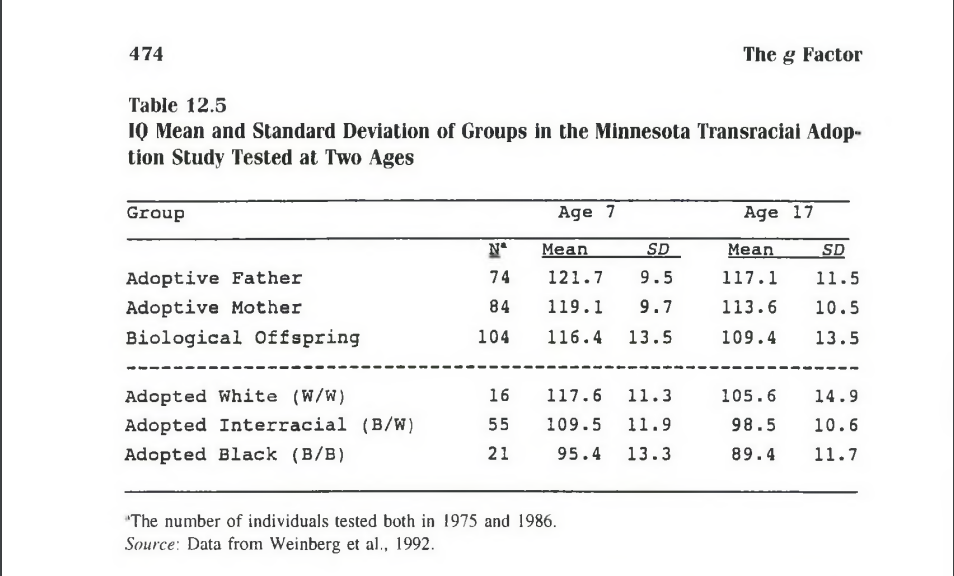
In the Minnesota Transracial Adoption study, white babies, black babies, and mixed babies (biological father black; biological mother white) were adopted into white upper middle-class homes when they were 19 months, 32 months, and nine months respectively. The purpose of the study was to determine how much of the 15 point black-white IQ gap in the United States is genetic.
In 1975, the children and adoptive parents were IQ tested on at least an abbreviated versions of the Stanford Binet/WISC/WAIS (depending on age), and then retested in 1986 on the WISC-R/WAIS-R depending on age. Here are the results:
Source: page 474 of The g Factor by Arthur Jensen
Because the norms on all the tests were out-dated at the time of testing (especially in 1975), John Loehlin attempted to correct all scores for the Flynn effect.
But many people ignore the IQs themselves, and instead just focus on the IQ differences. They see that at age 17, adopted whites scored 7.1 points higher than adopted mixeds in the unadjusted data, and 16.2 points higher than the adopted blacks, and conclude that the 15 point black-white IQ gap in the United States is roughly 100% genetic.
One problem with this is that black babies were adopted later than the non-black babies. Another problem is they were born to black mothers, while the non-black babies were all born to white mothers, so the prenatal and perinatal environments may have been quite unequal.
Thus I have always been more intrigued by the 7.1 IQ gap between the adopted whites and adopted mixeds. Since the adopted mixeds presumably had only half as much black ancestry as the typical U.S. black, it’s interesting that there’s roughly half the infamous 15 point black-white IQ gap, despite being gestated in white wombs and raised in white homes. Does this point to the importance of genetics?
Physicist Drew Thomas argues that the comparison between the adopted whites and adopted blacks is misleading because in the tables posted above, at both ages we only see data for the adopted kids who remained in the study for the follow-up testing in 1986. He argues that several low IQ adopted white kids dropped out of the study, and had they remained, the IQ gap between the adopted whites and adopted mixeds would have perhaps been only 3.5 points at age 17.
However this argument is starting to feel a little post-hoc. When you do a study, your data is what it is. You can’t adjust it for what it would have been had people you wished remained in the study. Almost any study can be debunked if we imagine how it would have turned out in a parallel universe where different people took part.
That’s not to deny that adjusting for attrition can be important in some cases, but in this study, Thomas argues attrition only increased the IQs of adopted whites and not the adopted non-whites. An effect that only affected one demographic sounds to me like random error, not a systematic bias that needs to be adjusted for. And if the error was random, one could just as easily argue the IQs of adopted whites were too low before the attrition rather than too high after the attrition.
Indeed if the adopted white sample is so easily skewed by a few kids dropping out of the study, then maybe that sample is too small to begin with, and instead we should compare the much larger sample of adopted mixeds not to the adopted whites, but to the general U.S. white population.
At an average age of 17, the adopted mixeds took the WISC-R and WAIS-R depending on age, and averaged 98.5 (93.5 after adjustments for the Flynn effect, since WISC-R and WAIS-R norms were 14 and 8 years old respectively at the time of testing).
However some top-secret research I’ve been slowly doing over the past decade suggests the Flynn effect has been wildly exaggerated, so while I don’t think their average IQ was as high as 98.5, I also doubt it was as low as the Flynn corrections say. Let’s split the difference and say 96 (U.S. norms).
By contrast, the whites in the WISC-R and WAIS-R standardization samples averaged 102.2 (standard deviation (SD) = 14.08) and 101.4 (SD = 14.65) respectively. Let’s split the difference and say 101.8 (SD = 14.4).
Thus converting to the more traditional scale where the U.S. white mean and SD are set at 100 and 15 respectively, the adopted mixed mean of 96 becomes ((96 – 101.8)/14.4)(15) + 100 = 94.
In other words, despite being gestated in white wombs and raised in upper-middle class white homes, having just one U.S. black biological parent appears to have reduced IQ by 6 points, suggesting that having two U.S black biological parents would reduce IQ by 12 points, suggesting that 80% of the 15 point black-white IQ gap in the U.S. is genetic. 80% squared is 0.64 which is similar to the 0.69 heritability of the WAIS full-scale IQ found in Thomas Bouchard’s study of identical twins reared apart, consistent with Jensen’s default hypothesis which claimed that IQ gaps between U.S. races are caused by the same nature-nurture mix that occurs within them.
To paraphrase President Obama, there is no black America or white America; from a nature-nurture perspective, there’s just America.
While this analysis seems to have controlled for the prenatal and family environment, it’ does not control for peer groups. Maybe as mixed kids raised in white homes, they were unmotivated on IQ tests because of the racist stereotype that being smart = acting white. On the other hand, they did better on scholastic tests than they did on formal IQ tests, suggesting motivation was not a problem.
If the genetic part of the U.S. black-white IQ gap is indeed 12 points and black Americans are only about 74% black on average it implies that 100% West African ancestry would reduce IQ by 16 points below the U.S. white mean (at least if we assume U.S. black ancestry is representative of West African ancestry).
And at least if we assume the Phenotype = Genotype + Environment model
Some readers invoke a reaction norm model where genotype A is higher IQ than genotype B in environment A, but lower than genotype B in environment B. Assuming such norm crossing occurs with IQ, my sense is that it would be limited to individual cases and cancel out in group level comparisons like the black-white IQ gap.
Some might argue that it’s inappropriate to compare adopted mixeds to the general U.S. white population because adopted mixeds might not be genetically representative of their parent populations. In The g Factor, Jensen states that the parents of the mixeds averaged 12.5 years of schooling (page 473) while just the mothers averaged 12.4 (page 478). From here we can deduce that the fathers averaged 12.6.
In 1975 America, white women and non-white men age 25+ had a median of 12.3 and 11.3 years of schooling respectively (see table 4 of this document). Comparable figures in 1986 were 12.6 and 12.5. So using education as a proxy, there’s no reason to think the mixed kids were selected to have lower IQs than the mean of their parent races. If anything, their biological fathers averaged more education than age 25+ non-white men throughout the full duration of the study and their biological mothers averaged about the same education as age 25+ white women.
Of course it would help to know the exact ages of the parents, rather than just lumping them in with everyone over 25. I can’t find the age of the biological parents of the mixeds specifically, but the bio moms and dads of all the kids who took part in at least part of the study (see table 3 of this paper) averaged 21.6 and 26.3 at the time the kids were born, and thus were about 29 and 33 in 1975 and about 39 and 43 in 1986, thus they were likely near the median age of the 25+ cohort by the end of the study.
Although this study shows the black-white IQ gap is highly genetic, several similar studies beg to differ. Tizard (1974) compared black, white and mixed-race kids raised in English residential nurseries and found that the only significant IQ difference favored the non-white kids. A problem with this study is that the children were extremely young (below age 5) and ethnic differences in maturation rates favor black kids. A bigger problem with this study is that the parents of the black kids appeared to be immigrants (African or West Indian) and immigrants are often hyper-selected for IQ (see Indian Americans).
A second study by Eyferth (1961) found that the biological illegitimate children of white German women had a mean IQ of 97.2 if the biological father was was a white soldier and 96.5 if the biological father was a black soldier (a trivial difference). Both the white and mixed kids were raised by their biological white mothers. One problem with this study is that the biological fathers of both races would have been screened to have similar IQ’s because at the time, only the highest scoring 97% of whites and highest scoring 70% of blacks passed the Army General Classification Test and were allowed to be U.S. soldiers. In addition, 20% to 25% of the “black fathers” were not African-American or even black Africans, but rather French North Africans (non-white caucasoids or “dark whites” as they are sometimes called). In addition, there was no follow-up to measure the adult IQ of the children.
A third study by Moore (1986) included a section where he looked at sub-samples of children adopted by white parents. He found that nine adopted kids with two black biological parents averaged 2 IQ points higher than 14 adopted kids with only one biological black parent but the sample size was quite small, I don’t know anything about the bio-parents and again, no followup when the kids were older.