Charles Murray & the strangely high ceiling of the old SAT

On page 694 of the book The Bell Curve by Richard J. Herrnstein and Charles Murray, they mention that the U.S. average on the verbal SAT during the 1980s if all U.S. 17-year-olds took the test, not just the college-bound elite. This data was arrived at using special studies by the college board, where they recruited a nationally representative sample of teens to take the SAT.

But I wanted to know the standard deviation of the math SAT. I knew over a decade ago, but had since forgotten. I reached out to the author of the study Murray cited, but he no longer had a copy of his own paper.

“Why don’t you ask Charles Murray?” somebody said.

“Charles Murray is the most influential social scientist on the planet. He ain’t gona respond to some nobody blogger” I replied.

“But you’re not just any blogger, you’re Pumpkin Person! Never underestimate the power of that brand” they said citing my lucrative advertising deal with wordpress which has been earning money on top of money.

So I sent off a message to the World’s most influential social scientist, not expecting any reply.

He responded IMMEDIATELY.

“Okay, okay, I’ll see if I can find it” he wrote on February 18, 2019.

Precisely 12 minutes later he wrote:

“Verbal mean 375.8, SD 102. Math mean 411.5, SD 109…”

The most influential social scientists on the planet managed to dig up a paper he hadn’t cited in a quarter century with incredible speed and was kind enough to also take an iphone photograph from one of the pages.

But how do we determine the SD for the combined old SAT?  Well since we know the estimated means and SD of the subscales, then the below formula is useful for calculating the composite SD (from page 779 of the book The Bell Curve by Herrnstein and Murray):

formula

r is the correlation between the two tests that make up the composite and σ is the standard deviation of the two tests.

Herrnstein and Murray claim that for the SAT population, the correlation between SAT verbal and SAT math is 0.67. Assuming it would be the same for the general U.S. 17-year-old population, then the 1980s SAT had an SD of 192.8

Some might argue that the 0.67 correlation in the SAT population would underestimate the correlation in the general U.S. 17-year-old population, because the SAT sample is a restricted group and thus should be corrected for range restriction. .

However surprisingly, the math SAT standard deviation for the SAT population was 119 in the 1980s (higher than the 109 in the general population).
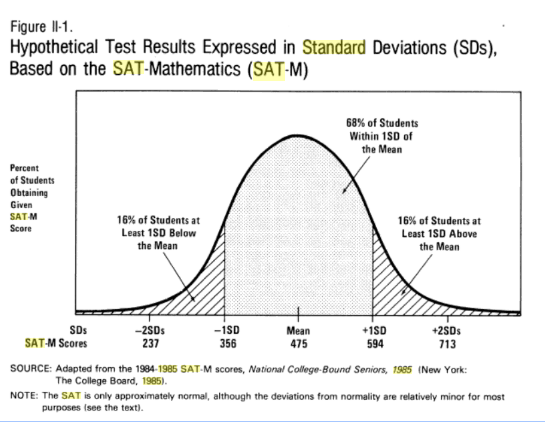
Source: Trends in educational achievement
By Daniel M. Koretz, United States. Congressional Budget Office

So assuming that if all U.S. 17-year-olds had taken the SAT in the 1980s, the combined mean would be 787.3 with an SD of 192.8, then a near perfect score of 1590 would have equated to +4.16 SD or an IQ equivalent of 162.

However as I wrote back in March 2018:

The above conversions were based on the assumption that the SAT would have a roughly normal distribution in the general U.S. population, which is likely true for 99% of Americans but likely false at the extremes.

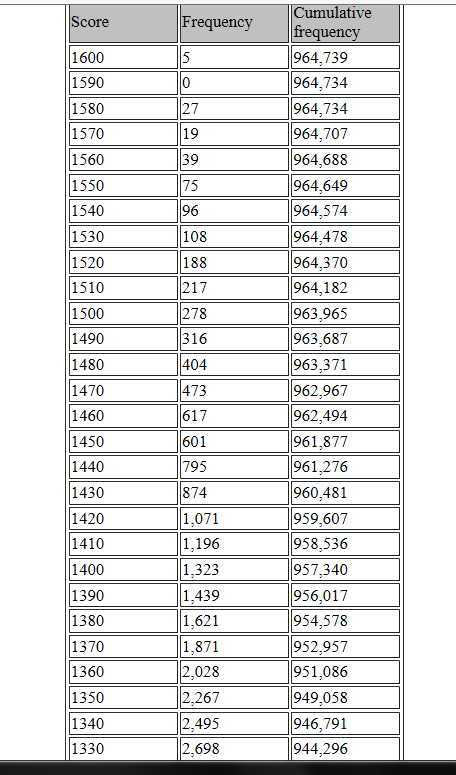
Below is incredibly rare data of the total number of people in 1984 who scored high on the combined SAT.
sat1984

Table IV

We see that of the 3,521,000 Americans born in 1967, roughly 964,739 would grow up to take the SAT at age 17 in 1984.  And of those who did, only 20,443 scored above 1330.  If one assumes, as the great Ron Hoeflin does, that virtually all the top SAT talent took the SAT in 1984 (and whatever shortfall was madeup for by foreign students), then those 20,443 were not just the best of the 964,739 who actually took the SAT, but the best of all 3,521,000 Americans their age.  This equates to the one in 172 level or IQ 138+ (U.S. norms).

Meanwhile, only five of the 3,521,000 U.S. babies born in 1967 would grow up to score 1590+ on the SAT, so 1590+ is one in 704,200 level, or IQ 170+.  However above I claimed that in the mid 1980s, the combined SAT had a mean of 787 and an estimated SD of 220, which means 1590 is “only” +3.65 SD or IQ 155.  Clearly the SAT is not normally distributed at the high extreme, so Z scores start to dramatically underestimate normalized Z scores, and modern IQ scales only care about the latter.

Thus, for extremely high SAT scores obtained in the mid 1980s, please use table V and not formula IV:

Table V:

1984 satiq equivalent(u.s. norms) based on normalized Z scores(sd 15)
1600170+
1590170
1580164
1570163
1560161
1550159
1540157
1530156
1520154
1510153
1500152
1490150
1480150
1470148
1460147
1450146
1440146
1430145
1420144
1410143
1400142
1390141
1380141
1370140
1360139
1350139
1340138
1330137

Cultural bias on IQ tests

Commenter RR has a left a series of comments on this blog denying the very idea of culture fair IQ tests.

For example he writes:

. CULTURE-FREE IQ TESTS ARE AN IMPOSSIBILITY AS ALL HUMAN COGNIZING TAKES PLACE IN A CULTURAL CONTEXT!

This is a tautology not a testable hypothesis. The concept of culture bias needs to be operationalized if it wants scientific credibility.

In the field of psychometrics, a test is typically defined as culturally biased if the regression line predicting school performance from IQ is different in one group than another. For example, if blacks with an IQ of 120 get an A in algebra (on average), but whites with IQs of 120 get only a B, then the test is said to be culturally biased against blacks.

Why? Because if the test is underpredicting the grades of black kids, then it’s probably also underpredicting their intelligence as well.

The literature on predictive bias is extensive and it turns out that by this definition, neither IQ tests nor college admission tests are biased against any visible minority group in the United States. Indeed just the opposite, the tests tend to overpredict black achievement, and thus might even be considered biased against whites!

However this definition assumes that the criterion that test is predicting (i.e. school grades) is itself free from bias, but what could be more culturally loaded than school (the place where culture is explicitly taught).

Perhaps a better criterion than school grades would be real world survival skills. We could dump people in the middle of the woods and see how long they take to find their way out (each person would have a GPS locator they couldn’t use but could be used to find them) or have people compete in mock warfare like paintball. Again, if blacks with an IQ of 120 performed as well as whites with an IQ of 120 on these tasks (equating for practice and physical fitness), then IQ tests are unlikely to be culturally biased. But if 120 IQ blacks dominated 120 IQ whites, then it’s likely the tests are underestimating their intelligence.

Another way of testing for culture bias, as Jensen has alluded to, is to compare groups on physiological measures of intelligence like MRI brain size, evoked brain potentials, nerve conduction speed, neural adaptability reaction time etc. Jensen estimates that a comprehensive battery of such tests would correlate > 0.5 with IQ and this would be ideal for testing for culture bias. If for example, the nation of Nepal scored 3.8 standard deviations below the UK mean on tests like the Raven we would want them to take the physiological measure of intelligence.

The > 0.5 correlation would between IQ and its physiological proxies predicts that Nepal would score at least 3.8(0.5) = 1.9 SD below UK norms on physiological measures, but if they would score much better than this (and they would) we would know that the IQ test was culturally biased against them, and thus is dramatically underestimating their neurology.

We can never say, categorically, than any given test is culture fair, but what we can say is that test A is culture fair with respect to cultures B and C. For example in the 1920s it was proven that hardcore performance tests (similar to Block Design and Object Assembly subtests on the WAIS) are culture fair to people with and without schooling. I wrote the following in 2014:

… excellent research in the 1920s showed that canal boat children who lived a nomadic existence where they were virtually deprived of schooling, showed massive declines in IQ as they got older. Because IQ tests are normed for age, and because these kids were kept out of school they fell further and further behind their chronological age-mates on the type of knowledge that IQ tests measure. Young canal boat kids would have an IQ around 90, but older canal boat kids would have an IQ of 60. However in a footnote on page 1001 of this document, scholar Arthur Jensen writes:

When the canal boat children were tested on nonverbal performance tests, there was much less decline in scores and the average IQ of the children was 82, which is a typical value for unskilled workers, as the canal boat people were. Fewer than 1 in 10 obtained performance IQs below 70, and in fact there was a slight positive correlation between performance IQ and age

This demonstrates that some IQ tests really do come close to the culture fair ideal. People understood that in the 1920s, but decades of post-modern propaganda has brainwashed generations of credulous university students into thinking otherwise.

Robert Mugabe’s IQ

Tags

, , ,

photo taken July 1, 1984. ALEXANDER JOE/AFP/Getty Images

Several people have asked me to estimate the IQ of late Zimbabwean leader Robert Mugabe.

According to the latest research by Richard Lynn and David Becker, the average IQ of sub-Saharan Africa is 69 however I would argue that if the data is limited to the most culture reduced tests (and I don’t mean the Raven, which is deceptively culturally loaded), it would be about 80 (UK norms/white norms). It’s important to use the most culturally reduced tests when comparing populations separated by time or space, otherwise you get ridiculous results like average IQ increasing by 7 points a decade as happened in Holland on the Raven test.

80 is 20 points the white mean of 100. If black Africans average 20 points below white populations on truly culture reduced tests, then perhaps their leaders average 20 points below the white leaders of mostly white countries.

Publicly available data suggests U.S. presidents have an average IQ of 130 (with an SD of only 12 compared to the national white SD set at 15), so let’s say black African leaders have an average IQ of 110 (SD also 12).

However Mugabe was not just any black African leader. He was exceptionally well educated, even by the standards of World leaders.

To compare Mugabe’s education to other African leaders of his generation, I found a list of the oldest presidents in Africa and tried to determine how many degrees each had. Excluding non-black leaders, the 8 oldest held the following number of degrees:

Paul Biya 4, Manuel Pinto da Costa 0?, Alpha Condé 2?, Arthur Peter Mutharika 2, Hage Geingob 3, Teodoro Obiang Nguema Mbasogo 0?, Emmerson Dambudzo Mnangagwa 2?, Alassane Ouattara 3.

The mean is 2 with a standard deviation of 1.41

So with an astonishing seven university degrees Mugabe is 3.55 SD more educated than even a group as elite as African presidents

In sub-Saharan Africa, the correlation between culture-reduced IQ and education appears to be 0.52, but in a group as homogeneous as African presidents, it would likely be lower. What is needed is the IQ vs education correlation among a specific occupation (African Presidents).

On page 345 of his book Bias in Mental Testing, Arthur Jensen shows the partial correlation between IQ and education, that is the correlation holding occupation constant. This correlation is listed as 0.27 to 0.42 (see below). Let’s split the difference and say 0.35 and assume the same correlation in Africa..

Assuming Mugabe is 3.55 SD more educated than the average African president, the partial correlation predicts his IQ would be 0.35(3.55 SD) = 1.24 SD higher than the average African presidents.

Assuming African presidents have a mean IQ of 110 with an SD of 12 (see above), this would put his expected IQ at 125 (higher than 95% of white America).

All we can say with 95% certainty is that his IQ would be anywhere from 103 to 147. One reason for thinking he’s in the upper end of this range is that he was a Marxist, and left-wing politics are positively correlated with IQ (at least if you control for race and income).

Whatever his IQ, it would have likely been substantially higher had he been born and raised in the United States, where First World nutrition would have allowed his brain size to reach its genomic potential.

One caveat to the above analysis: usually education is measured by highest degree obtained, not number of degrees. How this might affect the correlation with IQ is unclear.

A cross-cultural study of university students

Tags

, , , , , , ,

A 2015 paper by Kate Cockcroft et al., compares the scores of 349 British middle class university undergrads to 107 lower class black South African undergrads on the WAIS-III (UK edition).

The results were as follows:

The UK students averaged a full-scale IQ of 106.95 (UK norms) while the South Africans averaged IQ 93.27. However because this study was published 18 years after the UK WAIS-III was published, we should adjust for the Flynn effect.

The single best source on recent Wechsler Flynn effects is Weiss et al., 2015  which found that full-scale IQ has been increasing by 0.31 points per year, at least in U.S. children. If we assume it’s the same for UK adults, then the UK students have an adjusted IQ of 101 and the South African students have an adjusted IQ of 88.

What’s more interesting to me is how they did on the culture reduced tests since that’s the more fair comparison.

 
Test: Digit Span scaled score Flynn adjusted Digit Span  scaled score Flynn adjusted Digit Span IQ equivalent Block Design scaled score Flynn adjusted Block Design scaled score Flynn adjusted Block Design IQ equivalent Compoite IQ based on adjusted scores on both tests
UK undergrads 9.5 9.32 97 10.66 9.76 99 98
Black South African undergrads 9.35 9.17 96 8.67 7.77 89 91

So on a composite score of the most culture reduced spatial & non-spatial test (Block Design & Digit Span), Black South African undergrads average IQ 91. This is 11 points higher than the average Black South African seems to score on the same culture reduced tests.

As of 2013, only 16% of South Africa’s black young adults were attending higher education (compared to about 55% of whites, 47% of Indians and 14% of Coloureds). Thus, simply attending university puts one in the top 16% of this demographic, with the median South African university student being in the top 8%. If there were a perfect correlation between IQ and education, the median South African black university student would have an IQ 21 points higher than the average black South African. In reality his IQ is only 11 points higher, suggesting a correlation of 0.52 (at least on the most culture reduced tests).

This is similar to the 0.57 correlation between IQ and education observed in the United States.

Looks like the Gestalt IQ test was more accurate than I thought

Y’all remember this test from back in April 2017?

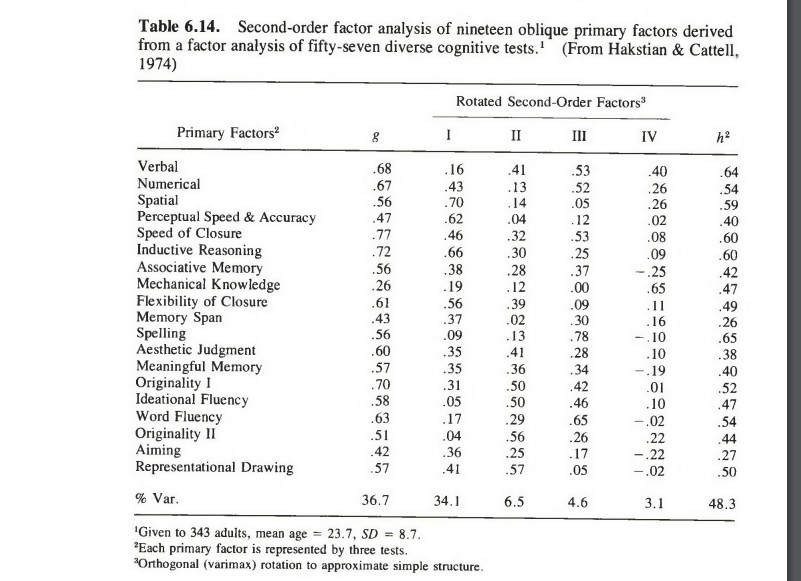
It turns out it might have been more accurate than I thought. On page 221-222 of Bias in Mental Testing, Jensen describes the most comprehensive factor analysis ever done.

Hakstian and Cattell (1974) administered 57 ability tests to 343 adults averaging 23.7 years of age. The tests are extremely diverse and probably constitute the most complete samplings of the domain of cognitive tests to be found in the entire literature. Each of the fifty-seven tests was homogeneous in content so as to be highly representative of a particular primary mental ability. It would be hard to imagine a much greater variety of tests than the fifty-seven tests included in this battery. Hakstian and Cattell factor analyzed the battery, which yielded nineteen significant interpretable primary factors that were rotated to oblique simple structures , that is, the primary factors were intercorrelated. Each of the primary factors is represented by three similar tests.

I have factor analyzed the matrix of intercorrelations among the nineteen primary factors. The results are shown in table 6.14. (The factors resulting from a factor analysis of oblique primary factors are called second-order factors.)

Now for the really interesting part:

The highest g loadings are found on speed of closure (0.77) and inductive reasoning (0.72). Speed of closure involves the ability to complete a gestalt when parts of the stimulus are missing. Time needed for recognition of mutilated words is a measure of this ability. It involves a kind of perceptual inference, of mentally filling in the gaps or “seeing” the relationships among the parts to form a recognizable or familiar whole.

So there you have it: the most g loaded type of test ever discovered are Gestalt.

Not only is the Gestalt test incredibly g loaded, but it’s very culture reduced.

Ironically it was commenter Mug of Pee who selected the items on the Gestalt test I used to test people here and yet the same Mug of Pee states: ” you have to give up on g or give up on the idea of culture reduced tests.”

While it’s true that culture reduced tests are often less g loaded than culture loaded tests, Gestalt is a massive exception. It’s this test that should be used for cross-cultural research, not the Raven Progressive Matrices.

IQ in sub-Saharan Africa

The following chart shows the results of the WISC-IV (UK version) given to several small samples of South African children (circa 2013):

Black Africa’s Wechsler full-scale IQ

Of the six demographic groups tested, the one most representative of black Africa would likely be disadvantaged black Xhosa speakers (DBXS) and these had an average full-scale IQ of 77.08 (UK norms).

However this number is likely an overestimate because the UK WISC-IV was nine years old at the time this study was published. Although I believe the Flynn effect is overestimated because of the kaufman effect and other methodological problems, Weiss et al., 2015 were able to sidestep these issues and show that at least from the 2000s to the 2010s, WISC-IV IQ increased by 0.31 points per year in the U.S.. Assuming UK norms became inflated at the same rate, DBXS have an adjusted IQ of 74.

Of course I realize the absurdity of using a sample of just 12 kids to represent all of black Africa, but it’s so rare to get a non-elite sample of black Africans taking a test as indepth as the Wechsler that I have little choice.

Black African Matrix IQ

Because the verbal subtests of the Wechsler require cultural knowledge that many black Africans have not been exposed to, people might think they would do better on a culture reduced test like the Raven Progressive Matrices. Richard Lynn however cited a series of studies showing black Africans did even worse on the Raven, averaging an IQ no better than 70.

However Wicherts et al,, 2009 accused Lynn of cherry-picking studies and argued that the true average Raven IQ of black Africa was 80. It is therefore interesting to note that on the matrix reasoning subtest of the WISC-IV, DBXS averaged an IQ equivalent of 83 (79 after adjusting for the Flynn effect).

Does this mean Wicherts et al. were right and Lynn was wrong? Probably not. The matrix reasoning subtest on the Wechsler has a test-retest reliability of around 0.66, while the Raven’s might be as high as 0.95. Taking the square root of these values tells us that matrix reasoning correlates 0.81 with true score while the Raven correlates 0.975.

What this means is that if the true score IQ of black Africans on this type of test is 31 points below the UK mean set at 100, they’ll score 31(0.975) = 30 points lower on the Raven, but only 31(0.81) = 25 points lower on the matrix reasoning subtest. The observed subtest score of 79 is not far from this prediction.

How would black Africans score on a truly culture reduced test?

The Raven is often described as a culture reduced test, however given the huge Flynn effect it has shown in some countries, many people are skeptical. One source of cultural bias might be exposure to columns and rows in school and media.

In my opinion, the most culture fair “verbal” subtest on the Wechsler is Digit Span and the most culture fair performance subtest is Block Design. Unlike Matrix reasoning, Block Design is a concrete task that is considered fun, and its fast pace makes it less dependent on culturally acquired values like persistence, cognitive confidence and intellectual discipline.

Thus, it’s interesting to note that after Flynn effect adjustments, DBXS averaged IQ 86 on Digit Span and IQ 80 on Block Design. Given the moderate correlation between these subtests, that works out to a composite IQ of about 80 which I take as a rough estimate for the real intelligence of black Africa.

Note, real intelligence should not be confused with genomic intelligence. Rather, real intelligence refers to a valid measure of the cognitive phenotype, but in the case of black Africans, the genotype is likely higher since even scores on the most culturally reduced tests can be depressed by sub-optimum nutrition and disease.

Who captured African slaves?

Tags

, , , , ,

I remember being a child when I first learned how black people came to the Americas. Before then I had just assumed they were immigrants like other visible minorities but to be told they were brought as slaves was too much for a child’s brain to process. I had never even heard of one group of people enslaving another, even in fiction, let alone in reality. WHAT?

I remember being disturbed by this for months as a child, but learning this fact really paved the way for me to believe in HBD. If slavery could be true, then HBD was likely true too; indeed one would seem to lead to the other.

For how else could one race of people have been so advanced they could just march on to a foreign continent and drag millions of the natives kicking and screaming to the New World as slaves?

However as I got older, a more nuanced picture of slavery emerged.

In 2010, Henry Louis Gates Jr wrote the following in The New York Times:

The historians John Thornton and Linda Heywood of Boston University estimate that 90 percent of those shipped to the New World were enslaved by Africans and then sold to European traders. The sad truth is that without complex business partnerships between African elites and European traders and commercial agents, the slave trade to the New World would have been impossible, at least on the scale it occurred.

Advocates of reparations for the descendants of those slaves generally ignore this untidy problem of the significant role that Africans played in the trade, choosing to believe the romanticized version that our ancestors were all kidnapped unawares by evil white men, like Kunta Kinte was in “Roots.” The truth, however, is much more complex: slavery was a business, highly organized and lucrative for European buyers and African sellers alike….

….For many African-Americans, these facts can be difficult to accept. Excuses run the gamut, from “Africans didn’t know how harsh slavery in America was” and “Slavery in Africa was, by comparison, humane” or, in a bizarre version of “The devil made me do it,” “Africans were driven to this only by the unprecedented profits offered by greedy European countries.”

But the sad truth is that the conquest and capture of Africans and their sale to Europeans was one of the main sources of foreign exchange for several African kingdoms for a very long time. Slaves were the main export of the kingdom of Kongo; the Asante Empire in Ghana exported slaves and used the profits to import gold. Queen Njinga, the brilliant 17th-century monarch of the Mbundu, waged wars of resistance against the Portuguese but also conquered polities as far as 500 miles inland and sold her captives to the Portuguese. When Njinga converted to Christianity, she sold African traditional religious leaders into slavery, claiming they had violated her new Christian precepts.

Gates is trying to make it sound like many African Americans are in denial about the role Africans played in slavery, but perhaps it’s Gates who is in denial and thus projecting onto his co-ethnics. You see, for Gates to admit that white people just marched into Africa and simply kidnapped native Africans by the millions is to grant the white man a level of utter superiority that Gates simply can not live with, so instead he pushes a narrative that slavery was somehow a business exchange among equals.

Perhaps Gates would rather believe his own people sold his ancestors out than believe his own people were so utterly dominated by another people. Meanwhile white academics, eager to absolve their own ancestral guilt over slavery, are more than happy to push Gates’s narrative, which also fits the anti-HBD narrative of the elite.

Ironically the issue of who captured African slaves could make for strange bedfellows, with HBDers and reparation advocates both arguing that it was the white man, and black professors & white republicans arguing Africans sold themselves.

HBD & slavery

Because intelligence can be defined as the ability to adapt situations to your advantage, it’s only natural to expect smart populations to exploit less smart populations. In the extreme case this is known as slavery. For example, humans are smarter than animals and thus enslave horses, camels and other beasts of burden.

Thus if HBD is true, we should expect that among humans, high IQ races turn lower IQ races into beasts of burden, and indeed this has been a major theme of history. Caucasoids enslaved blacks, and among blacks, the Bantu enslaved the lower IQ pygmies. Meanwhile among Caucasoids, the high IQ Ashkenazim have arguably enslaved whites to the extent that they have tricked them into fighting Israel’s enemies for them in the Middle East.

There are exceptions though. Whites have higher IQs than Arabs yet Arabs enslaved whites. East Asians have higher IQs than whites, yet whites have never been enslaved by East Asians.

Aside from our enormous brains, it’s our ability to enslave other animals that most shows the supremacy of human intelligence. Thus among humans we should find that on average, big brained races are smarter than small brained races and that slave master races are smarter than slave races.

Of course some slave races are smarter than the very groups who enslaved them (i.e. whites vs their Arab slave masters ), and some smaller brained races are smarter than their bigger brained counterparts (high IQ Ashkenazim vs the big brained white race), however if my race not only enslaved your race, but ALSO has a bigger brain, I guarantee my race is smarter than yours AND that it’s genetic (on average of course).

Music brings back memories

Tags

,

One of my greatest musical inspirations is Tori Amos. I was introduced to her by a childhood friend of East Asian ancestry and we saw a concert of hers when were like 10 or 12. At the time I was more interested in Tracy Chapman because I played the guitar but seeing Amos in concert was life changing, and inspired me to play the piano like my East Asian friend.

He suspected, based on her facial features, that Amos might be part East Asian which made us like her even more.

What I didn’t know was that he was gay, though my mother suspected. One night when we were teenagers watching TV in the basement, he wanted to watch porn. I had little interest in porn (still don’t) but I enjoy French cinema and this particular porno was French and tastefully done.

But my fiend kept complaining that the male character (who was black) would not take off his speedo.

“Why are you gay?” I finally asked.

“Maybe,” he replied.

He would never quite admit to being gay, instead saying he was bisexual, because sometimes he wanted soft, and other times he wanted hard. But I never saw any sexual interest in females on his part. He had a white girlfriend in high school but he couldn’t stand her, and instead was obsessed with a white preppy guy who attended our school.

After high school we lost touch completely, but I will always be grateful that he introduced me to Tori Amos. I doubt I would have ever heard of her without him. This is one of her best songs: