• About

Pumpkin Person

~ The psychology of horror

Pumpkin Person

Category Archives: Uncategorized

Is the upper paleolithic revolution just another example of cold winters causing high IQ?

28 Wednesday Dec 2016

Posted by pumpkinperson in Uncategorized

≈ 259 Comments

The more I think about the upper paleolithic revolution, also known as the mind’s big bang, the great leap forward, or behavioral modernity, the more I think it fits perfectly with Richard Lynn’s theory that exposure to the ice age caused high IQ to evolve.

The upper paleolithic revolution (UPR) refers to a sudden explosion in culture that occurred in the archeological record around 50,000 years ago.  According to scholar Richard Klein, it was caused by a brain mutation that occurred in East Africa 50,000 years ago that allowed humans either the intelligence or language to leave  Africa and conquer the World.  The only problem with Klein’s theory is no such 50,000 year old mutation has yet been discovered, and most scientists seem to think humans left Africa 70,000 years ago, and most of the evidence for this great leap forward seems to come from Europe, not Africa.

For example here’s a fascinating list of the 10 oldest works of art ever discovered.  Notice how anything older than 50,000 years ago does not really qualify as art.  Only after 50,000 years ago do we get real art, and notice how all the oldest real art was found in Europe.

I think what probably happened is that anatomically modern humans evolved in Africa about 200,000 years ago, and probably had a mean IQ of 72 (genetically and phenotypically).  Then about 70,000 years they left Africa, and were exposed to the challenges of building watertight shelters with strong insulation and animal skin walls,  learning to make fire, creating warm clothes and mastering the complex art of sewing, and figuring how to hunt large animals since plants were not around.  The low IQ people, and low IQ tribes could not adapt to these challenges, leaving higher IQ people as the survivors.

So by about 39,000 years ago, the IQs of the proto-Caucasoids in Europe had finally reached the 80s, and they had discovered not only the art of drawing, but had the spatial ability to draw realistic forms despite having never been exposed to art, and by 38,000 years ago, were making impressive sculptures.

first-art
sculp

Alternative theory

Another theory, popularized by Greg Cochran and Henry Harpending in the book The 10,000 year explosion is that this cultural revolution was caused by gene flow from Neanderthals, which somehow dramatically improved the cognition of modern humans.

One problem with this theory is that Neanderthals went extinct partly because they LACKED these abilities, so it’s ironic to suggest they gave them to us.  Of course it’s always possible that the unique COMBINATION of human and Neanderthal brain genes produced an intellect far greater than either species on its own, but why entertain such a speculative idea when there’s a much simpler explanation that has repeatedly proved useful in the field of HBD: cold winters select for higher IQ.

Share this:

  • Share on X (Opens in new window) X
  • Share on Facebook (Opens in new window) Facebook
Like Loading...

I apologize to Homo erectus

25 Sunday Dec 2016

Posted by pumpkinperson in Uncategorized

≈ 237 Comments

A while back I had estimated that H. Erectus had an average IQ of 55 based on the fact that they had the tool making ability of a 1979 Western seven-year-old,  but more recently I had down graded them to an IQ of 40, based on my assumption that they had the symbolic IQ of 40.

My logic was that their tool making ability only represented their spatial IQ, but a symbolic IQ of 40 dragged down their COMPOSITE IQ to 40.

Brief comment on composite IQs

Statistically naïve readers might be wondering why a spatial IQ of 55 and a symbolic IQ of 40 equals a composite IQ of 40, and not a composite IQ of 48 (the average of 55 and 40).  The answer is that IQ is just a measure of where you rank compared to neurologically normal Northwest Europeans and ranks CAN NOT be averaged to give composite rank, unless the two sub-rankings correlate perfectly.  So if you rank super low in BOTH cognitive domains, then your rank order in the COMPOSITE of both domains will be LOWER than the average of the two, because impairment at BOTH domains is so rare that it pushes your composite way down in the pecking order.  The opposite is true for people who excel in BOTH domains; their composite IQs are HIGHER than the average of each subscale.

Why the apology?

So why am I apologizing to H. erectus?  Because I was wrong to assume their symbolic IQ was only 40.  That assumption was based on the fact that they couldn’t draw AT ALL, thus suggesting they had extremely impaired understanding of symbols or representations.  People who can’t draw ANYTHING obtain an IQ of only 19 on the Draw-a-man test (corrected for old norms), however correcting for culture bias (H. erectus lived in the wild), I raised it to about IQ 40.

How did I know they couldn’t draw?  Because as far as we know, they never drew a single thing in the nearly 1.9 million years they walked the Earth.  However a friend suggested that perhaps they could draw, they just never had the IDEA of drawing.  Inventing the idea of drawing is much more difficult than drawing,  so if they never had the idea in the first place, I can’t assume they were too dumb to execute the idea.

Thus there’s no evidence that H. erectus had a symbolic IQ as low as 40, and the only hard evidence of their IQ remains their tool making ability which equates to an IQ of 55.  Since this is the only data point, I have no choice but to tentatively accept it as their IQ.  And frankly it makes a lot more sense than IQ 40, which is getting into chimpanzee territory.

How much IQ is needed to have the IDEA of drawing?

So while it takes an IQ of only 40 TO draw, how much IQ is needed to come up with IDEA of drawing, if it never existed in your world before?  If you believe in the controversial field of HBD, then perhaps the lowest IQ people in the World are the Bushmen with a genetic IQ of perhaps 72.  Yet even they appear to have come up with the idea of drawing as evidenced by their ancient rock art, so unless a more advanced people taught them this skill, then a population with a mean IQ of 72 is capable of inventing drawing.

What about Neanderthals?

So what about Neanderthals who also never drew?  Earlier I wrongly suggested this implied they too had a symbolic IQ of only 40 (commenter Melo to his credit strongly disagreed) and yet I also speculated that they must have had a much higher spatial IQ to have survived in Northern Europe.  Overall I pegged their mean IQ to be 62.

I still roughly agree with this estimate, but my logic was wrong.  Better logic is as follows:  They were more technologically advanced, more evolved, and bigger brained than H. erectus, so they probably an overall IQ above 55 (H. erectus level); yet they apparently never had the IDEA of drawing, so they were probably lower than Bushmen (perhaps genetic IQ 72 if you take HBD seriously).  Thus, splitting the difference gives an IQ of 64.

Share this:

  • Share on X (Opens in new window) X
  • Share on Facebook (Opens in new window) Facebook
Like Loading...

Quest for Fire: The ultimate HBD movie

23 Friday Dec 2016

Posted by pumpkinperson in Uncategorized

≈ 239 Comments

[update dec 26, 2016: an earlier version of this article estimated the monkey men and cavemen to have an average IQ of 40 & 62 respectively.  I have since changed these to 55 and 64 respectively]

In the past I’ve blogged about how my fascination with HBD started after I saw the movie Quest for Fire at age five (I’m now in my thirties) because it was the first time I had a sense of different levels of human evolution, some more advanced than others, co-existing and competing in a struggle for survival.  The film uses not a word of English, so I strongly recommend it to all my readers, especially my foreign readers.  A fictional language was created for the characters and as you watch the film, you slowly pick up words, and the number of words you can learn might serve as a measure of fluid verbal IQ (as opposed to the crystalized verbal IQ measured by standard vocabulary tests).

For a film over three decades old, it remains remarkably anthropologically accurate today, as it’s now widely accepted that 80,000 years ago, several species of human did indeed co-exist.

The film shows three major levels of human evolution struggling for survival: The primitive monkey men, the cavemen, and the advanced modern humans.  .

The monkey men IQ 55

monkey
Man from the primitive Wogaboo tribe
wo
erectus

If you believe IQ is a scientifically valid concept, then the monkey men probably have an average IQ of 55, both phenotypically and genetically.  Because they were living in the wild and the natural habitat their ancestors spent thousands of years adapting to, I believe most hominins living 80.000 years ago had more or less reached their genetic potential.  The monkey men were smart enough to understand the value of fire and attack their neighboring cavemen with clubs in an attempt to steal it, but not smart enough to speak, create spears or wear clothing.

The cavemen IQ 64

caveman
cavemen
otherneanderthals
moreneanderthals

The cavemen in this film probably had an average IQ of 64.  High enough to wear very crude fur coats,  fight with spears, and to speak in a language of a few hundred words.  They live in terror of being attacked by the monkey men who they call “wogaboo”.  They are smart enough use fire to cook and scare away wolves, and they are smart enough to keep the fire alive for a long period of time, but they are not smart enough to make it.

The modern humans IQ 85

walter
laughingmoderns
moremodern
chief

The modern humans probably have an average IQ 85.  They appear to be fully modern black African type people who speak in a complex language, use throwing spears, build sturdy huts, make beautiful ceramic containers, color themselves grey, wear masks, make fire, and are even smart enough to build their village behind a pond of quicksand that traps intruders from other tribes.  Unlike other tribes, they are evolved enough to have a sense of humor and are constantly laughing at the inferior cavemen.

I doubt any population living 80,000 years ago had the genetic potential to have an average IQ above 70, so the high intelligence of this tribe was perhaps the only unrealistic thing about this movie.  Or perhaps I’m overestimating their IQs.

The film’s impact on my life

After seeing this film as a child, I remembered wishing I had lived 80,000 years ago.  Life was so exciting when he had three different levels of human evolution coexisting in a Darwinian struggle for survival.  So imagine my excitement when scholar J.P. Rushton proposed his shocking theory that Orientals were more genetically advanced than whites who were more advanced than blacks.  While the rest of the World was disgusted that Rushton could promote such horrific “pseudoscience”, I was secretly fascinated, because It was almost as if I had willed my favorite movie into life, except instead of black Africans being the most evolved  humans, as they were 80,000 years ago, Rushton was arguing that they were now at the bottom of the new tri-level hierarchy.

A beautiful love story

Aside from the anthropological value of this film, it’s one of the most romantic movies I have ever seen.  At the heart of the film is a deeply moving love story about a caveman who falls in love with a modern human woman.

Man from the caveaman tribe
raedawn

Even though they speak completely different languages and arguably belong to different species, they forge an intimate bond, as she slowly teaches him how to be human.   Through her tutoring he learns what humour is and laughs for the first time in his life, and while he and his tribe know only how to have doggie style sex, she teaches him how to make love.  This films takes you back 80,000 years in time, and allows you to see the World, through the innocent eyes of the first humans, and all the awe and mystery of the endlessly uncharted landscape.


Share this:

  • Share on X (Opens in new window) X
  • Share on Facebook (Opens in new window) Facebook
Like Loading...

Massive brain mutation 70,000 years ago

21 Wednesday Dec 2016

Posted by pumpkinperson in Uncategorized

≈ 237 Comments

According to eminent scholar Richard Klein, there was a massive genetic mutation that occurred in Africa that SUDDENLY made humans MUCH smarter than they had ever been before.  This mutation did not make the brain any bigger, but it did rewire it, allowing for truly symbolic thought.

According to this article:

To witness the contrast between premodern and modern ways of life, Klein says, sift through the remains from caves along the southern coast of South Africa. Simple Stone Age hunter-gatherers began camping here around 120,000 years ago and stayed on until around 60,000 years ago, when a punishing drought made the region uninhabitable. They developed a useful tool kit featuring carefully chipped knives, choppers, axes and other stone implements. Animal bones from the caves show that they hunted large mammals like eland, a horse-sized antelope. They built fires and buried their dead. These people, along with the Neanderthals then haunting the caves of Europe, were the most technologically adept beings of their time.

However, Klein says, there were just as many things they couldn’t manage, despite their modern-looking bodies and big brains. They didn’t build durable shelters. They almost never hunted dangerous but meaty prey like buffalo, preferring the more docile eland. Fishing was beyond their ken. They rarely crafted tools of bone, and they lacked cultural diversity. Perhaps most important, they left no indisputable signs of art or other symbolic thought.

Later inhabitants of the same caves, who moved in around 20,000 years ago, displayed all these talents and more.

What happened in between?

The burst of modern behavior—like other momentous happenings in our evolution—arose not in South Africa, Klein says, but in East Africa, which was wetter during the drought. Around 45,000 years ago, he believes, a group of simple people in East Africa began to behave in new ways and rapidly expanded in population and range. With better weapons, they broadened their diet to include more challenging and nutritious prey. With their new sense of aesthetic, they made the first clearly identifiable art. And they freed themselves to wander beyond the local watering hole—setting the stage for long-distance trade—with contrivances like canteens and the delicately crafted eggshell beads, which may have functioned as “hostess gifts” to cement goodwill with other clans.

Dramatic evidence of a surge in ingenuity and adaptability comes from a wave of human migration around 40,000 to 35,000 years ago. Fully modern Africans made their way into Europe, Klein says, where they encountered the Neanderthals, cave dwellers who had lived in and around Europe for more than 200,000 years. The lanky Africans, usually called Cro-Magnons once they reached Europe, were more vulnerable to cold than the husky Neanderthals. Yet they came, saw and conquered in short order, and the Neanderthals vanished forever.

Compare that with an earlier migration around 100,000 years ago, in which the Neanderthals eventually prevailed. Physically—but not yet behaviorally—modern Africans took advantage of a long warm spell to expand northward into Neanderthal territory in the Middle East, only to scuttle south again when temperatures later plunged. The critical difference between the two migrations? The earlier settlers apparently lacked the modern ability to respond to change with new survival strategies, such as fitted garments, projectile weapons and well-heated huts.

I’ve done some research and I now believe Homo Erectus had a spatial IQ of 53 and a symbolic IQ of 40, giving it a composite IQ of 41.  Then about 200,000 years ago in East Africa, it mutated into anatomically modern humans and these had a spatial IQ of 75, but a symbolic IQ of still only 40, giving them a composite IQ of 53.

So when they tried to leave Africa, they were brutally killed off by Neanderthals, who in addition to being 2.5 times stronger, had a spatial IQ of 91 and a symbolic IQ of 40, giving them a composite IQ of 62

However sometime after 70,000 years ago, anatomically modern humans mutated again in East Africa into behaviorally modern humans: their spatial IQs stayed 75 but their symbolic IQs suddenly jumped to 75 too, bringing them their composite IQ to 70.

This allowed them to leave Africa without being bullied by the Neanderthals.  The Neanderthals were still 2.5 times stronger, but modern humans were taller, faster, and now 8 points smarter.

Then after evolving to the cold climate of ice age Europe, symbolic IQ improved to 88 and spatial IQ also improved to 88, raising their composite IQs to 87, allowing them to brutally murder all the Neanderthals in record time, despite the huge difference in strength.  The super strong Neanderthals were humiliated to be destroyed by a bunch of scrawny nerdy modern humans

After the Neanderthals were killed off,  the ice age ended, and the malnutrition and disease caused brain size to shrink and composite IQ of modern Europeans to drop to 77.  However with the booming population, new high IQ genes were lifting the composite IQ up to 90.

Then in the 20th century, advances in nutrition, sanitation and vaccines, allowed them to return to pre-agriculture health, and their brains returned to their original size, and with the mutations that occurred during agriculture (see the 10,000 year explosion by Cochran and Harpending), their composite IQ was now 100.


Share this:

  • Share on X (Opens in new window) X
  • Share on Facebook (Opens in new window) Facebook
Like Loading...

Facts of Life IQ episode returns to youtube

17 Saturday Dec 2016

Posted by pumpkinperson in Uncategorized

≈ 386 Comments

Apparently when I complained about the Facts of Life IQ episode going missing from Youtube on my blog yesterday, people in high places noticed because the show has been returned:

I got the most beautiful email this morning apologizing, saying they had no idea someone as important as me was watching, and they’re so honored to have me as a fan.  I’ve printed out the email and framed it.

I’m even being sent the complete series on DVD, a poster signed by all the stars of the show, and vintage Facts of Life T-shirts.  They don’t know what size I take, so get this.  They’re sending me one in:

EVERY

SINGLE

SIZE!

Not to brag, but I am Pumpkin Person.

Meanwhile here’s vintage opening theme song from the The Facts of Life.  What I love about the opening is Charlotte Rae (who played wise den mother Mrs Garrett) sings a line in the theme song itself in her loveable cackling voice, and that line is heard as her character is on screen smiling (excellent editing!)

When your books are what you’re there about

But looks are what you care about

The time is right

To learn the Facts of Life

See 0:47 in the video below:

I was so touched by the level of respect I’ve been shown that I spent the afternoon watching The Facts of Life reunion TV movie from 2001.  It was pretty cheesy in that warm fuzzy way we expect from TV chick flicks, but it was great seeing  the girls we grew up watching blossom into beautiful adult women.

Blair played by Lisa Whelchel is predictably married to some Ken doll rich guy.

Natalie, played by Mindy Cohn has grown up to be a successful journalist obsessively pursued by two good looking guys (You Go Girl!)

Tootie (aka Dorthy) played by Kim Fields has blossomed into a truly gorgeous black woman, and is working as a talk show host and aspiring actress.

tootie


Share this:

  • Share on X (Opens in new window) X
  • Share on Facebook (Opens in new window) Facebook
Like Loading...

Pumpkin Person’s hot chocolate recipe

17 Saturday Dec 2016

Posted by pumpkinperson in Uncategorized

≈ 126 Comments

Since much of North America is in the grip of a freezing weekend, I thought it’d be a good time to share my hot chocolate recipe.  I kind of copied this from a cooking show on OWN Canada (don’t know the name), but simplified it and changed it.

I love to spend winter weekends holded up at my remote lake cottage in the woods, where I put on the fire and snuggle on the couch beneath a sea of blankets, and watch a classy horror film like The Dark Hours, or an Atom Egoyan style dark drama,  or a series of a dark themed series like Six Feet Under, on a huge screen high definition TV.

And of course I need my hot chocolate on the coffee table in front of me, but not just any hot chocolate will do.  If you truly want to live like me and be part of the upper crust of the upper class, you must make your own.

You start with two chocolate bars (100 g each):  One MINTED milk chocolate, the other MINTED DARK chocolate.

photo-2

photo-8

You then break it into pieces and put the pieces in your hot chocolate maker.  If you can’t afford one of these, just use a pot on a stove.

photo-9

Then add a cup of milk and a cup of cream (or 2 cups of half and half if you’re clever).

photo-7

Then heat and mix

photo-5

Until it looks like this.

photo-4

Delicious.

photo-3

A wonderful desert on a cold winter night, like tonight.

Share this:

  • Share on X (Opens in new window) X
  • Share on Facebook (Opens in new window) Facebook
Like Loading...

Educable (mild) Retardation on The Facts of Life

16 Friday Dec 2016

Posted by pumpkinperson in Uncategorized

≈ Leave a comment

Recently I posted an episode of the sitcom The Facts of Life that dealt with IQ, but sadly the video no longer works.

The POWER of this blog is such that almost every time I post a youtube, media owners seem to suddenly realize the enormous value of their old content and remove it from youtube.

Fortunately I found the only other episode of The Facts of Life that seemed to deal with intelligence (watch it quickly before they take it off youtube ).

In this episode, all the girls at the fictional Eastland New York private school are in love with a new boy who delivers the boarding house food, but what they don’t know is he has a tragic secret.

He’s retarded.

When this leads to an awkward confrontation, the school den mother Mrs Garrett makes it all better as usual with some words of wisdom.

One of the reasons the girls on campus don’t notice the boy is retarded is that he looks normal because he has familial retardation, meaning his retardation is just part of the normal spectrum of human intelligence, unlike organic retardation which is caused by a mutation of large effect, which impairs physical appearance and brain functions beyond intelligence.

Commenter “Mug of Pee” will happily concede that organic retardation is independently genetic because it has physical symptoms, but he downplays the independent effect of genes in biologically normal IQ differences.  It would be especially interesting to find cases where familial retardates have identical twins raised from birth in very different countries, because it’s hard to imagine such an immutable disability was not hard wired into the brain.

Another amusing thing about this episode of The Facts of Life is that we’re now in season 4, so the hilarious character “Jo” is by now a regular; the writers felt the show was missing a girl from a working class background.

a84041e7a5238d96444380f1ac108c20
young-john-travolta-10

“Jo” played by Nancy McKeon is like a young female John Travolta in both her appearance, attitude, and tough guy Brooklyn accent.

Share this:

  • Share on X (Opens in new window) X
  • Share on Facebook (Opens in new window) Facebook
Like Loading...

The Facts of Life: IQ episode

14 Wednesday Dec 2016

Posted by pumpkinperson in Uncategorized

≈ 144 Comments

The Facts of Life was a popular U.S. sitcom that originally aired on NBC from August 24, 1979, to May 7, 1988, and then the reruns continued in syndication probably well into the late 1990s so for those of us in our thirties, it was an afterschool ritual, though younger readers may have never heard of it.  I was reminded of the show because Alan Thicke just died (RIP) and he wrote the shows memorable theme song.  The show launched the career of 80s teen star Molly Ringwald and even George Clooney.

The show was about a bunch of girls attending a New York boarding school under the protective care of loveable den mother Mrs Garrett (Charlotte Rae).  The show is a throwback to a more innocent period in American life, and a simpler time, when no problem was too big to be solved by a cup of hot chocolate and a few wise words from Mrs Garrett.

It’s been decades since I’ve seen an episode, but there was one episode I could never forget.  The one where the girls at the school discover their childhood IQ scores and all the harm it does to their relationships and self-esteem.  And as usual the wise den mother Mrs Garret to the rescue.

If you have half an hour to kill, I recommend you enjoy this funny, innocent, wholesome bit of 70s television.  You’ll be glad you did:


Share this:

  • Share on X (Opens in new window) X
  • Share on Facebook (Opens in new window) Facebook
Like Loading...

How well does the SAT correlate with official IQ tests?

14 Wednesday Dec 2016

Posted by pumpkinperson in Uncategorized

≈ 55 Comments

I apologize to my readers for recycling so much old material, but certain crucial issues must be resolved before we can move forward knowledgeably.

In this post, I summarize all I have learned to date about how much high SAT performers regress to the mean when faced with official IQ tests and what this implies about the SAT’s correlation with said tests.  Some of the data may contradict previous posts, as new information has come to light, causing me to revise old numbers.

Study I: New SAT vs the Raven

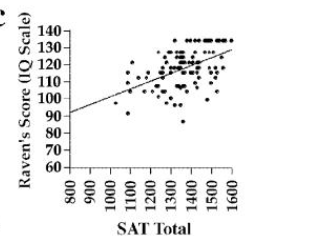
A study by Meredith C. Frey and Douglas K. Detterman found a 0.48 correlation between the re-centered SAT and the Raven Progressive Matrices in a sample of 104 university undergrads, but after correcting for range restriction, they estimate the correlation to be 0.72 in a less restricted sample of college students.  I don’t buy it, but I’m not interested in how well the re-centred SAT would correlate with the Raven among college students, but among ALL American young adults. (including the majority who never took the SAT).

Using the Frey and Detterman data, I decided to look at the Raven scores of those who scored 1400-1600 on the re-centred SAT, because 1500 on the new SAT (reading + math) corresponds to an IQ of 143 (U.S. white norms), which is 46 points above the U.S. mean of 97. Now if the new SAT correlated 0.72 or higher among ALL American adults, we’d expect their Raven scores to only regress to no less than 72% as far above the U.S. mean, so 0.72(46) + 97 = IQ 130.

I personally looked at the scatter plot carefully and did my best to write down the RAPM IQs of every single participant with an SAT score from 1400-1600. This was an admittedly subjective and imprecise exercise given how small the graph is, but I counted 38 top SAT performers and these were their approximate RAPM IQs: 95, 102, 105, 108, 108, 110, 110, 113, 113, 113, 113, 113, 117, 117, 117, 117, 117, 120, 120, 120, 122, 122, 128, 128, 128, 128, 134, 134, 134, 134, 134, 134, 134, 134, 134, 134, 134, 134

raven

The median IQ is 120, and it does not need to be converted to white norms because the Raven was normed in lily white Iowa circa 1993, but as commenter Tenn noted, I should have perhaps corrected for the Flynn effect since the norms were ten years old at the time of the study.  Correcting for the Flynn effect reduces the median to 118 (U.S. white norms) which is 21 points above the U.S. mean of 97.

For people who are 46 IQ points above the U.S. mean on the new SAT to regress to only 21 points above the U.S. mean, suggests the new SAT correlates 21/46 = 0.46 with the Raven in the general U.S. population.

Study II: New SAT vs the abbreviated WAIS-R

Harvard is the most prestigious university in the World with an average SAT score in the stratosphere, thus it’s interesting to ask how Harvard students perform on an official IQ test. The best data on the subject was obtained by Harvard scholar Shelley H Carson and her colleagues who had an abbreviated version of the WAIS-R given to 86 “Harvard undergraduates (33 men, 53 women), with a mean age of 20.7 years (SD 3.3)… All were recruited from sign-up sheets posted on campus. Participants were paid an hourly rate…The mean IQ of the sample was 128.1 points (SD 10.3), with a range of 97 to 148 points.”

It should be noted however that the WAIS-R was published in 1981, and that the norms were collected from 1976 to 1980. Carson’s study was published in 2003, so presumably the test norms were 25 years old.

James Flynn cites data showing that from WAIS-R norms (circa 1978) to WAIS-IV norms (circa 2006) the vocabulary and spatial construction subtest (used in the abbreviated WAIS-R) increased by 0.53 SD and 0.33 SD respectively. These gains would result in the composite score of the abbreviated WAIS-R becoming obsolete at a rate of 0.26 IQ points per year, meaning the Harvard students’ scores circa 2003 were 6.5 points too high. This reduces the mean IQ of the sample to 121.6 (U.S. norms) which is about 120 (U.S. white norms); 23 points above the U.S. mean of 97 (white norms).

However Harvard’s median re-centered SATs of 1490 equate to IQ 143 (U.S. white norms) which is 46 points above the U.S. mean of 97.  Assuming the sampled Harvard students were cognitively representative of Harvard and assuming Harvard is cognitively representative of all 1490 SAT Americans, the fact they regressed from being 46 IQ points above average on the SAT to 23 IQ points above average on the abbreviated WAIS-R, suggests the re-centered SAT correlates 23/46 = 0.5 with the abbreviated WAIS-R.

Study III:  Old SAT vs the full original WAIS

Perhaps the single best study was referred to me by a commenter named Andrew.  In this study, data was taken from the older more difficult SAT, and participants took the full-original WAIS.  In this study, six samples of  seniors from  the extremely prestigious Dartmouth (the 12th most selective university in America) averaged 1357 on the SAT just before 1974. Based on my latest research, an SAT score of 1357 circa 1974 would have equated to an IQ of 144 (U.S. norms); 143 (U.S. white norms).  Because this is much higher than previously thought; the degree of regression is quite devastating.

Assuming these students are typical of high SAT Americans, it is interesting to ask how much they regress to the mean on various subtests of the WAIS.

Averaging all six samples together, and then adjusting for the yearly Flynn effect from the 1950s through the 1970s (see page 240 of Are We Getting Smarter?) since the WAIS was normed circa 1953.5 but the students were tested circa 1971.5, then converting subtest scaled scores to IQ equivalents, in both U.S. norms and U.S. white norms (the 1953.5 norming of the WAIS included only whites), we get the following:

iq equivalent (u.s. norms) iq equivalent (u.s. white norms) estimated correlation with sat in the general u.s. population inferred from regression to the mean from SAT IQ 44 points above U.S. mean.
sat score 144 143 44/44 = 1.0
wais information 128.29 127.2 28.29/44 = 0.64
wais comprehension 122.22 120.9 22.22/44 = 0.51
wais arithmetic 120.37 119 20.37/44 = 0.46
wais similarities 119.16 117.75 19.16/44 = 0.44
wais digit span 117.37 115.9 17.37/44 = 0.39
wais vocabulary 125.93 124.75 25.93/44 = 0.59
wais picture completion 105.87 104 5.87/44 = 0.13
wais block design 121.82 120.5 21.82/44 = 0.50
wais picture arrangement 108.33 106.55 8.33/44 = 0.19
wais object assembly 113.65 112.05 13.65/44 = 0.31
wais verbal scale 126 125 26/44 = 0.59
wais performance scale 116 114 16/44 = 0.36
wais full-scale 123 122 23/44 = 0.52

Conclusion

In three different studies (New SAT vs Raven, New SAT vs abbreviated WAIS-R, Old SAT vs WAIS), people averaging exceptionally high SAT scores averaged only 46%, 50%, or 52%, respectively, as far above the U.S. mean on the official IQ tests as they did on the SAT, suggesting the SAT (old or new), only correlates about 0.5 with official IQ tests.  Correlations in the range of 0.5 are about all you’d expect most educational measures (school grades, years of school) to correlate with IQ, but it’s a surprisingly low correlation given that some consider the SAT to be more than a mere education measure, but an IQ test itself.  So either the SAT is NOT equivalent to an IQ test, or it’s only equivalent to an IQ test among people with similar educational backgrounds, or my method of inferring correlations from the degree of regression is giving misleading results (perhaps because Spearman’s Law of Diminishing Returns is flattening the regression slope at high levels or because of ceiling bumping on the tests involved).

The potentially low correlation between the SAT (and presumably other college admission tests like the GRE, LSAT, etc) with official IQ has some positive implications.  It means that to whatever extent IQ and success are correlated in America, the correlation is a natural consequence of smart  people adapting to their environment, and not the artificial self-fulfilling prophecy of a man-made testocracy.

It also suggests that there’s no substitute for a real IQ test given by a real psychologist with blocks, cartoon pictures, jig-saw puzzles, and open-ended questions.  I can see David Wechsler, chuckling from the grave, saying “I told you so.”

Share this:

  • Share on X (Opens in new window) X
  • Share on Facebook (Opens in new window) Facebook
Like Loading...

Converting pre-1995 SAT scores to IQ yet again

13 Tuesday Dec 2016

Posted by pumpkinperson in Uncategorized

≈ 45 Comments

Many high IQ societies accept specific scores from the pre-1995 SAT for admission, as if all SATs taken before the infamous recentering in April 1995 had the same meaning.  And yet Mensa, which only accepts the smartest 2% of Americans on a given “intelligence test” makes a curious distinction.  Prior to 9/30/1974, you needed an SAT score of 1300 to get into Mensa, yet from 9/30/1974 to 1/31/1994, you needed a score of 1250.

Well, that’s odd I thought, since all SAT scores from the early 1940s to 1994 are supposedly scaled to reflect the same level of skill, why did it suddenly become 50 SAT points easier to be in the top 2% in 1974?  And if such an abrupt change can occur in 1974, why assume stability every year before and since?  It didn’t make any sense.

And I wasn’t the only one who was wondering.  Rodrigo de la Jara, owner of iqcomparisonsite.com, writes:

If someone knows why they have 1300 for scores before 1974, please send an email to enlighten me.


The mean verbal and math SAT scores, if ALL U.S. 17-year-olds had taken the old SAT

To determine how the old SAT maps to IQ I realized I couldn’t rely on high IQ society cut-offs.  I need to look at the primary data.  Now the first place to look was at a series of secret studies the college board did in the 1960s, 1970s, and 1980s.  These studies gave an abbreviated version of the SAT to a nationally representative sample of high school juniors.  Because very few Americans drop out of high school before their junior year, a sample of juniors cam close to representing ALL American teens, and then scores were statistically adjusted to show how virtually ALL American teens would average had they taken the SAT at 17. The results were as follows (note, these scores are a lot low than the actual mean SAT scores of people who take the SAT, because they also include all the American teens who usually don’t):
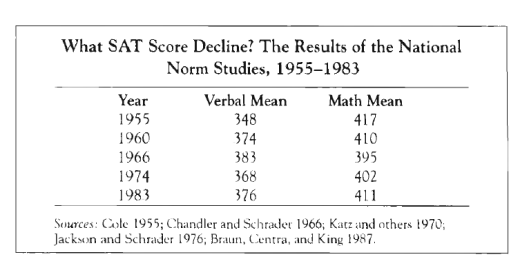
nationalnorm

Chart I: taken from page 422 of The Bell Curve (1994) by Richard J. Herrnstein and Charles Murray: Estimated mean verbal and math SATs by year, if all U.S. 17-year-olds had took the SAT, not the college bound elite only.

The verbal and math standard deviations if ALL U.S. 17-year-olds had taken the old SAT

 Once I knew the mean SAT scores if ALL American teens had taken the SAT at 17 in each of the above years, I needed to know the standard deviations.   Although I knew the actual SDs for 1974, I don’t know them for other years, so for consistency, I decided to use estimated SDs.

According to the book The Bell Curve, since the 1960s, virtually every single American teen who would have scored 700+ on either section of the SAT, actually did take the SAT (and as Ron Hoeflin has argued, whatever shortfall there’d be would be roughly balanced by brilliant foreign test takers).  This makes sense because academic ability is correlated with taking the SAT, so the higher the academic ability, the higher the odds of taking the SAT, until at some point, the odds likely approach 100%.

Thus if 1% of all American 17-year-olds both took the SAT and scored 700+ on one of the subscales, then we know that even if 100% of all U.S. 17-year-olds had taken the SAT, still only 1% would have scored 700+ on that sub-scale.  By using this logic, it was possible to construct a graph showing what percentage of ALL U.S. 17-year-olds were capable of scoring 700+ on each sub-scale, each year:
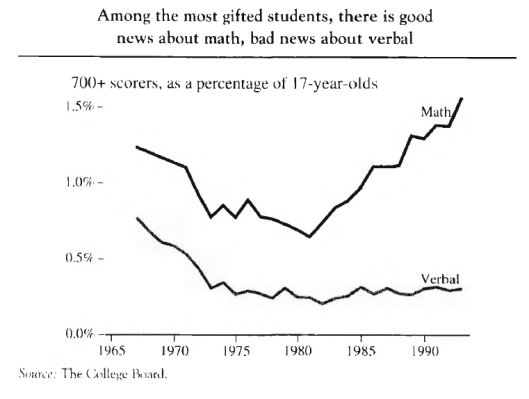
sevenhundred

Chart II: taken from page 429 of The Bell Curve (1994) by Richard J. Herrnstein and Charles Murray

What the above graph seems to show is that in 1966, a verbal score of 700+ put you in about the top 0.75% of all U.S. 17-year-olds, in 1974 it put you around the top 0.28%, in 1983 about the top 0.28% and in 1994 about the top 0.31%.

Similarly, scoring 700+ on math put you around the top 1.25% in 1966, the top 0.82% in 1974, the top 0.94% in 1983, and the top 1.52% in 1994.

Using the above percentages for each year, I determined how many SDs above the U.S. verbal or math SAT mean (for ALL 17-year-olds) a 700 score would be on a normal curve, and then divided the difference between 700 and each year’s mean (Chart I) by that number of SDs, to obtain the estimated SD. Because Chart I did not have a mean national score for 1994, I assumed the same means as 1983 for both verbal and math.  This gave the following stats:
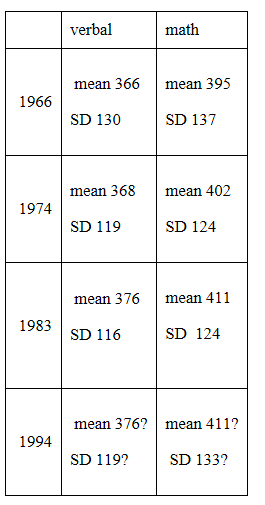
sds

Chart III: Estimated means and SD for the pre-re-centered SAT by year, if all U.S. 17-year-olds had taken the SAT, not just the college bound elite

Calculating verbal and math IQ equivalents from the old SAT

Armed with the stats in chart III, it’s very easy for people who took the pre-recentered SAT to convert their subscale scores into IQ equivalents.  Simply locate the means and SDs from the year closest to when you took the PRE-RECENTERED SAT, and apply the following formulas:

Formula I

Verbal IQ equivalent (U.S. norms)  = (verbal SAT – mean verbal SAT/verbal SD)(15) + 100

Formula II

Math IQ equivalent (U.S. norms) =  (math SAT – mean math SAT/math SD)(15) + 100


Calculating the mean and SD of the COMBINED SAT if all U.S. 17-year-olds had taken the test

Now how do we convert combined pre-recentered SATs (verbal + math) into IQ equivalents.  Well it’s easy enough to estimate the theoretical mean pre-recentered SAT for each year by adding the verbal mean to the math mean.  But estimating the standard deviation for each year is trickier because we don’t know the frequency for very high combined scores for each year, like we do for sub-scale scores (see Chart II).  However we do know it for the mid 1980s. Ron Hoeflin claimed that out of a bit over 5,000,000 high-school seniors who took the SAT from 1984 through 1988, only 1,282 had combined scores of 1540+.

Hoeflin has argued that even though only a third of U.S. teens took the SAT,  virtually 100% of teens capable of scoring extremely high on the SAT did so, and whatever shortfall there might be was negated by bright foreign test-takers.

Thus, a score of 1540+ is not merely the 1,282 best among 5 million SAT takers, but the best among ALL fifteen million Americans who were 17 years-old anytime from 1984 through 1988.  In other words, 1540 was a one in 11,700 score, which on the normal curve, is +3.8 SD.  We know from adding the mean verbal and math for 1983 in Chart I, that if all American 17-year-olds had taken the SAT in 1983, the mean COMBINED score would have been 787, and if 1540 is +3.8 SD if all 17-year-olds had taken it, then the SD would have been:

(1540 – 787)/3.8 = 198

But how do we determine the SD for the combined old SAT for other years?  Well since we know the estimated means and SD of the subscales, then Formula III is useful for calculating the composite SD (from page 779 of the book The Bell Curve by Herrnstein and Murray):

formula

Formula III

r is the correlation between the two tests that make up the composite and σ is the standard deviation of the two tests.

However Formula III requires you to know the correlation between the two subscales.  Herrnstein and Murray claim that for the entire SAT population, the correlation between SAT verbal and SAT math is 0.67 however we’re interested in the correlation if ALL American young adults had taken the old SAT, not just the SAT population.

However since we just estimated that the SD of the combined SAT if all 17-year-olds took the SAT in 1983 would have been 198, and since we know from Chart III that the 1983 verbal and math SDs if all 17-year-olds had taken the SAT would have been 116 and 124 respectively, then we can deduce what value of r would cause Formula III to equal the known combined SD of 198.  Shockingly, that value is only 0.36!

Now that we know the correlation between the verbal and math SAT if all U.S. 17-year-olds had taken the SAT would have been only 0.36 in 1983, and if we assume that correlation held from the 1960s to the 1990s, using the sub-scale SDs in chart III, we can apply Formula III to determine the combined SDs for each year, and of course the combined mean for each year is just  the sum of the verbal and math means in chart III.
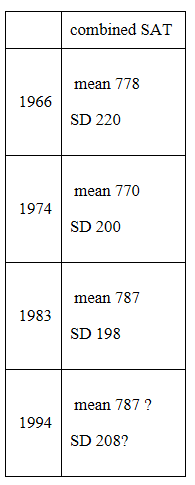
revised

Chart IV: Estimated means and SDs of the combined pre-recentered SAT if all U.S. 17-year-olds had taken the test


Calculating full-scale IQ equivalents from the old SAT

Armed with the stats in Chart IV, it’s very easy for people who took the pre-recenetered SAT to convert their COMBINED scores into IQ equivalents.  Simply locate the means and SDs from the year closest to when you took the PRE-RECENTERED SAT, and apply the following formula:

Formula IV

Full-scale IQ equivalent (U.S. norms)  = (combined SAT – mean combined SAT/combined SD)(15) + 100

*Note: the IQ equivalent of SAT scores above 1550 or so will be underestimated by this formula because of ceiling bumping.

Was Mensa wrong?

Based on chart IV, it seems Mensa is too conservative when it insists on SAT scores of 1300 prior to 9/30/1974 and scores of 1250 for those who took it from 9/30/1974 to 1/31/1994.  Instead it seems that the Mensa level (top 2% or + 2 SD above the U.S. mean) is likely achieved by scores of 1218 for those who took the SAT close to 1966, and only 1170 for those who took it closer to 1974.  For those who took the pre-recentered SAT closer to 1983 or 1994, it seems Mensa level was achieved by scores of 1183 and 1203 respectively.

Of course all of my numbers assume a normal distribution which is never perfectly the case, and it’s also possible that the 0.36 correlation between verbal and math I found if all 17-year-olds took the SAT in 1983 could not be generalized to other years, so perhaps I’m wrong and Mensa is right.  But it would be nice to know how they arrived at their numbers.

Share this:

  • Share on X (Opens in new window) X
  • Share on Facebook (Opens in new window) Facebook
Like Loading...
← Older posts
Newer posts →

contact pumpkinperson at easiestquestion@hotmail.ca

  1. pumpkinperson's avatar
    pumpkinperson on Brain the size of a basketball?July 27, 2026

    What does it mean to “adapt”? To take whatever situation you're in and turn it around to your advantage. To…

  2. James Peach's avatar
    James Peach on Brain the size of a basketball?July 27, 2026

    Just read this book on inflammation and depression. The underlying cause of depression is stress damage to the brain. No…

  3. James Peach's avatar
    James Peach on Brain the size of a basketball?July 26, 2026

    What does it mean to "adapt"? Is Elon Musk the smartest man because he has the most money or does…

  4. pumpkinperson's avatar
    pumpkinperson on Brain the size of a basketball?July 26, 2026

    Depends what you mean by that

  5. pumpkinperson's avatar
    pumpkinperson on Brain the size of a basketball?July 26, 2026

    Some dogs can read or have become self aware that they need antidepressants when they realize they exist. (The dog…

Recent Comments

pumpkinperson's avatarpumpkinperson on Brain the size of a baske…
James Peach's avatarJames Peach on Brain the size of a baske…
pumpkinperson's avatarpumpkinperson on Brain the size of a baske…
God's Word's avatarGod's Word on Brain the size of a baske…
James Peach's avatarJames Peach on Brain the size of a baske…
pumpkinperson's avatarpumpkinperson on Brain the size of a baske…
James Peach's avatarJames Peach on Brain the size of a baske…

Archives

  • June 2026
  • May 2026
  • January 2026
  • December 2025
  • November 2025
  • October 2025
  • September 2025
  • August 2025
  • July 2025
  • June 2025
  • May 2025
  • April 2025
  • March 2025
  • February 2025
  • January 2025
  • December 2024
  • November 2024
  • October 2024
  • September 2024
  • August 2024
  • July 2024
  • June 2024
  • May 2024
  • April 2024
  • March 2024
  • February 2024
  • January 2024
  • December 2023
  • November 2023
  • October 2023
  • September 2023
  • August 2023
  • July 2023
  • June 2023
  • May 2023
  • April 2023
  • March 2023
  • February 2023
  • January 2023
  • December 2022
  • November 2022
  • October 2022
  • September 2022
  • August 2022
  • July 2022
  • June 2022
  • May 2022
  • April 2022
  • March 2022
  • February 2022
  • January 2022
  • December 2021
  • November 2021
  • October 2021
  • September 2021
  • August 2021
  • July 2021
  • June 2021
  • May 2021
  • April 2021
  • March 2021
  • February 2021
  • January 2021
  • December 2020
  • November 2020
  • October 2020
  • September 2020
  • August 2020
  • July 2020
  • May 2020
  • April 2020
  • March 2020
  • February 2020
  • January 2020
  • December 2019
  • November 2019
  • October 2019
  • September 2019
  • August 2019
  • July 2019
  • June 2019
  • May 2019
  • April 2019
  • March 2019
  • February 2019
  • January 2019
  • December 2018
  • November 2018
  • October 2018
  • September 2018
  • August 2018
  • July 2018
  • June 2018
  • May 2018
  • April 2018
  • March 2018
  • February 2018
  • January 2018
  • December 2017
  • November 2017
  • October 2017
  • September 2017
  • August 2017
  • July 2017
  • June 2017
  • May 2017
  • April 2017
  • March 2017
  • February 2017
  • January 2017
  • December 2016
  • November 2016
  • October 2016
  • September 2016
  • August 2016
  • June 2016
  • February 2016
  • January 2016
  • November 2015
  • May 2015
  • January 2015
  • December 2014
  • November 2014
  • October 2014

Categories

  • ethnicity
  • heritability
  • income
  • Oprah
  • Uncategorized

Meta

  • Create account
  • Log in
  • Entries feed
  • Comments feed
  • WordPress.com
  1. pumpkinperson's avatar
    pumpkinperson on Brain the size of a basketball?July 27, 2026

    What does it mean to “adapt”? To take whatever situation you're in and turn it around to your advantage. To…

  2. James Peach's avatar
    James Peach on Brain the size of a basketball?July 27, 2026

    Just read this book on inflammation and depression. The underlying cause of depression is stress damage to the brain. No…

  3. James Peach's avatar
    James Peach on Brain the size of a basketball?July 26, 2026

    What does it mean to "adapt"? Is Elon Musk the smartest man because he has the most money or does…

  4. pumpkinperson's avatar
    pumpkinperson on Brain the size of a basketball?July 26, 2026

    Depends what you mean by that

  5. pumpkinperson's avatar
    pumpkinperson on Brain the size of a basketball?July 26, 2026

    Some dogs can read or have become self aware that they need antidepressants when they realize they exist. (The dog…

Blog at WordPress.com.

Privacy & Cookies: This site uses cookies. By continuing to use this website, you agree to their use.
To find out more, including how to control cookies, see here: Cookie Policy
  • Subscribe Subscribed
    • Pumpkin Person
    • Join 668 other subscribers
    • Already have a WordPress.com account? Log in now.
    • Pumpkin Person
    • Subscribe Subscribed
    • Sign up
    • Log in
    • Report this content
    • View site in Reader
    • Manage subscriptions
    • Collapse this bar
Loading Comments...
%d