
Many high IQ societies accept specific scores from the pre-1995 SAT for admission, as if all SATs taken before the infamous recentering in April 1995 had the same meaning. And yet Mensa, which only accepts the smartest 2% of Americans on a given “intelligence test” makes a curious distinction. Prior to 9/30/1974, you needed an SAT score of 1300 to get into Mensa, yet from 9/30/1974 to 1/31/1994, you needed a score of 1250.
Well, that’s odd I thought, since all SAT scores from the early 1940s to 1994 are supposedly scaled to reflect the same level of skill, why did it suddenly become 50 SAT points easier to be in the top 2% in 1974? And if such an abrupt change can occur in 1974, why assume stability every year before and since? It didn’t make any sense.
And I wasn’t the only one who was wondering. Rodrigo de la Jara, owner of iqcomparisonsite.com, writes:
If someone knows why they have 1300 for scores before 1974, please send an email to enlighten me.
The mean verbal and math SAT scores, if ALL U.S. 17-year-olds had taken the old SAT
To determine how the old SAT maps to IQ I realized I couldn’t rely on high IQ society cut-offs. I need to look at the primary data. Now the first place to look was at a series of secret studies the college board did in the 1960s, 1970s, and 1980s. These studies gave an abbreviated version of the SAT to a nationally representative sample of high school juniors. Because very few Americans drop out of high school before their junior year, a sample of juniors cam close to representing ALL American teens, and then scores were statistically adjusted to show how virtually ALL American teens would average had they taken the SAT at 17. The results were as follows (note, these scores are a lot low than the actual mean SAT scores of people who take the SAT, because they also include all the American teens who usually don’t):
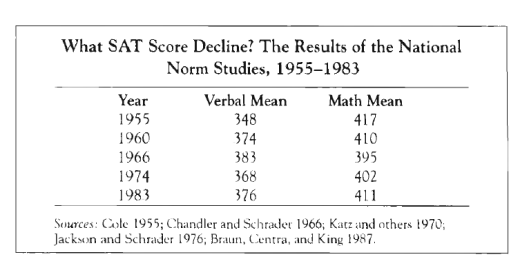
Chart I: taken from page 422 of The Bell Curve (1994) by Richard J. Herrnstein and Charles Murray: Estimated mean verbal and math SATs by year, if all U.S. 17-year-olds had took the SAT, not the college bound elite only.
The verbal and math standard deviations if ALL U.S. 17-year-olds had taken the old SAT
Once I knew the mean SAT scores if ALL American teens had taken the SAT at 17 in each of the above years, I needed to know the standard deviations. Although I knew the actual SDs for 1974, I don’t know them for other years, so for consistency, I decided to use estimated SDs.
According to the book The Bell Curve, since the 1960s, virtually every single American teen who would have scored 700+ on either section of the SAT, actually did take the SAT (and as Ron Hoeflin has argued, whatever shortfall there’d be would be roughly balanced by brilliant foreign test takers). This makes sense because academic ability is correlated with taking the SAT, so the higher the academic ability, the higher the odds of taking the SAT, until at some point, the odds likely approach 100%.
Thus if 1% of all American 17-year-olds both took the SAT and scored 700+ on one of the subscales, then we know that even if 100% of all U.S. 17-year-olds had taken the SAT, still only 1% would have scored 700+ on that sub-scale. By using this logic, it was possible to construct a graph showing what percentage of ALL U.S. 17-year-olds were capable of scoring 700+ on each sub-scale, each year:
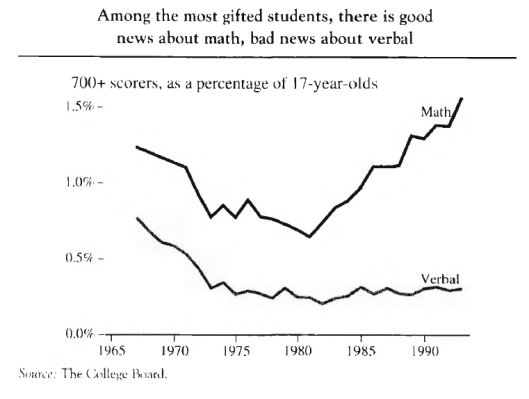
Chart II: taken from page 429 of The Bell Curve (1994) by Richard J. Herrnstein and Charles Murray
What the above graph seems to show is that in 1966, a verbal score of 700+ put you in about the top 0.75% of all U.S. 17-year-olds, in 1974 it put you around the top 0.28%, in 1983 about the top 0.28% and in 1994 about the top 0.31%.
Similarly, scoring 700+ on math put you around the top 1.25% in 1966, the top 0.82% in 1974, the top 0.94% in 1983, and the top 1.52% in 1994.
Using the above percentages for each year, I determined how many SDs above the U.S. verbal or math SAT mean (for ALL 17-year-olds) a 700 score would be on a normal curve, and then divided the difference between 700 and each year’s mean (Chart I) by that number of SDs, to obtain the estimated SD. Because Chart I did not have a mean national score for 1994, I assumed the same means as 1983 for both verbal and math. This gave the following stats:
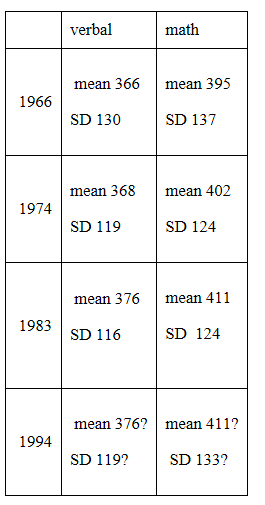
Chart III: Estimated means and SD for the pre-re-centered SAT by year, if all U.S. 17-year-olds had taken the SAT, not just the college bound elite
Calculating verbal and math IQ equivalents from the old SAT
Armed with the stats in chart III, it’s very easy for people who took the pre-recentered SAT to convert their subscale scores into IQ equivalents. Simply locate the means and SDs from the year closest to when you took the PRE-RECENTERED SAT, and apply the following formulas:
Formula I
Verbal IQ equivalent (U.S. norms) = (verbal SAT – mean verbal SAT/verbal SD)(15) + 100
Formula II
Math IQ equivalent (U.S. norms) = (math SAT – mean math SAT/math SD)(15) + 100
Calculating the mean and SD of the COMBINED SAT if all U.S. 17-year-olds had taken the test
Now how do we convert combined pre-recentered SATs (verbal + math) into IQ equivalents. Well it’s easy enough to estimate the theoretical mean pre-recentered SAT for each year by adding the verbal mean to the math mean. But estimating the standard deviation for each year is trickier because we don’t know the frequency for very high combined scores for each year, like we do for sub-scale scores (see Chart II). However we do know it for the mid 1980s. Ron Hoeflin claimed that out of a bit over 5,000,000 high-school seniors who took the SAT from 1984 through 1988, only 1,282 had combined scores of 1540+.
Hoeflin has argued that even though only a third of U.S. teens took the SAT, virtually 100% of teens capable of scoring extremely high on the SAT did so, and whatever shortfall there might be was negated by bright foreign test-takers.
Thus, a score of 1540+ is not merely the 1,282 best among 5 million SAT takers, but the best among ALL fifteen million Americans who were 17 years-old anytime from 1984 through 1988. In other words, 1540 was a one in 11,700 score, which on the normal curve, is +3.8 SD. We know from adding the mean verbal and math for 1983 in Chart I, that if all American 17-year-olds had taken the SAT in 1983, the mean COMBINED score would have been 787, and if 1540 is +3.8 SD if all 17-year-olds had taken it, then the SD would have been:
(1540 – 787)/3.8 = 198
But how do we determine the SD for the combined old SAT for other years? Well since we know the estimated means and SD of the subscales, then Formula III is useful for calculating the composite SD (from page 779 of the book The Bell Curve by Herrnstein and Murray):

Formula III
r is the correlation between the two tests that make up the composite and σ is the standard deviation of the two tests.
However Formula III requires you to know the correlation between the two subscales. Herrnstein and Murray claim that for the entire SAT population, the correlation between SAT verbal and SAT math is 0.67 however we’re interested in the correlation if ALL American young adults had taken the old SAT, not just the SAT population.
However since we just estimated that the SD of the combined SAT if all 17-year-olds took the SAT in 1983 would have been 198, and since we know from Chart III that the 1983 verbal and math SDs if all 17-year-olds had taken the SAT would have been 116 and 124 respectively, then we can deduce what value of r would cause Formula III to equal the known combined SD of 198. Shockingly, that value is only 0.36!
Now that we know the correlation between the verbal and math SAT if all U.S. 17-year-olds had taken the SAT would have been only 0.36 in 1983, and if we assume that correlation held from the 1960s to the 1990s, using the sub-scale SDs in chart III, we can apply Formula III to determine the combined SDs for each year, and of course the combined mean for each year is just the sum of the verbal and math means in chart III.
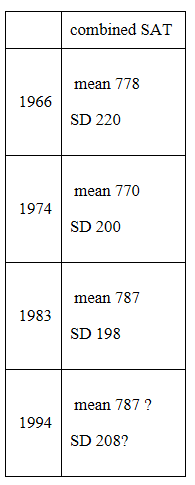
Chart IV: Estimated means and SDs of the combined pre-recentered SAT if all U.S. 17-year-olds had taken the test
Calculating full-scale IQ equivalents from the old SAT
Armed with the stats in Chart IV, it’s very easy for people who took the pre-recenetered SAT to convert their COMBINED scores into IQ equivalents. Simply locate the means and SDs from the year closest to when you took the PRE-RECENTERED SAT, and apply the following formula:
Formula IV
Full-scale IQ equivalent (U.S. norms) = (combined SAT – mean combined SAT/combined SD)(15) + 100
*Note: the IQ equivalent of SAT scores above 1550 or so will be underestimated by this formula because of ceiling bumping.
Was Mensa wrong?
Based on chart IV, it seems Mensa is too conservative when it insists on SAT scores of 1300 prior to 9/30/1974 and scores of 1250 for those who took it from 9/30/1974 to 1/31/1994. Instead it seems that the Mensa level (top 2% or + 2 SD above the U.S. mean) is likely achieved by scores of 1218 for those who took the SAT close to 1966, and only 1170 for those who took it closer to 1974. For those who took the pre-recentered SAT closer to 1983 or 1994, it seems Mensa level was achieved by scores of 1183 and 1203 respectively.
Of course all of my numbers assume a normal distribution which is never perfectly the case, and it’s also possible that the 0.36 correlation between verbal and math I found if all 17-year-olds took the SAT in 1983 could not be generalized to other years, so perhaps I’m wrong and Mensa is right. But it would be nice to know how they arrived at their numbers.

PP: Pre-1995, every racial group in NYC, besides blacks were quite violent, with the only exception of Ashkenazis, if you view Jews as being a distinctive group. East Asians were also contentious, although most of their crime was confined within their own neighborhoods, but Jews were always Jews.
SHUT UP Racist
Disagree with your chosen math and assumptions. You probably could not understand the original studies. They are not transparent, agreed. Just accept you did not make mensa lol. 98%ile is not very high, nor useful, dont worry.
The fact is, we went from the Age of Intelligence (arms race, space race), to the Age of Technology (silicon chips, AI), and lately in my opinion, to a new age. Tiktok girls shake their rear ends. Bland housewives screw their spouse on camera. Homely young males make NFTs of their faces, or if very ambitious, draw funny doodles of some kind. All these people make millions upon millions in mere months.
Its a new age, the Age of Idiocy.
philosopher was right!
the numbers don’t lie. white gentiles are the most discriminated against group in the US. they’re sasquatches.

Not sure how that proves anything. It’s not as though before affirmative action, the children of rich blacks scored higher than the children of rich whites.
Kevin MacDonald explained discrimination on whites too:
http://www.theoccidentalobserver.net/2010/07/kevin-macdonald-jewish-overrepresentation-at-elite-universities-explained/
if discrimination is defined as income lower than the mean for those with the same IQ…
controlled for IQ whites earn the least…
that’s discrimination.
The Bell Curve (1994) found controlling for IQ, blacks and whites had the same wages but blacks were more likely to be in poverty, unemployed & in jail however they were much more likely to have a high status occupation
murray proved wrong again!
whatever the occupation, the average IQ of whites or e asians will be higher than that of nams.
according to flushton white enlisted men score lower than black officers, but i bet they score higher than black enlisteds. and i bet white officers of the same rank score higher than blacks.
lawyers, doctors, MBAs, garbage men, career criminals…i bet the whites always have a higher average.
White people deserve sympathy even if they lynch black people and kill “injuns”. White people have no privilege. In fact, white people get the very short end of the stick in America (and the world?).
Yes you’re totally right Mugabe!
Poor-Anglo Whites are the poorest of Whites. 1st nations are poor because they are Amerindian non-white, but American White trash are poor because of what they are.
Québécois are regarded the poorest of Canadians, who are often a subject of ridicule and stigmatization — yet the average French Canadian has a higher household income than their neighboring Snow White, home state of Bernie Sanders the Jew:
Average Household Income for Québec is $56K/yr before taxes in U$
Average Household Income for Vermont is $52K/yr before taxes in U$
And Mugaboo understands that I like to emphasize strong civic culturalists as being superior over money strivers — this is the case, when it comes to New France over New York.
Also, Britain’s colonial complex of Australians, Americans and Anglo Prole Canadians — in the order of the most severe of nonintellectuals to lesser severe of non-intellectuals. Aussies don’t care for cultural or book learning at all, where as Anglophone Canadians show a weedy bit of it.
i know. i am right.
the effect of affirmative action is discrimination against white gentiles, not making up for discrimination against non-whites.
controlled for IQ whites earn the least.
the least.
Lmao you still think Im peepee. Hilarious.
I agree about privilege.
Species privilege.
Now tell me, does this trigger you Dildos?
Are there any flashbacks or palpitations in particular? Perhaps you may be repressing a memory of some sort. This is not uncommon.
According to Pumpkin Person’s extensive research as many as 34% of Native American females may have been the victim of sexual predation by Sasquatches in their lifetime.
sasquatch rape is epidemic on the rez much like on college campuses.
nabokov should’ve written a novel about it.
@ Philosturbator
I hope you know that joking about rape is not ok. Stop thinking with your dick, dude. Grow up.
said the rapist.
deal with it does it with a strap on.
Most White gentiles in America earn or have very little money simply because of the rapacious-parasite class who set the gold standard that you need to keep up with the joneses, which is essentially striving.. And this parasitic group they themselves are striving for more. Your theory holds true that no nation survives entirely with a striving class, whose instincts is what lead predators into feeding frenzy. Only with a ruling monarchy is where rationalism and equity are set in place.
Philosturbator is a white supremacist despite being of MENA extraction himself. I’m whiter than you retard. But I have a conscience and you dont
Mugabe,
White trash rape is much more common dude.
Mugabe
You’re not funny. All your jokes remind me of middle school.
they’re over your head.
this is what phil meant when he named you “deal with dildos”.
this is for you JS.
i for one can never forgive the quebecers for cirque du soleil.
the math SAT. http://4.bp.blogspot.com/-VGhBfMUBWfA/VBY8p56E1aI/AAAAAAAAAAM/RoEBWGaX4WA/s1600/testg0%7Bimage2%7D.gif
combined. https://qph.ec.quoracdn.net/main-qimg-36c2d516a64dac904dcb17c9296b9a9e?convert_to_webp=true
so the poorest whites are the most discriminated against. but above the poorest e asians are the most discriminated against in terms of combined SAT vs family income.
these charts show the same pattern as RR’s.
if the reason why poor whites score higher than rich blacks is that poor whites are a select population, then…
poor blacks should score higher than rich blacks too, unless…
at every income level blacks are less selected than poor whites…
not likely.
“these charts show the same pattern as RR’s.”
According to Philosturbator, Im an autistic for wearing this jacket.
Whatever!
#autistlivesmatter
No wait I’m bipolar! Is there such a thing as a bipolar jacket?
just immature.
i’m much better dressed.

You’re a dude, stop stealing that poor girl’s pictures.
an extremely weird dude.
RaceRealist is a good looking guy and you can tell he’s well adjusted and mature. He and Afrosapiens are very mature. Philosturbator and Mugabe are immature middle-aged men. I’m 23 but way more grown up than these guys.
i can tell.
According to an article in the New York Times, one in three Native American women has been a victim or rape or an attempted rape—a rate which is more than twice the national average. In places like remote villages in Alaska, the rape rate is as much as 12 times the national average.
http://jezebel.com/5912932/rape-on-indian-reservations-reaches-epidemic-proportions
I think this is among the most significant info for me. And i am glad reading your article. But wanna remark on few general things, The web site style is ideal, the articles is really excellent : D. Good job, cheers
The equations used in the article are incorrect. The do not apply correct precedence rules of algebra.
WRT “The Bell Curve”, the authors utilized empirical data to conclude that individuals most prone to common criminal activity in society were those who were most challenged by its complexities; id est persons with lower IQs. Coincidentally, this is also correlated by race. Data shows that Asians have the highest mean (but narrow variance), whites have almost as high with larger variance (hence more geniuses) and blacks have the lowest IQ and a very broad variance. American blacks have higher IQs than African blacks, likely owing to the mixture of white blood in the gene pool of the former.
Any conclusions to the contrary are political bias by the author.
Well, that’s interesting; according to Formula IV, I have an IQ of 142. Who knew! Why ain’t I rich?
Seriously: 142. Huh.