Emil Kirkegaard has an interesting blog post showing the polygenic education scores (MTAGeduPGS) of different U.S. ethnic groups. Whites 0.47, Native Americans -0.37 and U.S. blacks -1.37. If we set the white polygenic score to equal IQ 100 and the black one to equal IQ 85, then:
Genetic IQ = 8.15(MTAG eduPGS) + 96.17
Applying this formula to Native Americans gives a genetic IQ of 93.
But since both U.S. blacks and Native Americans are about 25% white, correcting for this suggests “pure” blacks and Native Americans would be 80 and 91 respectively.
From this we might infer that before modern humans left Africa 70,000 years ago, our average genetic IQ was no higher than 80, but by the time we reached the arctic 40,000 years ago, some races were averaging 91.
But it was only after the neolithic transition that triple digit IQ races began to appear. Indeed a recent study by Davide Piffer and Emil Kirkegaard looked at 2,625 European genomes and found that polygenic scores for education (a proxy for genetic IQ) gradually increased over the last 15,000 years.
Assuming Upper Paleolithic Europeans had IQs like Native Americans (both cold climate hunter-gatherers), this suggests genetic IQ in Europe has been increasing by 0.0006 points per year since near the end of the ice age, culminating in the Industrial Revolution a few hundred years ago.
Piffer and Kirkegaard believe the increase was caused by higher IQ farmers from the Middle East replacing the indigenous hunter-gatherers of Europe but Peter Frost argues they were not necessarily replaced by farmers, but may have evolved into them, writing:
There is thus an inevitable confound between hunter-gatherer ancestry and natural selection due to hunting and gathering. If we look at alleles that seem to indicate native hunter-gatherer ancestry, we are excluding alleles from hunter-gatherers who successfully adapted to farming and who thus acquired a genetic profile that converges, to some extent, on that of Anatolian farmers.
Commenter Vegan DHA asks, “Random, but what might be Tyler Perry‘s IQ? I guess something between 125 and 135.”
I’ve always liked Tyler Perry. I’ve never seen any of his movies but his Madea character looks hilarious so I think I would enjoy them. Perry’s childhood was a living hell; brutally beaten by his father and raped by men AND women (“so disgusting” he would later tell Oprah)
After a childhood of abuse, he entered high school but was kicked out, (though would later return for his GED) and was on track to become America’s worst nightmare: the big bad angry black man. Fortunately he turned on The Oprah Winfrey Show and was just blown away, to see someone who looked like him but had made it to the absolute top of America! He heard her say “if you write things down, it’s cathartic”. At the time he didn’t know what cathartic meant but he used his IQ to infer it was good and he began writing and never stopped. Still, making money as a playwright was no mean feat, and four years after being homeless (except for his car) he got to meet the woman who changed his life.
So what is his IQ?
We begin with the fact that as of 2023, Forbes estimated Perry had a net worth of $1 billion, making him the 4th or 5th richest black man of his generation. Given there are about 4.65 million black men in Generation X, that puts Perry around the one in a million level for this demographic. If there were a perfect correlation between IQ and money among black men, you’d expect Perry’s IQ to be 71 points above the U.S. black mean, but since the correlation is actually only 0.42 (somewhat lower than for white men), we’d expect him to be 71(0.42) above the black mean of 89 (U.S. norms);85 (white norms) giving Perry an expected IQ of 30 + 89 = 119 (U.S. norms).
However Perry is not just rich, he’s also tall. At a height of 196 cm, Perry is at least 3.06 standard deviations taller than the average black man of his generation. If there were a perfect correlation between IQ and height, we’d expect him to be 46 IQ points above the U.S. black mean, but since the correlation is only 0.25, his expected IQ is 46(0.25) + 89 = 101 (U.S. norms).
What happens when we put these two predictors together? Using math that a Promethean once explained to me, since the correlation between money and height is only 0.13, both variables maintain most of their predictive power:
Perry’s expected IQ = 0.37(Perry’s lifetime income ) + 0.22(Perry’s height)
Perry’s expected IQ = 0.37(+4.73 SD above the U.S. black male mean) + 0.22(+3.06 SD above the U.S. black male mean)
Perry’s expected IQ = 1.75 SD above the U.S. black male mean + 0.67 SD above the U.S. black male mean
Perry’s expected IQ = 2.42 SD above the U.S. black male mean
So 125 would be my first guess for Perry’s IQ, but given that income is only moderately correlated with IQ and height is weakly correlated with IQ, the standard error around this estimate is quite large so think of it as just an educated guess.
Correct me if I’m wrong, but this is kind of a very simplified version of how chat GPT and machine learning in general works, but instead of using statistical predictors to guess IQs, chat GPT uses it to predict what humans would say when asked different questions.
It seems people are scared to take the cubes test. You should be. Preliminary norms suggest the test is VERY VERY VERY hard. Of the readers who have taken the test so far, nine of you reported scores on either the SAT or the Wechsler. SAT scores (reading + math) were converted to IQ (U.S. norms) depending on the time period they were taken. If someone reported scores on both the SAT and the Wechsler, I took the average of both.
I found a 0.48 correlation between raw score on cubes (out of 17) and reported Wechsler/SAT score. After correcting for range restriction, the correlation increased to 0.58. By lining up the cube raw scores from highest to lowest beside the Wechsler/SAT scores from highest to lowest, I found the following rough equivalencies. Do not extrapolate beyond these norms as the relationship is anything but linear (as commenter Fraz predicted).
[You can take the cubes test here. Email optional. You can register with a fake name]
As I analyze the data from the general knowledge test, I thought I would post the cubes test. Tests of cube analysis date back to World War I and perhaps before. The subest was supposed to be part of the Wechsler intelligence scales but they decided to drop it. Wechsler (1958) wrote:
The Cube Analysis test was discarded after being given to over 1000 subjects because it showed large sex differences, proved difficult to get across to subjects of inferior intelligence and because it tapered off abruptly at the upper levels…Apparently others have had less discouraging results with the test; it was included in the Army GCT (World War II). We still think that the test has serious shortcomings.
I’m a bit surprised that Wechsler found the test hard to administer to low grade people as part of what attracted me to the test was its utter simplicity, however perhaps duller subjects don’t grasp what a cube is or have problems perceiving drawings of them.
Despite such warnings, I decided to include the cube test in my battery. For starters, excluding a test because of sex differences seems unscientific because it assumes a priori that the sexes have equal intelligence and there’s no reason to think that. Wechsler didn’t apply that procedure when it comes to race, so why apply it when it comes to sex. Perhaps because the Binet test found little or no sex differences and that was seem as the gold standard before the Wechsler was developed and perhaps because if he did apply that standard to race he’d have virtually no subtests left.
My second reason for including this in the PAIS is I wanted at least one test involving blocks since these hold nostalgic value from being tested as a child.
(To take the General Knowledge test click here (you can use a fake name for registration; email optional))
Tests of Information are perhaps the most familiar and mainstream of all types of cognitive tests. They are to be found in popular board games like Trivial Pursuit, hit TV game shows like Jeopardy and Who wants to be a millionaire? and trivia nights at your local bar. The test had long been used by psychiatrists as a quick and dirty measure of intelligence but psychologists eschewed it until WWI when it was included in the Army Alpha Group IQ test. To the shock of many, it proved to be one of the best in the battery, correlating better with the overall score than much more respected tests like Arithmetic, Analogies and Disarranged Sentences (Wechsler, 1958). It also showed a much better bell curve with fewer zero scores and fewer people piling up at the maximum score (Wechsler 1958).
Although the test is easily criticized as culturally biased and a measure of education not intelligence, Wechsler’s experience showed such criticisms to be unfounded, particularly if the specific items were chosen skillfully. Wechsler defined a good item as one that the average person, with average opportunity has a chance to learn for himself. So a question like “how heavy is the average American newborn baby?” would be much better than “what state produces the most gold?”. “How far is it from Toronto to Tokyo?” much better than “how far is it from the Earth to the sun?”
“The fact is,” wrote Wechsler “all objections considered, the range of a man’s knowledge is generally a very good indication of his intellectual capacity.”
In addition to this, such tests are fun to take and easy to devise, administer and score. Given all these merits, I decided to include an Information subtest in the PAIS. The PAIS Information subtest consists of 28 items ranging from extremely easy (snake) to profoundly difficult (Native American carved in wood). In a preliminary norming sample of 16 native born English speaking Canadians found at my local pool hall, the mean score was 12 with an SD of 3.4. Scores ranged from 4 (a suspected retardate) to 18 (university alum) corresponding to IQs of 65 to 126 (Canadian norms) or 69 to 128 (U.S. norms).
A preliminary estimate for how this test maps to IQ is as follows:
IQ (U.S. norms) = (Information raw score)(4.29) + 52
IQ (Canadian norms/U.S. white norms) = (information raw score)(4.43) + 47
Information item
Percent of the general Canadian population passing
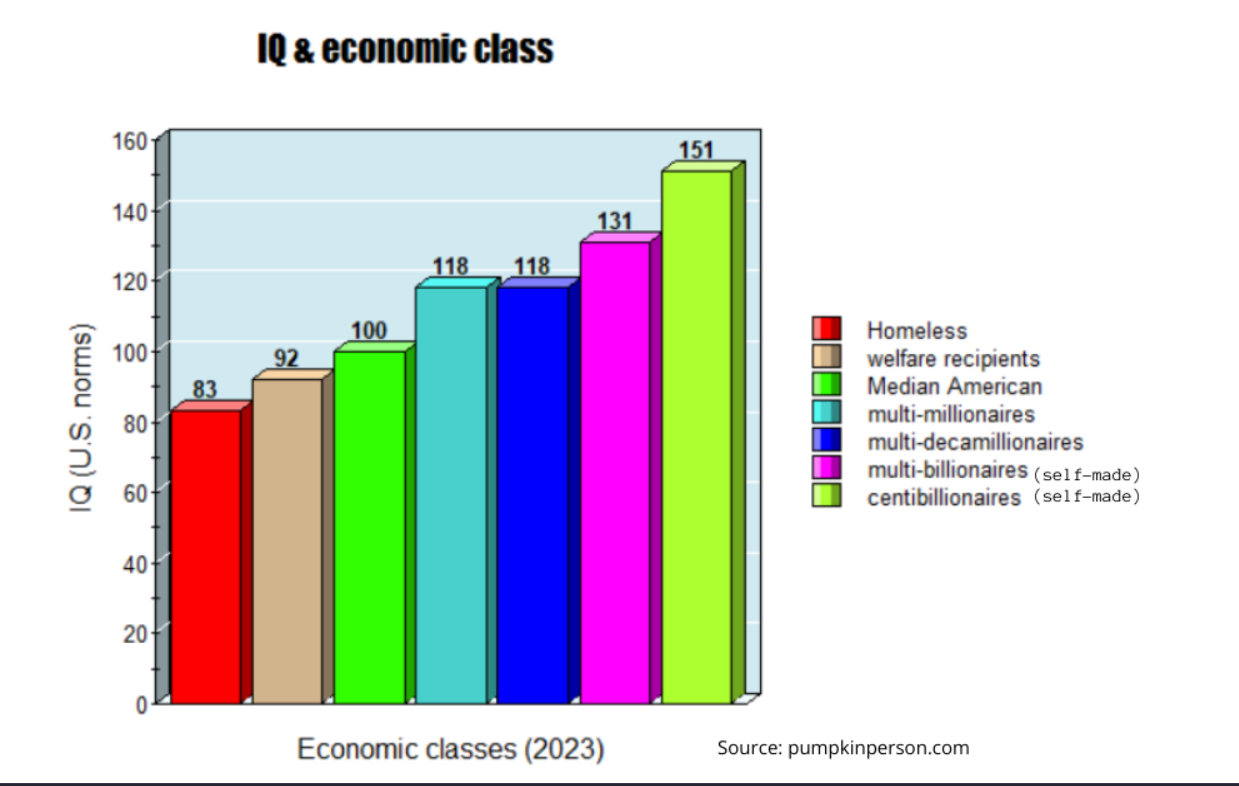
In this article I summarize all I have learned to date about seven economic classes in the United States: The poorest 0.27%, the poorest 10.5%, the median American, the richest 4% , the richest 0.27%, the richest self-made one in a million, and the richest self-made person in America (at any given time). The exact dollar value associated with these groups changes over time, especially at the high end, but in recent years, they can be roughly and respectively thought of as the homeless, welfare recipients, median Americans, multi-millionaires, multi-decamillionaires, self-made multi-billionaires, and self-made centibillionaires. These seven groups appear to have have mean IQs of 83, 92, 100, 118, 118, 131 and 151 respectively. By examining the slope of the regression line predicting the cognitive Z score of each class as a function of their normalized economic Z score, I find that the true correlation between IQ and income should approach 0.5, suggesting roughly half the differences in self-made money are associated with IQ.
The poorest 0.27% (the homeless); Average IQ 83
Sample: In 2010, there were 637,077 homeless Americans, out of about 235 million U.S. adults (0.27%). By 2020, there were 580,466 homeless Americans out of about 258 million U.S. adults (0.22%) so the poorest 0.27% can still be roughly thought of as the homeless.
Cognitive ability: A 2004 study found that 90 homeless men living in a large shelter in Milwaukee, Wisconsin, had a mean WASI full-scale IQ of 83.92 (standard deviation = 15.24). The WASI was published in 1999, and this study was published in 2004, so we should subtract 1.5 points for old norms which are thought to expire by as much as 0.3 points a year (the Flynn effect), so the homeless likely have a mean IQ of 82.5 (U.S. norms). One problem with this study is that 81% of the sample was black (much higher than the 45% among homeless Americans in general) and these tend to score lower on IQ tests, at least in the general U.S. population, however a UK sample of homeless obtained virtually identical scores on the WASI, despite being 96% white. In the UK study, the WASI full-scale IQ distribution of the homeless has a mean of 84.3. In this study, published in 2011, the WASI norms were by now even more outdated, so we should probably subtract as much 3.6 points for old norms, so this homeless sample had a mean IQ ariund 80.7 (U.S. norms) . Given the IQ of 80.7 (U.S. norms) among the the virtually all-white U.K. homeless sample, the IQ of 82.5 among the mostly blacks American sample is unlikely to be deflated by race, thus 83 is considered the best estimate of the American homeless.
The poorest 10.5% (welfare recipients); Average IQ 92
Cognitive ability: It’s common knowledge in psychometric circles that reading comprehension tests are statistically equivalent to IQ tests, and a literacy study found that about 2/3 to 3/4 of adult welfare recipients (about 71%) have what’s classified as Level 1 or Level 2 literacy. By contrast, 1/2 of the general adult U.S. population are at these levels. Since by definition, 1/2 of Americans have IQs below 100, it can be deduced that 71% of welfare recipients have IQs below 100. In a normal distribution, the 71 percentile is 8 IQ points (0.53 sigma) above the mean, so if IQ 100 is the 71 percentile among welfare recipients, the average welfare recipient should have an IQ 8 points less. In other words, American welfare recipients average IQ 92 (U.S. norms). Some might object that my analysis falsely assumes welfare recipients have the same IQ variance as the general U.S. population, but the above cited studies of the homeless suggest that poor Americans do indeed have a similar variance to Americans on the whole.
The median American; Average IQ 100
By definition, the median American is at the 50th percentile financially.
By definition, the median American is at the 50th percentile in IQ which equates to IQ 100 (U.S. norms).
The richest 4% (multi-millionaires in 2023); Average IQ 118
Sample: According to the 2000 book The Millionaire Mind by Thomas J. Stanley, which reported on a national survey of 733 millionaires (defined here by household, not individual net-worth), which at the time the book was written, were 4% of U.S. households. The top 4% were largely self-made, with only 8% inheriting more than half their wealth.
Of course a $1 million is no longer enough to rank in the top 4%; one now needs $4.7 million, thus the top 4% should now be thought of as all multi-millionaires, at least with respect to household net wealth.
Cognitive ability: The average self-reported SAT score of the richest 4% in Stanley survey was 1190. Since Stanley noted that the typical member of this class was 54 circa 1998 (when the book was being written), he likely took the SAT in 1961 (when he was 17) which at the time equated to an IQ of 126 according to my research. But Stanley suspected a self-reporting bias was inflating the numbers since “A students” were more likely to recall their score than “C students”.
If we conservatively assume that the 39% of the sample who did not report scores either did not do as well or could not have done as well so didn’t take the test, then an IQ of 126 no longer reflects the average of the richest 4%, but instead just the average of the top 61% of this class, which in a normal curve, would be the 70th percentile.
Assuming normal distribution and assuming the richest 4% have the same IQ variance as Americans as a whole just like the homeless did, the 70th percentile is 8 IQ points above the mean, so we should expect the average IQ of all the richest 4% to be 118 (U.S. norms).
The richest 0.27% (multi-decamillionaires in 2023); Average IQ 118
Sample: Although one “only” needed a household net-wealth of at least $1 million USD to make Stanley’s sample, some in his sample were decamillionaires (net-wealth of at least $10 million) which at the time the book was written, were 0.27% of U.S. households (can be inferred from the data in this article).
By 2023 one needed multi-decamillionaire status to make the top 0.27%.
Cognitive ability: Above I noted that the richest 4% had a mean SAT score equating to IQ 118 (U.S. norms). Because Stanley found virtually no correlation between net-worth and SAT among his sample, it might be assumed that the richest people in his sample also averaged IQ 118 (U.S. norms). Of course if the data was not normalized, the zero correlation might be misleading.
The richest self-made one in a million (multi-billionaires in 2023); average IQ 131
Sample: In the Forbes 1993 ranking of the 400 richest Americans, 49.5% inherited their wealth (see table 1 of this study) which means the remaining 50.5% were the 202 richest self-made Americans out of about 158 million Americans aged 25+ in the early 1990s (0.0001%, ) or roughly the richest self-made one in a million. In the early 1990s it took just over $300 million USD to rank among the richest self-made one in a million but by 2023 it would take over $3 billion, so being one in a million now requires multi-billionaire status.
Cognitive ability: In 1997 Daniel Seligman discussed the IQ of the Forbes 400:
“It seems marvelously symbolic that William H. Gates III, the guy listed as number one on The Four Hundred, has an obviously breathtaking IQ. The figure 170 keeps getting into print, which would make him almost certainly the highest on this list or any other list you’re likely to be looking at soon. To be sure, one occasionally sees conjectures that Steven Ballmer, Microsoft’s executive vice president, worldwide sales and support, is in the same IQ league as Bill himself. Ballmer is number six among The Four Hundred.”
The 170 seems to be an estimate from his childhood school teacher, however it’s nonetheless corroborated by a claim that he scored 1590 on the pre-1995 SAT which Gates himself seemed to confirm to David Rubenstein during a Q & A at the launch of the Harvard campaign on Sept 21, 2013. Fellow Microsoft leaders Steven Balmer and Paul Allen each scored a perfect 1600 on the SAT according to the Harvard Crimson and the New York Times respectively though neither publication provided a source. At the very least we can assume at least one of these three men scored 1590+ which equated to an IQ of 170+ on the pre-1995 SAT (see chart at the bottom of this article).
At the other extreme, Bill Cosby, who with a then net worth of $340 million, made the botttom of the Forbes 400 in the early 1990s, told David Letterman he had a combined SAT score of 500. Very little is known about how the SAT mapped to IQ in the 1950s when Cosby would have taken the test, but data from 1966 suggests an IQ equivalent of 84. However prior to the 1980s, African American teenagers underperformed their IQs on scholastic tests by 8 points, so adjusting for this, his IQ equivalent becomes 92. In Cosby’s case this is likely a colossal underestimate, however for every person who is underestimated by the SAT, there’s someone else who was overestimated, so the SAT distribution should mirror the IQ distribution, even if it’s sometimes quite wrong in individual cases.
If we assume that in the early 1990s, the IQs of the self-made members of the 400 richest Americans ranged from 92 (Cosby) to 170 (Gates, Ballmer &/or Allen), then the mid-point of the range is 131 which is a reasonable estimate for the richest 0.0001% (self-made).
The richest self-made person in America at any given time (centibillionaires in 2023); average IQ 151
Sample: Ever since Forbes began annually publishing the names of the “400 richest Americans” in 1982, only eight people have ever topped the list: shipping magnate Daniel Ludwig (1982), oil tycoon Gordon Getty (1983-1984), Walmart founder Sam Walton (1985-1988), media mogul John Kluge (1989-1991), Microsoft cofounder Bill Gates (1992, 1994-2017), investor Warren Buffett (1993), Amazon founder Jeff Bezos (2018-2021), and Tesla and SpaceX CEO Elon Musk (2022-2023). Of these, only five are alive today, and of those only four are self-made (Gates, Buffet, Bezos and Musk) out of 143 million Americans from generation X or older (anyone younger has not had enough time to amass such wealth). Thus becoming the richest self-made American is about a one in 36 million level achievement.
Cognitive ability: For the first time ever, we just happen to have publicly known IQ data on every single living self-made person who was ever ranked as the richest American. As mentioned above, Bill Gates reportedly scored 1590 on the pre-1995 SAT, equating to an IQ of 170 (see chart at bottom of this article).
Jeff Bezos told The Washington Post he scored 1450, which equated to an IQ of 146. According to biographer Walter Isaacson, Elon Musk scored 1400 on the pre-recentered SAT, equating to an IQ of 142.
According to his sister Doris, a woman administered an IQ test to Buffet at age 10 and he scored a couple points above 150. However back in 1940, most IQs were still calculated using the age ratio method meaning a 10-year-old who performed as well as the average 15.2-year-old, was developing at 152% his chronological age and thus assigned an IQ of 152. Although this method (normed entirely on whites) formed a Gaussian curve from IQ 50 to 150, the mean and SD were 101.8 and 16.4 respectively, a little higher than on most modern scales where the mean is set at 100 and the SD at 15. Converting to the modern scales gives Buffet an IQ of 146 (U.S. white norms; also 146 on U.S. norms).
Amazingly, all four living members of the “richest self-made person” in America club have IQs of at least 142 (99.7th percentile) and the mean is a spectacular 151 (99.97th percentile)! To quote the late Daniel Seligman “people who are the top in American life, are probably there because they’re more intelligent than the rest of us.”
Summary of data
Economic class
Median economic level (derived by cutting the percentage in each class in half)
Median economic Z score
Median IQ (U.S. norms)
Median cognitive level
Median cognitive Z score
Poorest 0.27% (homeless)
Poorest 0.14% of America
-3
83
Dullest 13% of America
-1.13
Poorest 10.5% (welfare recipients)
Poorest 5.25%
-1.6
92
Dullest 30%
-0.53
Median American
Median income
0
100
Median intelligence
0
Richest 4% (multi-millionaires in 2023)
Richest 1% (self-made)
+2.07
118
Brightest 11%
+1.53
Richest 0.27%(multi-decamillionaires in 2023)
Richest 0.14% (self-made)
+3
118
Brightest 11%
+1.53
Richest self-made one in a million (multi-billionaires in 2023)
Richest self-made one in 2 million
+4.93
131
Brightest 1.9%
+2.07
Richest self-made person in America at any given time (centibillionaires in 2023)
Richest self-made one in 72 million level (self-made)
+5.53
151
Brightest 0.03%
+3.4
To make them easier to compare, I have converted both the median economic level and and median IQ of each economic class into normalized Z scores. This was accomplished by equating the percentile rank of both variables with the number of standard deviations from the mean they’d be if both variables fit a perfectly normal curve.
Discussion


As the above graph shows, when both variables are normalized, the IQ-income correlation is strikingly linear throughout the full economic range, from extreme poverty all the way up to centibillionaire status. Indeed the value of the Pearson's r coefficient is a near-perfect +0.9739.

Of course this is the correlation among entire economic classes and thus is more than double what the individual level correlation would be because non-cognitive factors that affect income (luck, hard work, greed, health, appearance, connections etc) cancel each other out at the group level. Known in the literature as ecological correlations, group level correlations are commonly used in epidemiological studies.

To estimate what the correlation would be at the individual level, we take the slope of the line of best fit which is equal to said correlation when both variables are normalized Z scores.  This slope is 0.47 so roughly half of the normalized differences in economic class is associated with IQ.

The 0.47 figure is much higher than the IQ-income correlation usually reported in the literature and that's because it reflects the correlation of one's IQ with their (self-made) economic class and economic class (homeless, multimillionaire) is a much more stable and reliable indicator of financial success than a single year's income which in the case of stay-at-home wives, can dramatically underestimate their financial earnings since these typically come in the form of domestically negotiated life style, not official salary. In the case of panhandlers, welfare recipients and the disabled, income can overestimate self-made economic class because income is subsidized by government or the charity of strangers.

Indeed other research has found that when you exclude women and focus on permanent income, the IQ income correlation does indeed approach 0.5.

Of course the solution is not to exclude stay-at-home moms (and dads) from the studies, however assigning them zero earnings is wrong too since it implies they are freeloaders who earned nothing of the household wealth when in fact many of them were invaluable partners or at the very least, married wisely. One could solve this problem by using household income as the measure of earnings but this seems unfair to all the single people and gives housewives too much credit for their husband's money.

 If research on IQ and income should persist, I suggest that for individuals, income be measured as individual income but for married people, earnings be measured as [individual income + 0.5(household income)]/2. I further suggest that this be averaged over as many years as possible and that welfare/disability, undeclared income and child benefits be excluded.
PHOTO BY AXELLE/BAUER-GRIFFIN/FILMMAGIC/GETTY IMAGES
Last night Wall Street was rocked by the stunning news that Oprah was resigning from the board of Weight Watchers and giving all her shares to the museum of African American history.
The sheer POWER of Oprah is such that the news sent investors into a panic and Weight Watchers stock tumbled 25%. If any other entertainer had resigned from a brand, no one would care but Oprah has become so deeply entrenched in the elite that even the New York Times covered the story.
Even more shocking, the resignation happened right as the 70-year-old icon has had tongues wagging with her breathtaking weight loss.
Oprah left Weight Watchers not because she lost faith in the company, nor because she has a disagreement with management, but because their decision to move towards weight loss drugs creates a conflict of interest. Oprah wants the integrity to help people with their weight without trying to profit from it.
“Nobody does the right thing all the time but Oprah does the right thing more often than anyone else,” once said the late pioneering journalist Barbara Walters.
“My integrity is worth more than money,” she said to thundering applause as she tearfully said her goodbyes.
Although the average (self-made) billionaire has a very superior IQ of 130, some cut ethical corners and don’t fully appreciate abstract moral concepts like “conflict of interest”.
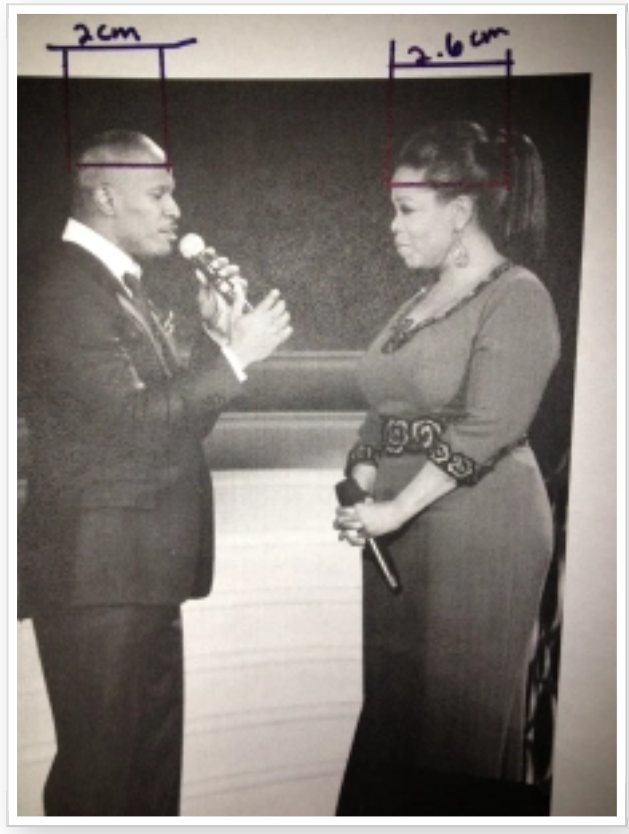
But growing up a poor, illegitimate, sexually abused black looking black female with fat genes, Oprah needed a freakishly big brain to become the most worshiped billionaire on the planet. This huge brain makes her at least 10 IQ points smarter than even the average self-made billionaire, and that in turn makes her more ethical, upper class, socially skilled, emotionally sensitive, entertaining and creative.
While other rich people are busy reading about stock prices or buying football teams or just watching TV, you can find the upper class Oprah sitting under a tree, quietly reading a great work of fiction at her $100 million Santa Barbara mansion or on her thousand acres of pristine Hawaii land, with no one around for miles except for a servant to bring her some tea.