• About

Pumpkin Person

~ The psychology of horror

Pumpkin Person

Monthly Archives: December 2016

Pumpkin Person’s hot chocolate recipe

17 Saturday Dec 2016

Posted by pumpkinperson in Uncategorized

≈ 126 Comments

Since much of North America is in the grip of a freezing weekend, I thought it’d be a good time to share my hot chocolate recipe.  I kind of copied this from a cooking show on OWN Canada (don’t know the name), but simplified it and changed it.

I love to spend winter weekends holded up at my remote lake cottage in the woods, where I put on the fire and snuggle on the couch beneath a sea of blankets, and watch a classy horror film like The Dark Hours, or an Atom Egoyan style dark drama,  or a series of a dark themed series like Six Feet Under, on a huge screen high definition TV.

And of course I need my hot chocolate on the coffee table in front of me, but not just any hot chocolate will do.  If you truly want to live like me and be part of the upper crust of the upper class, you must make your own.

You start with two chocolate bars (100 g each):  One MINTED milk chocolate, the other MINTED DARK chocolate.

photo-2

photo-8

You then break it into pieces and put the pieces in your hot chocolate maker.  If you can’t afford one of these, just use a pot on a stove.

photo-9

Then add a cup of milk and a cup of cream (or 2 cups of half and half if you’re clever).

photo-7

Then heat and mix

photo-5

Until it looks like this.

photo-4

Delicious.

photo-3

A wonderful desert on a cold winter night, like tonight.

Share this:

  • Twitter
  • Facebook

Like this:

Like Loading...

Educable (mild) Retardation on The Facts of Life

16 Friday Dec 2016

Posted by pumpkinperson in Uncategorized

≈ Leave a comment

Recently I posted an episode of the sitcom The Facts of Life that dealt with IQ, but sadly the video no longer works.

The POWER of this blog is such that almost every time I post a youtube, media owners seem to suddenly realize the enormous value of their old content and remove it from youtube.

Fortunately I found the only other episode of The Facts of Life that seemed to deal with intelligence (watch it quickly before they take it off youtube ).

In this episode, all the girls at the fictional Eastland New York private school are in love with a new boy who delivers the boarding house food, but what they don’t know is he has a tragic secret.

He’s retarded.

When this leads to an awkward confrontation, the school den mother Mrs Garrett makes it all better as usual with some words of wisdom.

One of the reasons the girls on campus don’t notice the boy is retarded is that he looks normal because he has familial retardation, meaning his retardation is just part of the normal spectrum of human intelligence, unlike organic retardation which is caused by a mutation of large effect, which impairs physical appearance and brain functions beyond intelligence.

Commenter “Mug of Pee” will happily concede that organic retardation is independently genetic because it has physical symptoms, but he downplays the independent effect of genes in biologically normal IQ differences.  It would be especially interesting to find cases where familial retardates have identical twins raised from birth in very different countries, because it’s hard to imagine such an immutable disability was not hard wired into the brain.

Another amusing thing about this episode of The Facts of Life is that we’re now in season 4, so the hilarious character “Jo” is by now a regular; the writers felt the show was missing a girl from a working class background.

a84041e7a5238d96444380f1ac108c20
young-john-travolta-10

“Jo” played by Nancy McKeon is like a young female John Travolta in both her appearance, attitude, and tough guy Brooklyn accent.

Share this:

  • Twitter
  • Facebook

Like this:

Like Loading...

The Facts of Life: IQ episode

14 Wednesday Dec 2016

Posted by pumpkinperson in Uncategorized

≈ 144 Comments

The Facts of Life was a popular U.S. sitcom that originally aired on NBC from August 24, 1979, to May 7, 1988, and then the reruns continued in syndication probably well into the late 1990s so for those of us in our thirties, it was an afterschool ritual, though younger readers may have never heard of it.  I was reminded of the show because Alan Thicke just died (RIP) and he wrote the shows memorable theme song.  The show launched the career of 80s teen star Molly Ringwald and even George Clooney.

The show was about a bunch of girls attending a New York boarding school under the protective care of loveable den mother Mrs Garrett (Charlotte Rae).  The show is a throwback to a more innocent period in American life, and a simpler time, when no problem was too big to be solved by a cup of hot chocolate and a few wise words from Mrs Garrett.

It’s been decades since I’ve seen an episode, but there was one episode I could never forget.  The one where the girls at the school discover their childhood IQ scores and all the harm it does to their relationships and self-esteem.  And as usual the wise den mother Mrs Garret to the rescue.

If you have half an hour to kill, I recommend you enjoy this funny, innocent, wholesome bit of 70s television.  You’ll be glad you did:


Share this:

  • Twitter
  • Facebook

Like this:

Like Loading...

How well does the SAT correlate with official IQ tests?

14 Wednesday Dec 2016

Posted by pumpkinperson in Uncategorized

≈ 49 Comments

I apologize to my readers for recycling so much old material, but certain crucial issues must be resolved before we can move forward knowledgeably.

In this post, I summarize all I have learned to date about how much high SAT performers regress to the mean when faced with official IQ tests and what this implies about the SAT’s correlation with said tests.  Some of the data may contradict previous posts, as new information has come to light, causing me to revise old numbers.

Study I: New SAT vs the Raven

A study by Meredith C. Frey and Douglas K. Detterman found a 0.48 correlation between the re-centered SAT and the Raven Progressive Matrices in a sample of 104 university undergrads, but after correcting for range restriction, they estimate the correlation to be 0.72 in a less restricted sample of college students.  I don’t buy it, but I’m not interested in how well the re-centred SAT would correlate with the Raven among college students, but among ALL American young adults. (including the majority who never took the SAT).

Using the Frey and Detterman data, I decided to look at the Raven scores of those who scored 1400-1600 on the re-centred SAT, because 1500 on the new SAT (reading + math) corresponds to an IQ of 143 (U.S. white norms), which is 46 points above the U.S. mean of 97. Now if the new SAT correlated 0.72 or higher among ALL American adults, we’d expect their Raven scores to only regress to no less than 72% as far above the U.S. mean, so 0.72(46) + 97 = IQ 130.

I personally looked at the scatter plot carefully and did my best to write down the RAPM IQs of every single participant with an SAT score from 1400-1600. This was an admittedly subjective and imprecise exercise given how small the graph is, but I counted 38 top SAT performers and these were their approximate RAPM IQs: 95, 102, 105, 108, 108, 110, 110, 113, 113, 113, 113, 113, 117, 117, 117, 117, 117, 120, 120, 120, 122, 122, 128, 128, 128, 128, 134, 134, 134, 134, 134, 134, 134, 134, 134, 134, 134, 134

raven

The median IQ is 120, and it does not need to be converted to white norms because the Raven was normed in lily white Iowa circa 1993, but as commenter Tenn noted, I should have perhaps corrected for the Flynn effect since the norms were ten years old at the time of the study.  Correcting for the Flynn effect reduces the median to 118 (U.S. white norms) which is 21 points above the U.S. mean of 97.

For people who are 46 IQ points above the U.S. mean on the new SAT to regress to only 21 points above the U.S. mean, suggests the new SAT correlates 21/46 = 0.46 with the Raven in the general U.S. population.

Study II: New SAT vs the abbreviated WAIS-R

Harvard is the most prestigious university in the World with an average SAT score in the stratosphere, thus it’s interesting to ask how Harvard students perform on an official IQ test. The best data on the subject was obtained by Harvard scholar Shelley H Carson and her colleagues who had an abbreviated version of the WAIS-R given to 86 “Harvard undergraduates (33 men, 53 women), with a mean age of 20.7 years (SD 3.3)… All were recruited from sign-up sheets posted on campus. Participants were paid an hourly rate…The mean IQ of the sample was 128.1 points (SD 10.3), with a range of 97 to 148 points.”

It should be noted however that the WAIS-R was published in 1981, and that the norms were collected from 1976 to 1980. Carson’s study was published in 2003, so presumably the test norms were 25 years old.

James Flynn cites data showing that from WAIS-R norms (circa 1978) to WAIS-IV norms (circa 2006) the vocabulary and spatial construction subtest (used in the abbreviated WAIS-R) increased by 0.53 SD and 0.33 SD respectively. These gains would result in the composite score of the abbreviated WAIS-R becoming obsolete at a rate of 0.26 IQ points per year, meaning the Harvard students’ scores circa 2003 were 6.5 points too high. This reduces the mean IQ of the sample to 121.6 (U.S. norms) which is about 120 (U.S. white norms); 23 points above the U.S. mean of 97 (white norms).

However Harvard’s median re-centered SATs of 1490 equate to IQ 143 (U.S. white norms) which is 46 points above the U.S. mean of 97.  Assuming the sampled Harvard students were cognitively representative of Harvard and assuming Harvard is cognitively representative of all 1490 SAT Americans, the fact they regressed from being 46 IQ points above average on the SAT to 23 IQ points above average on the abbreviated WAIS-R, suggests the re-centered SAT correlates 23/46 = 0.5 with the abbreviated WAIS-R.

Study III:  Old SAT vs the full original WAIS

Perhaps the single best study was referred to me by a commenter named Andrew.  In this study, data was taken from the older more difficult SAT, and participants took the full-original WAIS.  In this study, six samples of  seniors from  the extremely prestigious Dartmouth (the 12th most selective university in America) averaged 1357 on the SAT just before 1974. Based on my latest research, an SAT score of 1357 circa 1974 would have equated to an IQ of 144 (U.S. norms); 143 (U.S. white norms).  Because this is much higher than previously thought; the degree of regression is quite devastating.

Assuming these students are typical of high SAT Americans, it is interesting to ask how much they regress to the mean on various subtests of the WAIS.

Averaging all six samples together, and then adjusting for the yearly Flynn effect from the 1950s through the 1970s (see page 240 of Are We Getting Smarter?) since the WAIS was normed circa 1953.5 but the students were tested circa 1971.5, then converting subtest scaled scores to IQ equivalents, in both U.S. norms and U.S. white norms (the 1953.5 norming of the WAIS included only whites), we get the following:

iq equivalent (u.s. norms) iq equivalent (u.s. white norms) estimated correlation with sat in the general u.s. population inferred from regression to the mean from SAT IQ 44 points above U.S. mean.
sat score 144 143 44/44 = 1.0
wais information 128.29 127.2 28.29/44 = 0.64
wais comprehension 122.22 120.9 22.22/44 = 0.51
wais arithmetic 120.37 119 20.37/44 = 0.46
wais similarities 119.16 117.75 19.16/44 = 0.44
wais digit span 117.37 115.9 17.37/44 = 0.39
wais vocabulary 125.93 124.75 25.93/44 = 0.59
wais picture completion 105.87 104 5.87/44 = 0.13
wais block design 121.82 120.5 21.82/44 = 0.50
wais picture arrangement 108.33 106.55 8.33/44 = 0.19
wais object assembly 113.65 112.05 13.65/44 = 0.31
wais verbal scale 126 125 26/44 = 0.59
wais performance scale 116 114 16/44 = 0.36
wais full-scale 123 122 23/44 = 0.52

Conclusion

In three different studies (New SAT vs Raven, New SAT vs abbreviated WAIS-R, Old SAT vs WAIS), people averaging exceptionally high SAT scores averaged only 46%, 50%, or 52%, respectively, as far above the U.S. mean on the official IQ tests as they did on the SAT, suggesting the SAT (old or new), only correlates about 0.5 with official IQ tests.  Correlations in the range of 0.5 are about all you’d expect most educational measures (school grades, years of school) to correlate with IQ, but it’s a surprisingly low correlation given that some consider the SAT to be more than a mere education measure, but an IQ test itself.  So either the SAT is NOT equivalent to an IQ test, or it’s only equivalent to an IQ test among people with similar educational backgrounds, or my method of inferring correlations from the degree of regression is giving misleading results (perhaps because Spearman’s Law of Diminishing Returns is flattening the regression slope at high levels or because of ceiling bumping on the tests involved).

The potentially low correlation between the SAT (and presumably other college admission tests like the GRE, LSAT, etc) with official IQ has some positive implications.  It means that to whatever extent IQ and success are correlated in America, the correlation is a natural consequence of smart  people adapting to their environment, and not the artificial self-fulfilling prophecy of a man-made testocracy.

It also suggests that there’s no substitute for a real IQ test given by a real psychologist with blocks, cartoon pictures, jig-saw puzzles, and open-ended questions.  I can see David Wechsler, chuckling from the grave, saying “I told you so.”

Share this:

  • Twitter
  • Facebook

Like this:

Like Loading...

Converting pre-1995 SAT scores to IQ yet again

13 Tuesday Dec 2016

Posted by pumpkinperson in Uncategorized

≈ 44 Comments

Many high IQ societies accept specific scores from the pre-1995 SAT for admission, as if all SATs taken before the infamous recentering in April 1995 had the same meaning.  And yet Mensa, which only accepts the smartest 2% of Americans on a given “intelligence test” makes a curious distinction.  Prior to 9/30/1974, you needed an SAT score of 1300 to get into Mensa, yet from 9/30/1974 to 1/31/1994, you needed a score of 1250.

Well, that’s odd I thought, since all SAT scores from the early 1940s to 1994 are supposedly scaled to reflect the same level of skill, why did it suddenly become 50 SAT points easier to be in the top 2% in 1974?  And if such an abrupt change can occur in 1974, why assume stability every year before and since?  It didn’t make any sense.

And I wasn’t the only one who was wondering.  Rodrigo de la Jara, owner of iqcomparisonsite.com, writes:

If someone knows why they have 1300 for scores before 1974, please send an email to enlighten me.


The mean verbal and math SAT scores, if ALL U.S. 17-year-olds had taken the old SAT

To determine how the old SAT maps to IQ I realized I couldn’t rely on high IQ society cut-offs.  I need to look at the primary data.  Now the first place to look was at a series of secret studies the college board did in the 1960s, 1970s, and 1980s.  These studies gave an abbreviated version of the SAT to a nationally representative sample of high school juniors.  Because very few Americans drop out of high school before their junior year, a sample of juniors cam close to representing ALL American teens, and then scores were statistically adjusted to show how virtually ALL American teens would average had they taken the SAT at 17. The results were as follows (note, these scores are a lot low than the actual mean SAT scores of people who take the SAT, because they also include all the American teens who usually don’t):

nationalnorm

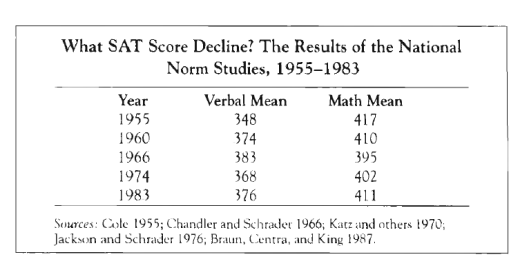
Chart I: taken from page 422 of The Bell Curve (1994) by Richard J. Herrnstein and Charles Murray: Estimated mean verbal and math SATs by year, if all U.S. 17-year-olds had took the SAT, not the college bound elite only.

The verbal and math standard deviations if ALL U.S. 17-year-olds had taken the old SAT

 Once I knew the mean SAT scores if ALL American teens had taken the SAT at 17 in each of the above years, I needed to know the standard deviations.   Although I knew the actual SDs for 1974, I don’t know them for other years, so for consistency, I decided to use estimated SDs.

According to the book The Bell Curve, since the 1960s, virtually every single American teen who would have scored 700+ on either section of the SAT, actually did take the SAT (and as Ron Hoeflin has argued, whatever shortfall there’d be would be roughly balanced by brilliant foreign test takers).  This makes sense because academic ability is correlated with taking the SAT, so the higher the academic ability, the higher the odds of taking the SAT, until at some point, the odds likely approach 100%.

Thus if 1% of all American 17-year-olds both took the SAT and scored 700+ on one of the subscales, then we know that even if 100% of all U.S. 17-year-olds had taken the SAT, still only 1% would have scored 700+ on that sub-scale.  By using this logic, it was possible to construct a graph showing what percentage of ALL U.S. 17-year-olds were capable of scoring 700+ on each sub-scale, each year:

sevenhundred

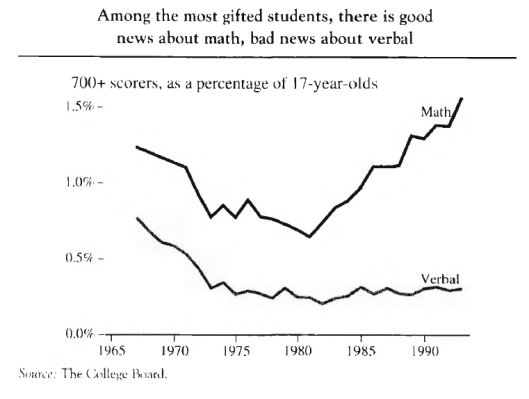
Chart II: taken from page 429 of The Bell Curve (1994) by Richard J. Herrnstein and Charles Murray

What the above graph seems to show is that in 1966, a verbal score of 700+ put you in about the top 0.75% of all U.S. 17-year-olds, in 1974 it put you around the top 0.28%, in 1983 about the top 0.28% and in 1994 about the top 0.31%.

Similarly, scoring 700+ on math put you around the top 1.25% in 1966, the top 0.82% in 1974, the top 0.94% in 1983, and the top 1.52% in 1994.

Using the above percentages for each year, I determined how many SDs above the U.S. verbal or math SAT mean (for ALL 17-year-olds) a 700 score would be on a normal curve, and then divided the difference between 700 and each year’s mean (Chart I) by that number of SDs, to obtain the estimated SD. Because Chart I did not have a mean national score for 1994, I assumed the same means as 1983 for both verbal and math.  This gave the following stats:

sds

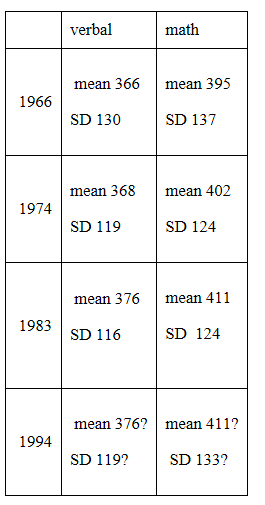
Chart III: Estimated means and SD for the pre-re-centered SAT by year, if all U.S. 17-year-olds had taken the SAT, not just the college bound elite

Calculating verbal and math IQ equivalents from the old SAT

Armed with the stats in chart III, it’s very easy for people who took the pre-recentered SAT to convert their subscale scores into IQ equivalents.  Simply locate the means and SDs from the year closest to when you took the PRE-RECENTERED SAT, and apply the following formulas:

Formula I

Verbal IQ equivalent (U.S. norms)  = (verbal SAT – mean verbal SAT/verbal SD)(15) + 100

Formula II

Math IQ equivalent (U.S. norms) =  (math SAT – mean math SAT/math SD)(15) + 100


Calculating the mean and SD of the COMBINED SAT if all U.S. 17-year-olds had taken the test

Now how do we convert combined pre-recentered SATs (verbal + math) into IQ equivalents.  Well it’s easy enough to estimate the theoretical mean pre-recentered SAT for each year by adding the verbal mean to the math mean.  But estimating the standard deviation for each year is trickier because we don’t know the frequency for very high combined scores for each year, like we do for sub-scale scores (see Chart II).  However we do know it for the mid 1980s. Ron Hoeflin claimed that out of a bit over 5,000,000 high-school seniors who took the SAT from 1984 through 1988, only 1,282 had combined scores of 1540+.

Hoeflin has argued that even though only a third of U.S. teens took the SAT,  virtually 100% of teens capable of scoring extremely high on the SAT did so, and whatever shortfall there might be was negated by bright foreign test-takers.

Thus, a score of 1540+ is not merely the 1,282 best among 5 million SAT takers, but the best among ALL fifteen million Americans who were 17 years-old anytime from 1984 through 1988.  In other words, 1540 was a one in 11,700 score, which on the normal curve, is +3.8 SD.  We know from adding the mean verbal and math for 1983 in Chart I, that if all American 17-year-olds had taken the SAT in 1983, the mean COMBINED score would have been 787, and if 1540 is +3.8 SD if all 17-year-olds had taken it, then the SD would have been:

(1540 – 787)/3.8 = 198

But how do we determine the SD for the combined old SAT for other years?  Well since we know the estimated means and SD of the subscales, then Formula III is useful for calculating the composite SD (from page 779 of the book The Bell Curve by Herrnstein and Murray):

formula

Formula III

r is the correlation between the two tests that make up the composite and σ is the standard deviation of the two tests.

However Formula III requires you to know the correlation between the two subscales.  Herrnstein and Murray claim that for the entire SAT population, the correlation between SAT verbal and SAT math is 0.67 however we’re interested in the correlation if ALL American young adults had taken the old SAT, not just the SAT population.

However since we just estimated that the SD of the combined SAT if all 17-year-olds took the SAT in 1983 would have been 198, and since we know from Chart III that the 1983 verbal and math SDs if all 17-year-olds had taken the SAT would have been 116 and 124 respectively, then we can deduce what value of r would cause Formula III to equal the known combined SD of 198.  Shockingly, that value is only 0.36!

Now that we know the correlation between the verbal and math SAT if all U.S. 17-year-olds had taken the SAT would have been only 0.36 in 1983, and if we assume that correlation held from the 1960s to the 1990s, using the sub-scale SDs in chart III, we can apply Formula III to determine the combined SDs for each year, and of course the combined mean for each year is just  the sum of the verbal and math means in chart III.

revised

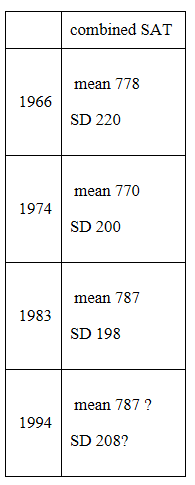
Chart IV: Estimated means and SDs of the combined pre-recentered SAT if all U.S. 17-year-olds had taken the test


Calculating full-scale IQ equivalents from the old SAT

Armed with the stats in Chart IV, it’s very easy for people who took the pre-recenetered SAT to convert their COMBINED scores into IQ equivalents.  Simply locate the means and SDs from the year closest to when you took the PRE-RECENTERED SAT, and apply the following formula:

Formula IV

Full-scale IQ equivalent (U.S. norms)  = (combined SAT – mean combined SAT/combined SD)(15) + 100

*Note: the IQ equivalent of SAT scores above 1550 or so will be underestimated by this formula because of ceiling bumping.

Was Mensa wrong?

Based on chart IV, it seems Mensa is too conservative when it insists on SAT scores of 1300 prior to 9/30/1974 and scores of 1250 for those who took it from 9/30/1974 to 1/31/1994.  Instead it seems that the Mensa level (top 2% or + 2 SD above the U.S. mean) is likely achieved by scores of 1218 for those who took the SAT close to 1966, and only 1170 for those who took it closer to 1974.  For those who took the pre-recentered SAT closer to 1983 or 1994, it seems Mensa level was achieved by scores of 1183 and 1203 respectively.

Of course all of my numbers assume a normal distribution which is never perfectly the case, and it’s also possible that the 0.36 correlation between verbal and math I found if all 17-year-olds took the SAT in 1983 could not be generalized to other years, so perhaps I’m wrong and Mensa is right.  But it would be nice to know how they arrived at their numbers.

Share this:

  • Twitter
  • Facebook

Like this:

Like Loading...

The black-white IQ gap

05 Monday Dec 2016

Posted by pumpkinperson in Uncategorized

≈ 1,115 Comments

From about 1917 to 2006, large representative samples of American black adults have scored about one standard deviation below American white adults on the type of verbal and performance IQ tests first created for screening WWI recruits, and later borrowed by David Wechsler to use in his wildly popular scales; considered the gold standard in the field.

Although the black-white test score gap has shrunk somewhat on more scholastic tests where it used to be absurdly high, the longevity and consistency of the gap on the most conventional and respected of official IQ tests has led some to conclude that it is mostly or entirely genetic.

The single most powerful piece of supporting evidence for the genetic hypothesis is the Minnesota Transracial adoption study in which white, black and mixed-race kids were raised from early childhood in white upper-class homes.  Although the adopted white and black kids scored well above the national white and black means (corrected for outdated norms) of about 102 and 86 respectively (U.S. norms)  in childhood (though not at 17), large racial IQ gaps were found among the adopted kids at both ages.

adopt

However the study had a problem, as explained by its authors Scarr and Weinberg (1976):

It is essential to note, however, that the groups also differed significantly (p < .05) in their placement histories and natural mother’s education. Children with two black parents were significantly older at adoption, had been in the adoptive home a shorter time, and had experienced a greater number of preadoption placements. The natural parents of the black/black group also averaged a year less of education than those of the black/white group, which suggests an average difference between the groups in intellectual ability. There were also significant differences between the adoptive families of black/black and black/white children in father’s education and mother’s IQ.[1]

Because the children with two black biological parents were adopted later than the children with only one black biological parent, it’s best to exclude them from our analysis and focus only the IQ gap between the adopted kids with two white biological parents and those with one black and one white biological parent.  Not only were both these groups adopted early into white upper-class homes, but since both had white biological mothers, both enjoyed the benefits of a white prenatal environment.  What the study found was that by age seven, the fully white kids average IQ 111.5 and the half-black kids averaged 105.4, a difference of 6.1 points (see chart above).

This difference may sound small, but keep in mind that we are not comparing full-blooded blacks to full-blooded whites, we are comparing half-African Americans to full-blooded whites.  Also keep in mind that because everyone is being raised in the same social class, and social class independently explains such a large percent of the IQ variance at age seven, the entire IQ scale becomes compressed, so instead of the white standard deviation being about 14.5 (U.S. norms), it is only 11.3 in these adopted white kids.  Thus a 6.1 point gap should be thought of as a 0.54 SD gap since 6.1/11.3 = 0.54.

So if kids with one black parent score 0.54 SD below white kids when both are raised in upper class homes and both have white prenatal environments, that 0.54 SD gap is arguably 100% genetic.  And if having one black parent causes a 0.54 SD genetic drop in IQ, then having two black parents should cause a 1.08 SD genetic drop in IQ (note that the national black-white IQ gap in adults has been about 1 SD since WWI).

Failure to replicate

Now before HBDers get too excited, one should remember that the Minnesota transracial adoption study has never been replicated and that three other similar studies failed to find much of any black < white IQ gap, with some even showing the opposite pattern.

Tizard (1974) compared black, white and mixed-race kids raised in English residential nurseries and found that the only significant IQ difference favored the non-white kids. A problem with this study is that the children were extremely young (below age 5) and racial differences in maturation rates favor black kids. A bigger problem with this study is that the parents of the black kids appeared to be immigrants (African or West Indian) and immigrants are often hyper-selected for IQ (see Indian Americans).

A second study by Eyferth (1961) found that the biological illegitimate children of white German women had a mean IQ of 97.2 if the biological father was a white soldier and 96.5 if the biological father was a black soldier (a trivial difference). Both the white and mixed kids were raised by their biological white mothers. One problem with this study is that the biological fathers of both races would have been screened to have similar IQs because at the time, only the highest scoring 97% of whites and highest scoring 70% of blacks passed the Army General Classification Test and were allowed to be U.S. soldiers. In addition, 20% to 25% of the “black fathers” were not African-American or even black Africans, but rather French North Africans (dark caucasoids as we define them here).

A third study by Moore (1986) included a section where he looked at sub-samples of children adopted by white parents. He found that nine adopted kids with two black biological parents averaged 2 IQ points higher than 14 adopted kids with only one biological black parent.  A 2 point IQ gap sounds small, but as I mentioned above, the IQ scale is compressed in kids when everyone is raised in the same social class (which might have been the case in this study), so a 2 point gap becomes 0.18 of the compressed white SD.

The results of this study suggest that half-white kids are 0.18 SD genetically duller than black kids, which predicts that fully white kids are 0.36 SD genetically duller than black kids.  One problem with this study is that the black kids would have had black prenatal environments while many, or all, of the half-white kids would have had white prenatal environments, but given the low birth weight of black babies, if anything this suggests the genetic IQ gap favoring blacks is even larger than 0.36 SD!

Conclusion

We have two quality studies: The Minnesota Transracial adoption study (when black kids are excluded because of confounds) and Moore (1986).  The first study implies U.S. black genes reduce IQ by 1.04 SD in kids (-1.04 SD), while the second implies U.S. black genes increase IQ by 0.36 SD in kids (+0.36 SD).  But the first analysis was based on comparing 55 mixed kids to 16 white kids (total n = 71), while the second analysis was based on comparing nine black kids with 14 mixed kids (total n = 23).  The total n of both studies combined is 94, so the first study provided 76% of the total sample while the second study provided 24%, thus the best I can do is just weigh these two conflicting results by sample size:

Effect of black genes on childhood IQ = 0.76(-1.04 SD) + 0.24(+0.36 SD)

Effect of black genes on childhood IQ = -0.79 SD + 0.09

Effect of black genes on childhood IQ = -0.7 SD

What this suggests is that on a scale where the white genetic IQ is set at 100 with an SD of 15, the U.S. black genetic IQ is 90, at least in childhood (in adulthood it may be around 85 since some IQ genes might not exert influence until post-puberty).  This is consistent with the fact that despite half a century of affirmative action, the average black IQ (when expressed with reference to white norms) remains below 90 in both children and adults (see charts below).

On the other hand, my estimate is based on only two studies with a combined sample of only 71 adopted kids and we can only assume (based on education when known) that the IQs of their biological parents are roughly racially representative.  And although the black-white IQ gap in adults has apparently changed not at all since WWI, the environmental gap might not have changed that much either.  Despite decades of affirmative action, the median wealth for white families in 2013 was around $141,900, compared to Hispanics at about $13,700 and blacks at about $11,000 so even in the age of a black President, environmental factors can’t be ruled out.

Appendix

Black white IQ gap in the Wechsler Intelligence Scale for Children in the nationally representative samples used to norm each edition:

white iq (u.s. norms) black iq (u.s. norms) white iq (white norms) black iq (white norms) black-white iq gap (u.s. norms) black-white iq gap (white norms)
wisc-r (1972) 102.3 (sd = 14.08) 86.4 (sd = 12.63) 100 (sd = 15) 83 (sd = 13.46) 15.9 17
wisc-iii (1989) 103.5 (sd = 13.86) 88.6 (sd = 12.83) 100 (sd = 15) 84 (sd = 13.89) 14.9 16
wisc-iv (2002) 103.2 (sd = 14.52) 91.7 (sd = 15.73) 100 (sd = 15) 88 (sd = 16.25) 11.5 12
wisc-v (2013) 103.5 (sd = 14.6) 91.9 (sd = 13.3) 100 (sd = 15) 88 (sd = 13.66) 11.6 12

Black white IQ gap in the Wechsler Adult Intelligence Scale in the nationally representative samples used to norm each edition:

white iq (u.s. norms) black iq (u.s. norms) white iq (white norms) black iq (white norms) black-white iq gap (u.s. norms) black-white iqgap (white norms)
wais-r (1978) 101.4 (sd = 14.65) 86.8 (sd = 13.14) 100 (sd = 15) 85 (sd = 13.45) 14.6 15
wais-iii (1995) 102.6 (sd = 14.81) 89.1 (sd = 13.31) 100 (sd = 15) 86 (sd = 13.48) 13.5 14
wais-iv (2006) 103.4 (sd = 14) 87.7 (sd = 14.4) 100 (sd = 15)  83 (sd = 15.43) 15.7  17


Sources for charts:

WISC-R, WISC-III, and WISC-IV U.S. norms, from pg 27 (Table A1) of Black Americans Reduce the Racial IQ Gap: Evidence from Standardization Samples by William T. Dickens & James R. Flynn

WAIS-IV U.S. norms from pg 190 of WAIS-IV, WMS-IV, and ACS: Advanced Clinical Interpretation edited by James A. Holdnack, Lisa Drozdick, Lawrence G. Weiss, Grant L. Iverson

WISC-V U.S. norms from page 157, table 5.3 of WISC-V Assessment and Interpretation: Scientist-Practitioner Perspectives By Lawrence G. Weiss, Donald H. Saklofske, James A. Holdnack, Aurelio Prifitera


Share this:

  • Twitter
  • Facebook

Like this:

Like Loading...

Racial differences in penis size

03 Saturday Dec 2016

Posted by pumpkinperson in Uncategorized

≈ 450 Comments

rushton

Taken from pg 168 of Race, Evolution and Behavior: A Life History Perspective, Third Edition, by J. Philippe Rushton


Blogger Race Realist continues to be skeptical about racial differences in penis size,  but the data from the United States, where both whites and blacks are reared with similar nutrition, seems to show quite conclusively that blacks (at least those of West African descent) have longer and thicker penises than whites.  From the above chart, assuming a normal distribution, I estimate the average white American man has a penis length of 162 mm (SD = 19) , and the average African American man has a penis length of 170 mm (SD = 19). (since 5% of black men are longer that 200 mm, and 2% of white men are, while 27% of white men have penises shorter than 151 mm, while 15% of black men do).

But small differences is the mean have huge implications at the extremes. Assuming a normal distribution, one in 3.4 million African American men would have a penis length > 264 mm, vs only one in about 30 million white men.

What about penis circumference? Once again, black men come out on top. 9% of African American men are > 150 mm, while only 5% of white American men are. Only 2% of men in either race are < 75 mm. Assuming a normal curve, that implies white American men have a mean penis circumference of 117 mm (SD = 21), while black American men have a mean penis circumference of 121 mm (SD = 23). Note the larger SD in black men; they not only have a higher mean, but more variability. This means that black men will be dramatically over-represented among the thickest penises in America, and among the ten thickest in America, 100% should be black; unless some non-black man has some kind of freak mutation.

Penis Quotient

To put these penis measurements in perspective, one can map them to the IQ scale where the white mean and SD are set at 100 and 15 respectively, but instead of calling them IQs (intelligence quotients), we’d have to call them PQs (penis quotients).  And just as IQ tests like the Wechsler yield a verbal IQ, a Performance IQ, and a full-scale IQ, we can calculate length PQ, circumference PQ, and full-scale PQ.

On such a scale, blacks have a mean length PQ of 106 and a circumference PQ of 103 compared to the white mean which by definition is always 100.  Estimating their full-scale PQ depends on the correlation between length and circumference, which I don’t know, but assuming it’s about 0.45 (like the correlation between height and weight), then their full-scale PQ should average 105.  But it should be noted that U.S. blacks are about 15% white on average, so we might expect full-blooded blacks, raised with First World nutrition, to have a full-scale PQ of 106.

So the black > white PQ difference is only about a third as large as the white > black IQ difference, and similar to the East Asian > white IQ difference.  With the difference being relatively small, it will not be found in all studies, and on a global scale, I’d expect the average white to have a larger penis than the average black, since most blacks live in the Third World where their small genetic advantage is dwarfed by the huge nutritional deficit (which occurs even among Third World elites).

The behavior body connection

I got a few emails asking why someone of my sophistication and social class would even entertain such a tawdry topic.  The answer is I find J.P. Rushton’s research absolutely fascinating in that just as a bigger brain correlates with more adaptive behavior, a bigger penis correlates with more sexual behavior, and that there was an evolutionary tradeoff between these two body parts, as humans marched up the evolutionary tree from monkey to man.  Of course our closest ape relatives don’t have especially large penises but their overall genitalia is huge.  I suspect Homo Erectus had a larger penis than any modern human race.

Bring Mamma home a big one

One of the most infamous moments in the history of The Oprah Winfrey Show was when Oprah was interviewing a nerdy female scientist about penis size and sexual satisfaction.  Not content with boring facts and figures, big brained Oprah sensed her audience wanted to know about the scientist’s sexual preferences.  The scientist didn’t want to get personal and continued to blather on about statistics, at which point Oprah said:

But if you had a choice you’d want a big one, right?  Bring Mamma home a big one!

The audience went wild!

Despite Oprah’s superhuman cranial capacity, from the neck down she is still a typical black woman, and the sex drive of the African jungles still raced through her blood.

It was at this point that Phil Donahue, the former reigning monarch of daytime TV, must have felt his empire crumble.  For he could never compete with the sassy Oprah on a level that truly connected with America.

15537oprah-winfrey-and-donahue-oprahwinfreyhretrocredit-image-judie-cdba9d

Though once Oprah became the richest African American of all time, she replaced the trash talk with higher discussions about new age spirituality, literature, and self-actualization.

But millions miss the original Oprah who the public and even the critics couldn’t get enough of.  The one who wasn’t so polished, politically correct, and upper class.  As Howard Rosenberg, TV critic of The Los Angeles Times, observed back on Sept. 8, 1986:

She’s roundhouse, a full-course meal, big, brassy, loud, aggressive, hyper, laughable, lovable, soulful, tender, lowdown, earthy, raw, and hungry.  And she may know the way to Phil Donahue’s jugular.

article-0-0c0233aa000005dc-391_224x363

Down and dirty Oprah from the 1980s, was not the polished classy woman we know today who would never wear fur


Share this:

  • Twitter
  • Facebook

Like this:

Like Loading...
Newer posts →

contact pumpkinperson at easiestquestion@hotmail.ca

Recent Comments

LOADED on A reader’s cousin takes…
pumpkinperson on A reader’s cousin takes…
if you must gamble,… on A reader’s cousin takes…
why are south asians… on A reader’s cousin takes…
if you can take a jo… on A reader’s cousin takes…
but trying to beat t… on A reader’s cousin takes…
as dalio said, "beat… on A reader’s cousin takes…
brazil scores! on A reader’s cousin takes…
The Philosopher on A reader’s cousin takes…
why "buy and hold" !… on A reader’s cousin takes…
there is one best st… on A reader’s cousin takes…
dealwithit on A reader’s cousin takes…
The philosopher on A reader’s cousin takes…

Archives

  • January 2021
  • December 2020
  • November 2020
  • October 2020
  • September 2020
  • August 2020
  • July 2020
  • June 2020
  • May 2020
  • April 2020
  • March 2020
  • February 2020
  • January 2020
  • December 2019
  • November 2019
  • October 2019
  • September 2019
  • August 2019
  • July 2019
  • June 2019
  • May 2019
  • April 2019
  • March 2019
  • February 2019
  • January 2019
  • December 2018
  • November 2018
  • October 2018
  • September 2018
  • August 2018
  • July 2018
  • June 2018
  • May 2018
  • April 2018
  • March 2018
  • February 2018
  • January 2018
  • December 2017
  • November 2017
  • October 2017
  • September 2017
  • August 2017
  • July 2017
  • June 2017
  • May 2017
  • April 2017
  • March 2017
  • February 2017
  • January 2017
  • December 2016
  • November 2016
  • October 2016
  • September 2016
  • August 2016
  • July 2016
  • June 2016
  • May 2016
  • April 2016
  • March 2016
  • February 2016
  • January 2016
  • December 2015
  • November 2015
  • October 2015
  • September 2015
  • August 2015
  • July 2015
  • June 2015
  • May 2015
  • April 2015
  • March 2015
  • February 2015
  • January 2015
  • December 2014
  • November 2014
  • October 2014
  • September 2014
  • June 2014
  • May 2014
  • April 2014

Categories

  • autism
  • chronometrics
  • dark dramas
  • ethnic genetic interests
  • ethnicity
  • Flynn effect
  • genetic similarity theory
  • heritability
  • horror
  • income
  • Ivy League
  • love stories
  • Low IQ
  • Michael Jackson
  • Oprah
  • politics
  • pumpkinperson
  • Uncategorized

Meta

  • Register
  • Log in
  • Entries feed
  • Comments feed
  • WordPress.com

Create a free website or blog at WordPress.com.

Cancel
%d bloggers like this: