A 2015 paper by Kate Cockcroft et al., compares the scores of 349 British middle class university undergrads to 107 lower class black South African undergrads on the WAIS-III (UK edition).
The results were as follows:
The UK students averaged a full-scale IQ of 106.95 (UK norms) while the South Africans averaged IQ 93.27. However because this study was published 18 years after the UK WAIS-III was published, we should adjust for the Flynn effect.
The single best source on recent Wechsler Flynn effects is Weiss et al., 2015 which found that full-scale IQ has been increasing by 0.31 points per year, at least in U.S. children. If we assume it’s the same for UK adults, then the UK students have an adjusted IQ of 101 and the South African students have an adjusted IQ of 88.
What’s more interesting to me is how they did on the culture reduced tests since that’s the more fair comparison.
Test:
Digit Span scaled score
Flynn adjusted Digit Span scaled score
Flynn adjusted Digit Span IQ equivalent
Block Design scaled score
Flynn adjusted Block Design scaled score
Flynn adjusted Block Design IQ equivalent
Compoite IQ based on adjusted scores on both tests
UK undergrads
9.5
9.32
97
10.66
9.76
99
98
Black South African undergrads
9.35
9.17
96
8.67
7.77
89
91
So on a composite score of the most culture reduced spatial & non-spatial test (Block Design & Digit Span), Black South African undergrads average IQ 91. This is 11 points higher than the average Black South African seems to score on the same culture reduced tests.
As of 2013, only 16% of South Africa’s black young adults were attending higher education (compared to about 55% of whites, 47% of Indians and 14% of Coloureds). Thus, simply attending university puts one in the top 16% of this demographic, with the median South African university student being in the top 8%. If there were a perfect correlation between IQ and education, the median South African black university student would have an IQ 21 points higher than the average black South African. In reality his IQ is only 11 points higher, suggesting a correlation of 0.52 (at least on the most culture reduced tests).
This is similar to the 0.57 correlation between IQ and education observed in the United States.
IQ tests are considered valid because they have both construct validity and predictive validity. They have construct validity because a statistical technique called factor analysis proves that all mental tests are influenced by a general factor dubbed g, and that IQ tests load high in g. They have predictive validity because IQ tests better predict important life outcomes like education, income and occupational status than any other single measurable trait.
However IQ skeptics like our very own Race Realist (RR) argue that this validity is just an artifact of test construction. In other words, all IQ tests correlate with g, not because they measure a factor common to all mental abilities, but rather because only tests that are positively correlated are included in test batteries.
Similarly, he’d argue that IQ tests predict success in school and life, not because high IQ people learn faster, make wiser life choices and are more productive, but rather because only test items that good students did well on were included in the tests.
There’s some truth to RR’s view. Tests of general knowledge only became used in IQ tests after WWI testing found them to correlate highly with the total score of other subtests. In addition, David Wechsler would present potential test items to people of “known intelligence” and primarily those items that discriminated well between people with known Binet IQs of different levels were included. A question about a non-Christain religion was included in the general knowledge subtest after Wechsler found it to distinguish those Americans with superior from average IQs.
Given that IQ tests owe at least a small part of their validity to test construction, it’s interesting to ask whether IQ tests would still have the same construct and predictive validity if we remove the selective bias in picking subtests and test items.
What is needed is a random sample of mental abilities, not one pre-selected by psychologists. The closest thing we have to such a sample are board games. Thus, instead of the 10 subtests Wechsler arbitrarily chose for his original scale, we could simply pick the 10 “most popular” board games of all time:
chess
checkers
Backgammon
Scrabble
Monopoly
Clue
Othello
Trivial Pursuit
Pictionary
Risk
An ideal study would be to take 2000 random teenagers with very little experience playing any of these games, and send them to a summer camp where all they did was play these 10 games everyday (though no special strategies would be taught), culminating in a tournament where all 2000 were ranked on each game, and then given an overall ranking that reflected their combined performance across all ten games. This combined ranking would be converted into full-scale IQ, such that the best overall player (out of 2000) would be assigned a full-scale IQ of 150 and the worst would be assigned a full-scale IQ of 50.
If there really is a g factor, we should expect that while some people are great at chess but terrible at Pictionary, in general people who are good or bad at one game would be good or bad at any other.
Further, if g has predictive validity, we should find that 30 years later, those with the highest full-scale IQs would have more education, more prestigious occupations, and higher incomes (even after controlling for family background) than those who performed poorly.
I decided to look at an excellent study that Lynn had cited. In this study you had 14 pairs of identical twins (one born undernourished, the co-twin born well nourished as measured by birth weight; twin pairs were raised in the same homes). At an average age of 13, they had their head circumferences measured and were given the WISC IQ test.
The heavier twins had crania that were 0.64 cm bigger than their undernourished co-twin. At age 13, the within sex standard deviation for head circumference appears to be 1.31 cm, so that’s a difference of 0.49 standard deviations.
When it came to verbal IQ, the well-noursihed twins and the undernourished twins had the exact same average IQ. And when I saw the exact same average IQ, I mean the exact same average IQ: 98.29 vs 98.29 (unadjusted for old norms)
However when it came to performance IQ, the well nourished twins scored 7.07 IQ points higher than their undernourished co-twins. That’s a difference of 0.47 standard deviations, virtually identical to the 0.49 standard deviation difference in head circumferences.
So it seems that Richard Lynn was half-right. Brain size gains caused by prenatal nutrition do perfectly parallel IQ gains caused by nutrition, but only when it comes to Performance IQ. Prenatal nutrition seems to have virtually zero impact on Verbal IQ, though given the small sample size (only 14 twin pairs), these conclusions are tentative.
It’s amazing how well this study of identical twins perfectly parallels the difference between North American young adults in the 21st century vs circa WWII.
21st century North American young white adults are to their circa WWII counterparts as well nourished identical twins are to their less nourished co-twin in that their head circumference and Wechsler Performance IQs are both about half an SD larger, while their verbal IQs are about the same.
Because humans are cultural creatures, I believe the brain evolved to prioritize verbal ability during times of malnutrition (which as Lynn noted, includes disease since disease prevents the body from using nutrients), so when sub-optimum nutrition shrinks the brain, mostly spatial IQ suffers, and then when prosperity returns you get a genuine Flynn effect, but it’s 100% concentrated in spatial ability. Spatial ability is a luxury of the well fed.
One might wonder why, with all the increasing education and media, I did not find any verbal Flynn effect on the Wechsler. It’s likely that 21st century education gave us an unfair advantage on verbal tests especially Similarities, but this advantage was negated by the fact that a test created in the 1930s was biased against us (especially in tests of specific knowledge). In other words, two conflicting cultural biases cancelled each other out, thus exposing our true verbal intelligence as unchanged since WWII.
The Flynn effect, popularized by James Flynn, refers to the fact that IQ tests supposedly get easier with time. Although by definition the average IQ of American or British (white) people is always 100, the older the IQ test, the easier it is to score 100. Thus to keep the average at 100, tests like the Wechsler must be renormed every 10 years or so, otherwise the average IQ would increase by about 3 points per decade.
Although scholars continue to debate whether the Flynn effect reflects a genuine increase in intelligence (perhaps caused by prenatal nutrition or mental stimulation) or just greater test sophistication caused by modernity, there’s been remarkably little skepticism about the existence of the Flynn effect itself.
If an American born in the nineteen-thirties has an I.Q. of 100, the Flynn effect says that his children will have I.Q.s of 108, and his grandchildren I.Q.s of close to 120—more than a standard deviation higher. If we work in the opposite direction, the typical teen-ager of today, with an I.Q. of 100, would have had grandparents with average I.Q.s of 82—seemingly below the threshold necessary to graduate from high school. And, if we go back even farther, the Flynn effect puts the average I.Q.s of the schoolchildren of 1900 at around 70, which is to suggest, bizarrely, that a century ago the United States was populated largely by people who today would be considered mentally retarded.
While few people believe our grandparents were genuinely mentally retarded, it’s taken for granted that they would have scored in the mentally retarded range by today’s standards.
But is this true? I began having doubts over a decade ago when I examined the items on the first Wechsler intelligence scale ever made: the ancient WBI (Wechsler Bellevue intelligence scale). Meticulously normed on New Yorkers in the 1930s, this test remains far and away the most comprehensive look we have at early 20th century white North American intelligence, and while some of the subtests looked easy by today’s standards, others, especially vocabulary, looked harder.
The Kaufman effect
What also struck me was how little instruction, probing or coaching people got when taking the ancient WBI, compared to its modern descendant the WAIS-IV. This matters a lot because the way the Flynn effect is calculated on the Wechsler is by giving a new sample of people both the newest Wechsler and its immediate predecessor, in random order to cancel out practice effects, and then seeing which version they score higher on. If they average 3 points lower on the WAIS-IV normed in 2006 than on the WAIS-III normed in 1995, it’s assumed IQ increased by 3 points in 11 years.
The problem with this method (as Alan Kaufman may have discovered before me) is that the subset of the sample that took the newer version first has a huge advantage on the older version compared to the norming sample of the older test (over and above the practice effect which is controlled for), because the norming sample of the older test was never given coaching and probing.
Statistical artifact
A Promethean once said maybe the Flynn effect is just a statistical artifact of some kind. He never told me what he meant, but it got me thinking:
One problem with how the Flynn Effect is calculated on the Wechsler is that it’s assumed that gains over time can be added. For example it’s assumed that you can add the supposed 7.8 IQ gain from WAIS normings 1953.5 -1978 to the 4.2 IQ gain from normings 1978 – 1995 to the 3.7 IQ gain from normings 1995-2006, for a grand total of 15.7 IQ points from normings 1953.5 – 2006.
This would make sense if he were talking about an absolute scale like height, but is problematic when talking about a sliding scale like IQ. For example, suppose the raw number of questions correctly answered in 1953.5 was 20 with an SD of 2. By 1953.5 standards, 20 = IQ 100 and every 2 points = 15 IQ points above or below 100. Now suppose in 1978, people averaged 22 with an SD of 1. That’s a gain of 15 IQ points by 1953.5 standards. Now suppose in 1995 people average 23 with an SD of 2. That’s a gain of 15 IQ points by 1978 standards. Adding the two gains together implies a 30 point gain from 1953.5 to 1995, but by both 1953 and 1993 standards, the difference is only 23 points.
Changing content
Another problem with studying the Flynn effect is the content of tests like the Wechsler is constantly changing. This is especially problematic when studying long-term trends in general knowledge and vocabulary. If words that are obscure in the 1950s become popular in the 1970s, then people in the 1970s will score high on the 1950s vocabulary test. Meanwhile the 1970s vocabulary test may contain words that don’t become popular until the 1990s, Thus adding the vocabulary gains from the 1950s to the 1970s to the gains from the 1970s to the 1990s, might give the false impression that people in the 1990s will do especially well on a 1950s vocabulary test, when in reality, many words from the 1950s may have peaked in the 1970s and are even more obscure in the 1990s than they were in the 1950s.
An ambitious study
Given the Kaufman effect, the statistical artifact, and changing content, I realized the only way to truly understand the Flynn effect is to take the oldest quality IQ test I could find and replicate its original norming on a modern sample.
In 2008 I made it my mission to replicate Wechsler’s 1935-1938 norming of the very first Wechsler scale. Ideally I should have flown to New York where Wechsler had normed his original scale, but if Wechsler could use white New Yorkers as representative of all of white America (WWI IQ tests showed white New Yorkers matched the national white average), I could use white Ontarians as representative of all of white North America (indeed white Americans and white Canadians have virtually the same IQs). The target age group was 20-34 because this was the reference age group Wechsler had used to norm his subtests.
It took over a decade but I was gradually able to arrange for 15 randomly selected white young adults to take the one hour test. They were non-staff recruited from about half a dozen fast food locations in lower to upper middle class urban and suburban Ontario. The final sample was not perfectly representative of white North America (they were a bit less educated and much less female) and testing conditions were not optimum (environments were sometimes noisy, at least one person had a few beers before testing; another was literally falling asleep during the test) and 15 people is way to small a sample to draw statistically significant conclusions about 11 different subtests. One man with a conspicuously low score was removed from the sample because he had suffered a stroke.
Nonetheless, the below table shows how whites tested in 2008 to 2019 compared to Wechsler’s 1935-1938 sample, with the last column showing the expected scores of the 21st century sample, extrapolating gains James Flynn calculated from 1953.5 to 2006 (see page 240 of his book Are We Getting SMARTER?) to the current study: circa 1937 to circa 2013.5.
Note: the 11 subtests were scaled to have a mean of 10 and an SD of 3 in the original young adult norming sample, while the verbal, performance and full-scale IQs were scaled to have a mean of 100 and an SD of 15. Note also that vocabulary is alternate test, not used to calculate either verbal or full-scale IQ on the WBI. One third of my sample did not take Digit Symbol so for these, Performance and full-scale IQs were calculated via prorating.
Test:
Nationally representative sample of young white adults (NY, 1935 to 1938)
Randomish sample of young white adults (2008 to 2019, ON, Canada)
Expected WBI scores in 2008-2019 based on Flynn’s calculated rate of increase
Information (general knowledge test)
10 (SD 3)
8.07 ( SD 2.6)
12.3
Similarites (verbal abstract reasoning)
10 (SD 3)
12.93 (SD 2.94)
15.54
Arithmetic (mental math)
10 (SD 3)
7.2 (SD 3.78)
(this subtest contained a unit conversion item that seemed biased against Canadians)
11.02
Vocabulary
10 (SD 3)
8.73 (SD 2.6)
14.95
Comprehension (Common sense & social judgement)
10 (SD 3)
9.33 (SD 3.2)
13.93
Digit Span (attention & rote memory)
10 (SD 3)
9.47 (SD 2.23)
11.46
Picture Completion (visual alertness)
10 (SD 3)
10.47 (SD 3.16)
14.52
Picture Arrangement (social interpretation)
10 (SD 3)
9.8 (SD 2.54)
13.35
Block Design (spatial organization)
10 (SD 3)
12.53 (SD 3.07)
12.91
Object Assembly (spatial integration)
10 (SD 3)
11.47 (SD 1.77)
14.06
Digit Symbol (Rapid eye-hand coordination)
10 (SD 3)
10.8 (SD 2.82)
(note: only 10 of the 15 subjects took this subtest)
14.66
Verbal IQ
100 (SD 15)
99.8 (SD 14.46)
Performance IQ
100 (SD 15)
106.47 (SD 12.11)
Full-scale IQ
100 (SD 15)
103.4 (SD 13.63)
122
Conclusion
The Flynn effect is dramatically smaller than we’ve been led to believe, at least on tests of specific information that may become obscure over generations. By contrast certain verbal skills (categorizing) and spatial analysis have indeed increased by amounts comparable with Flynn’s research. It’s unclear if these are nutritional gains caused by increasing brain size, neuroplastic gains caused by cultural stimulation, or mere teaching to the test caused by schooling, computers and brain games.
HBO has already given us the best TV show of all time (six feet under) and the best documentary of all time (Leaving Neverland) and now it strikes again with one of the best teen dramas of all time (Euphoria),.
Teen dramas have really changed a lot since I watched Dawson’s Creek in high school. This is much edgier, much more diverse, and much darker. Unlike the lilly white wholesome Dawson of my generation, the main character on this show Rue, is like a female Melo (see the comment section), a mixed race bad-ass who has sex with whites, dances to rap, and is not afraid to play hardball. She looks like she may have been cast by the show’s executive producer Drake.
Rue’s white drug dealer is very protective of Rue and thinks of her as his baby sister. So when the tall popular white jock blackmails Rue’s best friend, the drug dealer is having none of it. Even though the jock laughs in the drug dealer’s face and calls him “half-a-retard”, you can tell he’s spooked.
We’re so used to seeing the tall popular jock get his way by beating and blackmailing others, that to see this “half-a-retard” threaten him had me cheering from the couch.
Obviously dialogue on these shows is not meant to be over-analyzed or taken too literally, but what exactly is “half-a-retard”? I interpret it as someone who is roughly half way between average (IQ 100) and “retarded” (IQ below 70) intelligence, or someone who would score below 70 on only half the Wechsler scale (i.e. either the verbal half or the non-verbal half, but not both).
You might say the drug-dealer’s IQ is impaired by drugs and not genetically low, but because those with low genetic ability are more likely to end up on drugs, they serve to exaggerate cognitive inequality, while maintaining the genetic rank order. IQ after all is not an absolute score, but a ranking of where one stands compared to others of his generation and as we become adults, the absolute difference between ranks widens while inter-rank mobility remains limited.
[This article is sponsored by proscootersmart.com. Check out the unbiased reviews of skateboards, scooters, and much more.]
Few sports embody what Howard Gardener called bodily-kinesthetic intelligence quite like skateboarding, where champions seem to defy the laws of gravity. But how smart are the best skateboarders in the conventional sense? How would they score on an actual IQ test?
Skateboarders have never been accused of being the smartest people in the room. They are creative, artistic, and resourceful, but most are high school or home school drop-outs incapable of basic reading comprehension.
Average IQ of the 10 best skaters
While your average skater may have only average intelligence, those who dominate the sport might be quite a bit smarter. The following video ranks the ten best skaters:
Even though skateboarding is a physical skill, it requires far more coordination than most sports, which means the brain is highly involved.
Since the best skaters must be young enough to be physically active, but old enough to have decades of practice, the majority of the most skilled are from Generation X (the 84 million Americans born from the early 1960s to the early 1980s). About 1.7% of U.S. youth are core skaters (defined as people who’ve skated 52+ times per year). Assuming this was the case when generation X was young, roughly 1.4 million Gen Xers were core skaters.
Thus, ranking among the ten best skaters in America is roughly a one in 140,000 level achievement, and the median top ten skater would be at the one in 280,000 level (or roughly 4.5 standard deviations above the mean). And because performance correlates about 0.82 with talent, the top ten skaters likely average 0.82(4.5) = 3.69 standard deviations above average in raw physical coordination. And since physical coordination correlates 0.35 with IQ, they likely average 0.35(3.69) = 1.29 standard deviations above average in IQ.
In other words the 10 best skaters in America likely average an IQ of about 120 (smarter than 90% of Americans their age), however the Gaussian curve predicts that in a group of 10 people, the dullest is roughly 20 points below the group’s average and the brightest is roughly 20 points above, and so America’s 10 best skaters likely range from around a normal IQ of 100 to a genius IQ of 140.
As a child, he used Erector sets to build a complete control center for his room, which used pulleys and strings to allow him to turn on the lights and open the door from the upper bunk of his bed.
High IQ may run in his family: His mother “graduated high school at age 14 and then earned a degree in physics, while also being an accomplished pianist.”
It’s interesting to note that the #1 skater on this list (Tony Hawk) actually took a professionally administered IQ test and scored an incredible 144! Described by the psychologist as a twelve-year-old’s mind in an eight-year-old’s body, Hawk would grow up to build a $140 million empire.
It’s sometimes claimed that high IQ people only get rich because IQ predicts education and it’s the latter that’s rewarded by the market, but Hawk has little formal education and started getting rich while still in high school. He’s an example of a high functioning braining causing money directly, first by having the neurological ability to master a lucrative sport, and secondly, having the mental ability to parlay that talent into a huge brand.
Starting an online business
Of course we can’t all be the next Tony Hawk no matter how high your IQ might be, but that doesn’t mean we can’t make some money off skateboards, or whatever your passion may be. Who would have guessed that a small web site likeproscootersmart.com made a few thousand dollars last year and expects to double that this year.
“I was shopping for a scooter for my son and noticed that a lot of the sites were affiliate sites so I wanted to get in the game,” the owner explained.
“I’ve actually tried many of the products myself because I want to give unbiased reviews of them. Hover boards are the hardest product to ride because everyone wants to ride one but don’t automatically get the concept of how it works.”
For those who want to learn from his business model and start their own affiliate site, his advice is to just jump in because you’ll “never learn unless you try it.” He also notes that education can be overrated since the internet can teach you anything. He advises not giving up because your luck can change, just when you think something’s a lost cause.
As the super high IQ Marilyn Vos Savant once said, failure tends to be a temporary condition. Giving up is what makes it permanent.
It’s common knowledge in psychometrics that U.S. whites average about one standard deviation (15 IQ points) higher than U.S. blacks and have done so since the first mass tests were administered in WWI.
But could the gap extend much further in space and time? Tens of thousands of years further.
At first it sounds absurd: there were no IQ tests 15,000 years ago, and there weren’t any white people. The earliest Europeans had dark skin, and they were largely replaced by Middle Easterners spreading agriculture.
Archaic European
Nonetheless, there were people living in Europe 15,000 years ago and to the degree they resemble today’s Europeans (phenotypically and genetically) they’re a proxy for archaic whites.
Similarly, the oldest lineage in Africa are Bushmen, and to the degree they resemble modern Africans, they’re a proxy for archaic blacks.
The archaic whites left the following rock art over 15,000 years ago.
IQ 74 (1963 US norms)IQ 144 (1963 U.S. norms)
The archaic blacks left the following rock art, perhaps much more recently.
IQ 74 (1963 U.S. norms)IQ 118 (1963 U.S. norms)
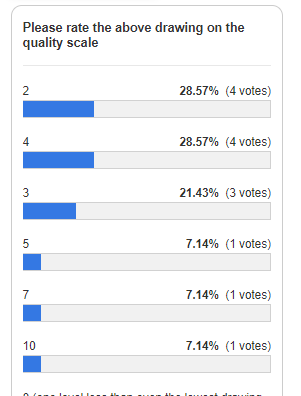
When I asked readers to rate the two archaic white paintings using the quality scale of the Dale-Harris Draw-A-Man test, the median votes were 3 and 11, giving the archaic whites a mean score of 7.
votes for the first European paintingvotes for the second European painting
For archaic blacks, the median votes were 3 and 8, giving archaic blacks a mean score of 5.5.
votes for the first African painting
votes for the second African painting
That’s a difference of 1.5 points. Since the standard deviation for incipient adults (age 15) on the Goodenough-Harris quality scale is 1.7, archaic whites over 15 thousand years ago were already nearly one standard deviation (15 IQ points) higher than archaic blacks living later.
From Children’s Drawings as Measures of Intellectual Maturity by Dale B. Harris
Of course with such a tiny sample size, this conclusion is EXTREMELY tentative and requires far more research.
It is most ironic that the Draw a Man test was invented by a woman and that girls outscore boys, but in the 1920s, women were devalued. The great Florence Goodenough realized that as children got older, their drawings became more sophisticated and thus could be used as a proxy for mental age. Goodenough’s test was not a good measure of IQ, but at times it was good enough (get it?).
When the test was revised in 1962 by Dale Harris, not only did he add a “Draw a Woman” subtest, but he added a quality scale so that rather than spending half an hour going through a long checklist of dozens of different criteria, psychologists could just compare a drawing they were scoring to a progression of drawings ranked from level 1 (crude stick figure) to level 12 (a detailed sketch) and judge which level it most resembled. This may sound subjective, but different judges gave very similar scores (though today machine learning could probably improve objectivity).
What I love about the quality scale is that when they were making it, they instructed the judges to divide all the drawings they reviewed into 12 separate piles such that difference in quality between each pile was equal. This makes the raw scores a true interval scale, unlike most tests which are only ordinal scales.
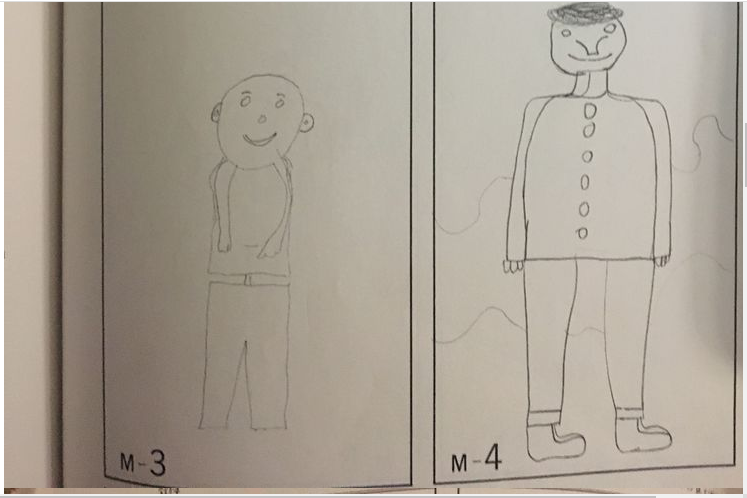
Please study the progression of drawings from 1 to 12, and notice how as you move up the scale, you get a gradual and consistent improvement in accuracy, detail and proportion (with no sudden jumps in quality). Based on the linear progression, try to imagine a drawing that would merit a level 13 or 14 etc if the scale extended that high:
Now please compare the below drawings which I’ll be discussing in future articles to the quality scale and vote on where they should rank. Please vote before wondering who drew them or reading the comments since that could bias your judgement. Please be as objective as possible. Consider the level of maturity of each drawing (using the above quality scale as a guide), not whether you like or dislike it.
Although all drawings should be of men, in some cases artists took certain liberties (i.e. head of a bird etc). In such cases use your best judgement to decide what score the drawing merits.
I could have scored these myself but it seems more objective and scientific to rely on the wisdom of crowds:
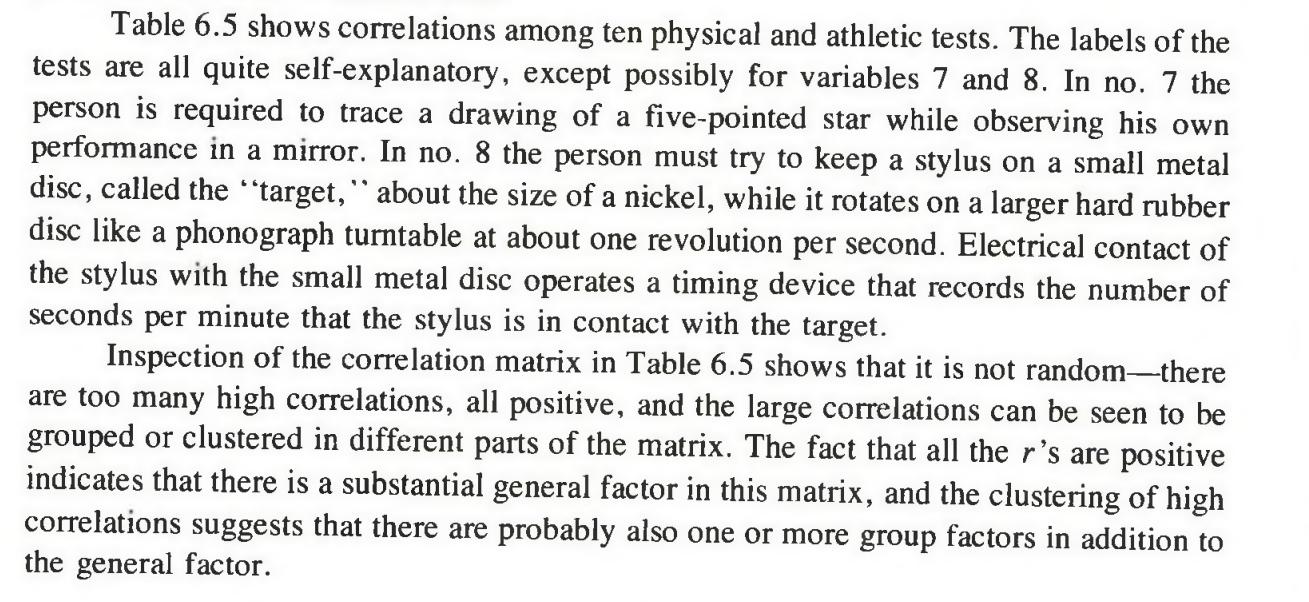
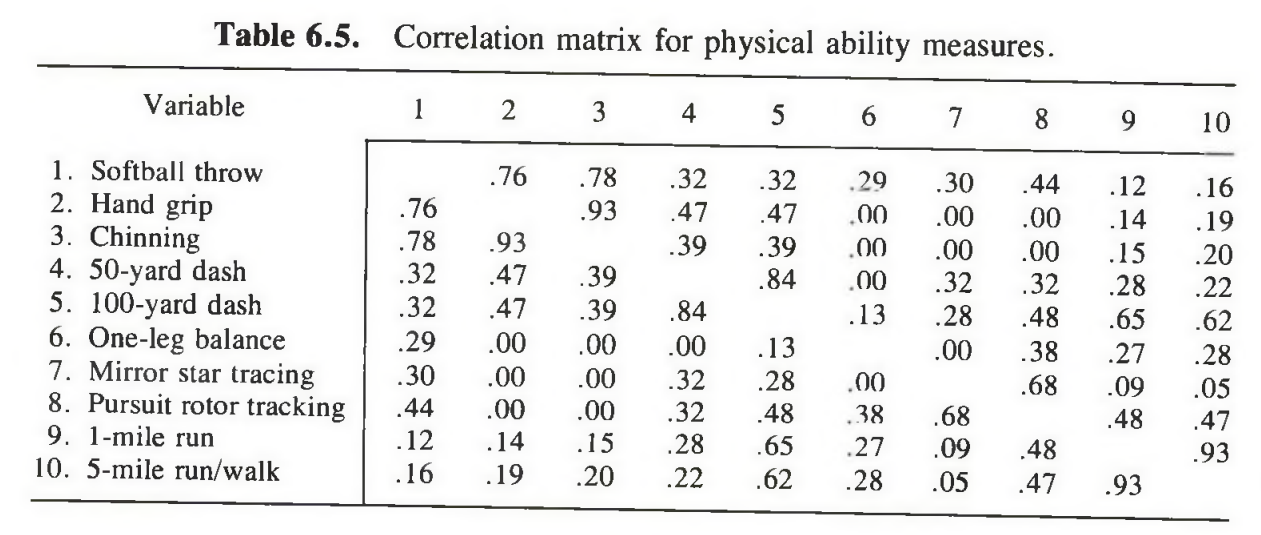
On page 206 of Bias in Mental Testing, Arthur Jensen writes:
Not sure why Jensen considers all these correlations positive, unless zero is a positive number (I consider it neutral).
And I’m not sure why some commenters think weight lifting requires coordination when the correlation between strength (hand grip, chinning) and coordination (Pursuit rotor tacking, Mirror star tracing) is zero.
But maybe these are not the best measures of strength or coordination (mirror star tracing sounds more like a cognitive test than a physical one), but when I lift weights, I don’t feel like I’m using coordination. To me coordination is best measured by very fast paced tasks that require moving multiple body parts with exquisite timing.
Physical coordination probably correlates more with IQ than does any other physical ability. Daniel Seligman writes:
Contrary to certain stereotypes about athletes and intellectuals, physical coordination is positively correlated with IQ. Technical studies by the U.S. department of Labor report a 0.35 correlation between coordination and cognitive ability.
0.35 is very similar to the correlation between IQ and brain size; so there are at least two physical traits (brain size and coordination) that correlate moderately with IQ.
Some might argue that physical coordination is a part of intelligence since it’s largely a brain function. I define intelligence as the ability to use whatever physical traits one has as a tool to exploit whatever environment one’s in. I see coordination as one of those physical traits used as a tool by intelligence rather than part of intelligence itself, but it’s a meta-tool in that it controls the body which in turn controls the external environment.
The problem with including physical coordination in our definition of intelligence is that intelligence is only important because it’s what separates man from beast, and physical coordination fails to do that. Even if it were possible to put a man’s brain in a cheetah’s body, he would not be able to exploit the environment because his brain’s not evolved to control the cheetah’s body. But if a man’s brain could control what the cheetah did with its motor control, only then would the cheetah display the goal directed adaptive behavior we know as intelligence.
It’s like the Master Blaster character in Mad Max: Beyond Thunderdome. If Master’s brain was literally put in Blaster’s body, he might not have the coordination to win so many fights, but by telling Blaster how to use his coordination, he has given him his mind.
Feelings control intelligence
Intelligence is often defined as the mental ability to problem solve, but something is only a problem if it’s bothering us (i.e. cause us to feel pain or discomfort). Hence, feelings define the problems we use our intelligence to solve.
Intelligence controls physical coordination
Once our intelligence decides what behavior will solve a problem most efficiently, our physical coordination must direct our muscle movements accordingly. One could argue coordination itself is a mental ability and thus part of intelligence however by definition, abilities are only mental if they don’t cluster with sensory or motor functions, and physical coordination clusters with the latter. Even though coordination is part of the brain, it’s not fully part of the mind. It’s more neurological than mental per se.
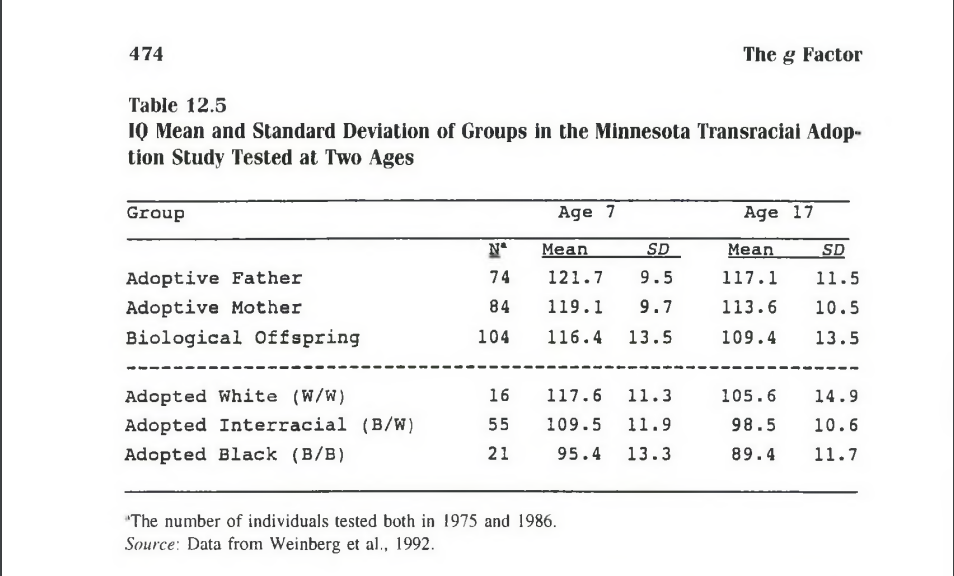
In the Minnesota Transracial Adoption study, white babies, black babies, and mixed babies (biological father black; biological mother white) were adopted into white upper middle-class homes when they were 19 months, 32 months, and nine months respectively. The purpose of the study was to determine how much of the 15 point black-white IQ gap in the United States is genetic.
In 1975, the children and adoptive parents were IQ tested on at least an abbreviated versions of the Stanford Binet/WISC/WAIS (depending on age), and then retested in 1986 on the WISC-R/WAIS-R depending on age. Here are the results:
Source: page 474 of The g Factor by Arthur Jensen
Because the norms on all the tests were out-dated at the time of testing (especially in 1975), John Loehlin attempted to correct all scores for the Flynn effect.
But many people ignore the IQs themselves, and instead just focus on the IQ differences. They see that at age 17, adopted whites scored 7.1 points higher than adopted mixeds in the unadjusted data, and 16.2 points higher than the adopted blacks, and conclude that the 15 point black-white IQ gap in the United States is roughly 100% genetic.
One problem with this is that black babies were adopted later than the non-black babies. Another problem is they were born to black mothers, while the non-black babies were all born to white mothers, so the prenatal and perinatal environments may have been quite unequal.
Thus I have always been more intrigued by the 7.1 IQ gap between the adopted whites and adopted mixeds. Since the adopted mixeds presumably had only half as much black ancestry as the typical U.S. black, it’s interesting that there’s roughly half the infamous 15 point black-white IQ gap, despite being gestated in white wombs and raised in white homes. Does this point to the importance of genetics?
Physicist Drew Thomas argues that the comparison between the adopted whites and adopted blacks is misleading because in the tables posted above, at both ages we only see data for the adopted kids who remained in the study for the follow-up testing in 1986. He argues that several low IQ adopted white kids dropped out of the study, and had they remained, the IQ gap between the adopted whites and adopted mixeds would have perhaps been only 3.5 points at age 17.
However this argument is starting to feel a little post-hoc. When you do a study, your data is what it is. You can’t adjust it for what it would have been had people you wished remained in the study. Almost any study can be debunked if we imagine how it would have turned out in a parallel universe where different people took part.
That’s not to deny that adjusting for attrition can be important in some cases, but in this study, Thomas argues attrition only increased the IQs of adopted whites and not the adopted non-whites. An effect that only affected one demographic sounds to me like random error, not a systematic bias that needs to be adjusted for. And if the error was random, one could just as easily argue the IQs of adopted whites were too low before the attrition rather than too high after the attrition.
Indeed if the adopted white sample is so easily skewed by a few kids dropping out of the study, then maybe that sample is too small to begin with, and instead we should compare the much larger sample of adopted mixeds not to the adopted whites, but to the general U.S. white population.
At an average age of 17, the adopted mixeds took the WISC-R and WAIS-R depending on age, and averaged 98.5 (93.5 after adjustments for the Flynn effect, since WISC-R and WAIS-R norms were 14 and 8 years old respectively at the time of testing).
However some top-secret research I’ve been slowly doing over the past decade suggests the Flynn effect has been wildly exaggerated, so while I don’t think their average IQ was as high as 98.5, I also doubt it was as low as the Flynn corrections say. Let’s split the difference and say 96 (U.S. norms).
By contrast, the whites in the WISC-R and WAIS-R standardization samples averaged 102.2 (standard deviation (SD) = 14.08) and 101.4 (SD = 14.65) respectively. Let’s split the difference and say 101.8 (SD = 14.4).
Thus converting to the more traditional scale where the U.S. white mean and SD are set at 100 and 15 respectively, the adopted mixed mean of 96 becomes ((96 – 101.8)/14.4)(15) + 100 = 94.
In other words, despite being gestated in white wombs and raised in upper-middle class white homes, having just one U.S. black biological parent appears to have reduced IQ by 6 points, suggesting that having two U.S black biological parents would reduce IQ by 12 points, suggesting that 80% of the 15 point black-white IQ gap in the U.S. is genetic. 80% squared is 0.64 which is similar to the 0.69 heritability of the WAIS full-scale IQ found in Thomas Bouchard’s study of identical twins reared apart, consistent with Jensen’s default hypothesis which claimed that IQ gaps between U.S. races are caused by the same nature-nurture mix that occurs within them.
To paraphrase President Obama, there is no black America or white America; from a nature-nurture perspective, there’s just America.
While this analysis seems to have controlled for the prenatal and family environment, it’ does not control for peer groups. Maybe as mixed kids raised in white homes, they were unmotivated on IQ tests because of the racist stereotype that being smart = acting white. On the other hand, they did better on scholastic tests than they did on formal IQ tests, suggesting motivation was not a problem.
If the genetic part of the U.S. black-white IQ gap is indeed 12 points and black Americans are only about 74% black on average it implies that 100% West African ancestry would reduce IQ by 16 points below the U.S. white mean (at least if we assume U.S. black ancestry is representative of West African ancestry).
And at least if we assume the Phenotype = Genotype + Environment model
Some readers invoke a reaction norm model where genotype A is higher IQ than genotype B in environment A, but lower than genotype B in environment B. Assuming such norm crossing occurs with IQ, my sense is that it would be limited to individual cases and cancel out in group level comparisons like the black-white IQ gap.
Some might argue that it’s inappropriate to compare adopted mixeds to the general U.S. white population because adopted mixeds might not be genetically representative of their parent populations. In The g Factor, Jensen states that the parents of the mixeds averaged 12.5 years of schooling (page 473) while just the mothers averaged 12.4 (page 478). From here we can deduce that the fathers averaged 12.6.
In 1975 America, white women and non-white men age 25+ had a median of 12.3 and 11.3 years of schooling respectively (see table 4 of this document). Comparable figures in 1986 were 12.6 and 12.5. So using education as a proxy, there’s no reason to think the mixed kids were selected to have lower IQs than the mean of their parent races. If anything, their biological fathers averaged more education than age 25+ non-white men throughout the full duration of the study and their biological mothers averaged about the same education as age 25+ white women.
Of course it would help to know the exact ages of the parents, rather than just lumping them in with everyone over 25. I can’t find the age of the biological parents of the mixeds specifically, but the bio moms and dads of all the kids who took part in at least part of the study (see table 3 of this paper) averaged 21.6 and 26.3 at the time the kids were born, and thus were about 29 and 33 in 1975 and about 39 and 43 in 1986, thus they were likely near the median age of the 25+ cohort by the end of the study.
Although this study shows the black-white IQ gap is highly genetic, several similar studies beg to differ. Tizard (1974) compared black, white and mixed-race kids raised in English residential nurseries and found that the only significant IQ difference favored the non-white kids. A problem with this study is that the children were extremely young (below age 5) and ethnic differences in maturation rates favor black kids. A bigger problem with this study is that the parents of the black kids appeared to be immigrants (African or West Indian) and immigrants are often hyper-selected for IQ (see Indian Americans).
A second study by Eyferth (1961) found that the biological illegitimate children of white German women had a mean IQ of 97.2 if the biological father was was a white soldier and 96.5 if the biological father was a black soldier (a trivial difference). Both the white and mixed kids were raised by their biological white mothers. One problem with this study is that the biological fathers of both races would have been screened to have similar IQ’s because at the time, only the highest scoring 97% of whites and highest scoring 70% of blacks passed the Army General Classification Test and were allowed to be U.S. soldiers. In addition, 20% to 25% of the “black fathers” were not African-American or even black Africans, but rather French North Africans (non-white caucasoids or “dark whites” as they are sometimes called). In addition, there was no follow-up to measure the adult IQ of the children.
A third study by Moore (1986) included a section where he looked at sub-samples of children adopted by white parents. He found that nine adopted kids with two black biological parents averaged 2 IQ points higher than 14 adopted kids with only one biological black parent but the sample size was quite small, I don’t know anything about the bio-parents and again, no followup when the kids were older.


