As I was driving home from work tonight I managed to listen to a really great episode of Ideas on CBC radio. The show talked about how a study claiming psychic powers were real managed to get published in a reputable psychology journal because the results were statistically significant at the 95% confidence level.
This led to a crisis in the field and the realization that we can’t be 95% confident in the 95% confidence level because scientists cherry pick which way they’re going to analyze the data, so that 95% is a biased sample of what they’re trying to measure (a phenomenon known as p-hacking). Kind of reminds me of how people only report their highest ever score when telling their IQ.
It turns out that only about one third to one half of all psychological claims proven at the 95% confidence level can be replicated by independent researchers. In other words, there’s regression to the mean.
And it’s not just psychology but almost the entire field of science is afflicted by this replication crisis.
The following video is only 3 seconds long but utterly terrifying. It contains no violence, no dialogue, no gore and no blood. Simply a middle aged suburban man opening a refrigerator and smiling.
What’s so scary about that you might ask? Well imagine if that were your father, or your husband, or your son…
You’re sleeping underneath your covers in the middle of the night and he decides to go down to the kitchen to make a sandwich. But upon opening the fridge he suddenly smiles. Something in his declining middle aged brain has snapped. Is it early onset Alzheimer’s? A mid-life crisis? Demonic possession? Whatever it is, you’re no longer safe in that house.
This clip is from a new TV series called Evil. The show itself is not worth watching, but that commercial made my skin crawl. If I had seen it as a child I would not have been able to sleep for weeks.
I’ve been a horror fans since childhood and despite my love for the genre, I never found them all that scary. Often what scared me the most were the things that weren’t meant to be scary, like a commercial they used to run about Parkinson’s disease in which a middle aged suburban man with Parkinson’s could complete a jig-saw puzzle because his hand kept shaking until finally his young son holds his hand down so it can fit the pieces together. It was a metaphor for hope, but in my pre-school mind it was horrific.
Every night I would have vivid images of the parkison man wheeling himself out of my bedroom closet and shaking, shaking, shaking as he wheeled his way closer to me.
Perhaps my most traumatic experience came during a trip to Alberta to visit relatives. That day my father and/or my uncle mysteriously had his/their camera(s) stolen from the front of my uncle’s house in broad daylight. Well that’s odd, they though. Stuff like that just doesn’t happen in suburbia.
That night I was sleeping in an unfamiliar room and could have sworn I saw a woman standing in the closet. An older woman with red hair, who looked a lot like this.
She was smiling, as if to say “it was me, silly! I stole the camera(s)”.
I suddenly started screaming waking up the entire house, who raced to the room to see what the matter was.
“You just had a bad dream,” they told me.
But it seemed so real, and I spent a big chunk of my childhood being terrified of my bedroom closet.
In the spirit of Halloween, I re-watched this movie a couple weekends ago. Neither Netflix, the Movie network, nor pay per view have enough selection for me, so I added Amazon Prime to boot and this film was prominently displayed in their horror section.
It’s a disturbing, well organized film based on real life serial killers Henry Lee Lucas and Otis Toole.
Psychiatrists reportedly found Toole to be be schizophrenic, psychopathic, and mentally retarded with IQ scores ranging from 54 (Trainable [moderate] Retardation) to 75 (Borderline Retardation). It’s hard to assign a single number, but assuming the lowest and highest score were from tests that correlate around 0.7, a composite IQ of 61 is implied (Educable [mild] Retardation).
Actually it’s likely his IQs was even lower because in those days people didn’t know about the Flynn effect inflating the scores of people tested using old norms.
Toole’s low IQ seems to be part of a larger pattern of neurological impairment. He was also epileptic and sexually aroused by fire and from his mug shot it seems he had asymmetrical features, suggesting genetic mutations or developmental insults..
Toole’s art therapist Dr. Joel Norris described Toole as “the lower end of the gene pool”. The genetic garbage of society. Indeed in the film his body is literally stuffed into a garbage bag.
Of course HBD deniers could argue his problems were cultural, not biological. Raised by a mother who dressed him up as a girl, a sister and male neighbor who raped him, and a grave robbing granny, the illiterate Toole drops out of school to become a prostitute and part-time transvestite. Toole’s horrific backstory is not shown in the film.
Toole would become close friends with Henry Lee Lucas, whose mother also made him wear a dress as a kid. With a much higher IQ of 87, Lucas is widely believed to have been the leader of their murder spree.
While the film never mentions IQ it does imply Lucas is the smarter of the two, warning Toole not to kill people he’s been seen with.
Although Lucas towers over Toole intellectually, both men are morons compared to a quick-witted overweight TV salesman who belittles them with biting sarcasm. Luckily the sarcasm flies above their heads, but when the high IQ salesman pushes his luck, he proves too clever by half.
With Halloween only a few days away, I though I’d share this scene from Rob Zombie’s Halloween.
Many people hated Zombie’s 2007 remake of the 1978 classic because it turned Michael Myers from a middle class kid to white trash. They also felt Zombie’s dialogue was gratuitously disgusting, however this is how Zombie remembers kids talking when he was growing up.
One of the first things we notice is that young Myers has a low social IQ (or at least low impulse control). Rather than laughing off his bullies’ taunts, he descends into rage, the exact reaction his bullies were hoping for.
More importantly, Myers says “F@*CK YOU” to the school principal. This is where Myers crosses the line from normal bad behavior (getting into fights at school) to pathological, clinical, and diagnostically significant. Even the principal is nonplussed because such behavior is so outside the norm. Clearly Myers is the most deranged kid he has ever seen in say 30 years working in schools. Telling the principal to “F@*CK YOU” is such a violation of social norms that it implies he’s dealing with a psychopath.
Lastly, we see how the correlation between genes and environment increases with age. Because of Myers’s bad behavior, he goes from having a lower class social environment to being locked in a mental hospital room to rot. His genetically low IQ and low impulse control cause him to make rash decisions which quickly drag his environment down to his genetic level.
For years commenter Mug of Pee has been saying that HBDers naively assume the Phenotype = Genotype + Environment model.
A good example of this model is sex and height. For example in 1914, the average Canadian man was 5’7″ and the average Canadian woman was 5’2″. Then after 100 years of modern nutrition and health, the average Canadian man is 5’10” and the average Canadian woman is 5’4″.
So even though environment added a few inches of height to both sexes, it did not change the male > female rank order and if expressed in SD units, may not have even changed the gap. The P = G + E model sees environment as a rising tide that lifts all boats but doesn’t change their relative heights. No matter what the environment, having a Y chromosome predicts greater height, while no matter what the genome, 20th century nutrition predicts greater height. In other words, both the genetic effect and the environmental effect are independent of one another and thus can be added together.
By contrast the reaction norm model sees environmental effects as lifting only some boats, while at the same time sinking others. So rather than adding environmental effects to genetic effects, you either add or subtract depending on which environmental effect combines with genomic effect.
While I thought this model was interesting, I couldn’t think of many real world examples.
Then one night I was watching the The evolution of us, a two part documentary on both netflix and amazon prime, which features such luminaries as John Hawkings, Steve Hsu, and Daniel Lieberman. The documentary briefly discussed the Tarahumara.
In their native Copper Canyon environment, the Tarahumara are extremely fit and slim and can outrun white athletes who come and visit, yet when they move to urban areas, they appear to be several standard deviations fatter than white people..
It’s not surprising that the Tarahumara are fatter in an urban environment than in a pre-industrial one (that’s true of all populations). But the fact that they are so disproportionately penalized by an urban environment might be an example of reaction norms.
Of course I know of no evidence of the cognitive equivalent of the Tarahumara: a group that scores as high or higher than whites in one environment, yet scores lower in another.
Commenter RR argues that IQ tests measure social class. If by social class he means the home one grew up in, the following author begs to differ:
First, family has little effect on whatever cognitive abilities you have after the age of 17. While family environment is potent early on, its effects fade away to low level by age 17 and become insignificant by maturity. As you grow up, you move outside the family and go to school, become a member of a peer group (your close friends), find a job, and marry. You enter a current environment that swamps the lingering effects of family environment. Current environment is surprisingly self-contained: it influences one’s current cognitive abilities with very little interference from past environments. Most of us assume that your early family environment leaves some indelible mark on your intelligence throughout life. But the literature shows this simply isn’t so.
Second, once the influence of family disappears, the cognitive quality of your current environment tends to match your genetic quality. This is often called the tendency toward “gene-environment co-relation”. This means simply that if your genes are at the 90th percentile for cognitive ability, your current environment tends to be at the 90th percentile of the population for cognitive quality…In other words, chance events aide, genes and current environment tend to match, so whatever genetic differences exist predict cognitive performance without any need to take current environment into account.
You might think the above was written by Arthur Jensen, but it was written by Jensen’s most formidable opponent, James Flynn. It’s from pages 5 to 6 of Flynn’s book Does Your Family Make You Smarter?
Evidence in support of Flynn’s comments is a 2010 study by Haworth et al, where an astonishing 11000 pairs of twins from four different countries were intelligence tested. The results: heritability was 41% at age nine, 55% at age 12, and 66% by age 17.
66% is very similar to the WAIS IQ heritability found in the Minnesota study of twins reared apart, but Haworth et al compared the IQ correlation of MZ twins raised together with the correlation of DZ twins raised together (the classical twin study). If one assumes that both types of twins are equally similar in their environments (including prenatal), the greater IQ similarity found among MZ twins can only be explained by their greater genomic similarity. This is known as the equal environment assumption.
Critics claim that MZ twins raised together enjoy more similar environments than DZ twins raised together and so genes are getting undeserved credit for an environmental effect. However Arthur Jensen notes:
…some same-sex DZ twins look much more alike than others. In some cases their parents even wrongly believe that their DZ twins are identical twins, and they treat them as such by dressing them alike and giving them the same hairstyles and so on. But DZ twins whose parents and others had mistaken them for MZ twins are no more alike in IQ than other DZ twins or ordinary siblings who don’t look much alike.
Source: Intelligence, Race and Genetics by Frank Miele, pg 98
Indeed if people think MZ twins have more similar environments than DZ twins because they look identical, then it follows that same sex DZ twins should have more similar environments than opposite sex DZ twins because they too look more similar (and are treated more similarly) and yet the IQ correlation between same sex and opposite sex MZ twins are virtually identical.
Further support for the equal environment assumption comes from a study of 1,030 female-female twin pairs from the Virginia Twin Registry with known zygosity. About 15% of the twins disagreed with their actual zygosity, however perceived zygosity had no impact on the correlation between twins when it came to any of the five psychiatric disorders studied.
Commenter “Some Guy” had some questions about polygenic scores for me. His questions are in block quotes with my answers directly below each one.
How good do you think polygenic scores will have to get before they start getting used on an individual level? Like within how many SDs of the true IQ/g/educational achievement?
If one’s polygenic score is extreme enough, it doesn’t have to be very accurate at all to give useful information. For example, let’s say you have several embryos to choose from and one has a polygenic education score of +5 SD. Even though such scores only predict 12% of the variance, because +5 SD is so extreme, you can be about 97% confident that embryo will grow up to be more educated than the average person (assuming he or she is raised in a society similar to the one from which the stats were derived).
One problem with polygenic scores is they don’t seem translate well from one culture to another, suggesting they’re more correlative than causal.
The uses I can think of is to identify children with high potential from poor backgrounds, or as an environmentally unbiased entrance “exam” for schools etc.
What I would like to see them be used for is to estimate the IQs of historical Geniuses like Albert Einstein and to estimate the IQs of ancient human populations. For example Richard Klein believes there was a major genetic change in human cognition that occurred about 50 kya that allowed us to suddenly spread from Africa, replace the Neanderthals, colonize the globe and create representational art. If we compared the polygenic scores of humans both before and after the upper Paleolitic revolution, we could test this idea. Similarly Gregory Clark believes rapid genetic evolution in Europe allowed the industrial revolution.
I would also love to see polygenic IQ scores for the Neanderthals, assuming they would be meaningful in a group that culturally and genomically distinct.
What sort of PGS-IQ correlation would result in polygenic scores that are say within 1 SD of the true IQ? I know you often calculate standard errors from correlations, mind sharing the formula/method?
Within 1 SD with degree of certainty? If you mean with 95% certainty, you would need a correlation of 0.85+ which I doubt will ever be achieved. Even the correlation between two different IQ tests is seldom that high.
The method is to square the correlation to get the percentage of the variance explained, and then subtract that value from 1 to see what percentage is left unexplained.
So for example a PGS that correlated 0.85 with IQ explains 72% of the IQ variance, thus leaving 28% unexplained.
The variance is defined as the standard deviation squared, so since the IQ standard deviation is set at 15, the variance is 225, and 28% of 225 is 63.
The square root of 63 is 7.9 which is what the standard deviation would be if everyone had the same PGS. This is also known as the standard error of the estimate. Now in a bell curve, 95% fall within 1.96 of the mean, so multiplying 7.9 by 1.96 tells us that 95% of say the UK, will have IQs within 15.5 points of the PGS prediction.
So if you have a PGS of +2 SD that correlates 0.85 with IQ, your IQ will likely be 0.85(2) = +1.7 or IQ 126, with a 95% confidence interval of 111 to 142. But of course we’re nowhere near seeing a 0.85 correlation.
To get the general public to really trust polygenic scores for IQ, I’d guess the accuracy would have to be within 5 points of the true score. Within 10 points would lead to people who actually differ by 20 points regularly ending up with the same polygenic score. Since 20 points tend to be the difference between leaders and followers, such errors would be highly noticeable.
I think if they achieved a correlation of 0.7 with IQ they’d be considered credible (especially if the predictive power was maintained across oceans and generations). That’s the correlation between different IQ type tests with each-other and these are routinely used to decide issues as important as who gets into an elite college, who gets excluded from the military, who gets diagnosed as disabled or gifted, and who gets sentenced to death by the courts.
By the way, what do you think about this argument against people who consider intelligence entirely environmental: If that really was the case, then disadvantaged people would NEVER be smarter than people with good backgrounds. So why even bother giving people from poor backgrounds a chance? 100% environmentalism leads to un-egalitarian conclusions, and is easily disproven by the existence of smart disadvantage people.
It’s prima facie absurd, but it wouldn’t necessarily lead to the conclusion that we shouldn’t give deprived people a chance. On the contrary it might lead to the conclusion that changing IQ is simply a matter of changing environments.
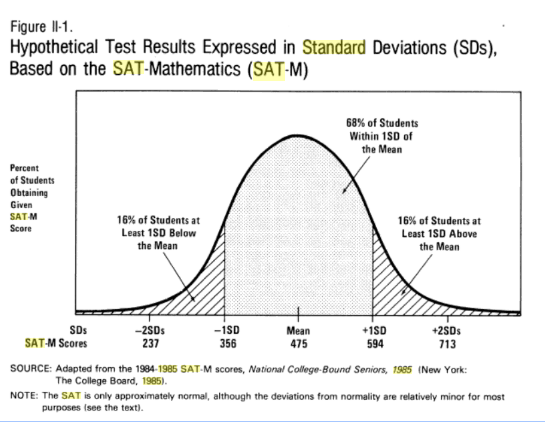
Bill Gates reportedly scored 1590 on the SAT in the early 1970s (Verbal 790 + Math 800). In a rare study done in 1974, it was estimated that if all American teens took the SAT that year (instead of just the college bound elite) , the verbal mean would be 368 (SD 111) and the math would be 402 (SD 112). Assuming a 0.67 correlation between the two subscales, a combined mean of 770 (SD 203.8) is implied.
Thus Gates’s scores equated to a verbal IQ of 157, a math IQ of 153+, and a combined IQ of 160.
However these numbers assume the SAT was normally distributed, and yet empirical data from the 1980s suggests near perfect scores were much more rare than the normal curve predicts and equated to an IQ of about 170 and if anything they were likely even more rare in the 1970s when fewer people studied for the SAT.
Another reason why these numbers likely underestimate Gates’s IQ is that he hit the ceiling on the math section.
Thus I found the following part of a 2001 article in Time magazine of interest:
“In ninth grade,” Gates recalls over dinner one night, “I came up with a new form of rebellion. I hadn’t been getting good grades, but I decided to get all A’s without taking a book home. I didn’t go to math class, because I knew enough and had read ahead, and I placed within the top 10 people in the nation on an aptitude exam. That established my independence and taught me I didn’t need to rebel anymore.” By 10th grade he was teaching computers and writing a program that handled class scheduling, which had a secret function that placed him in classes with the right girls.
According to this source, there were 4,097,000 Americans born the same year Gates was. Some of them would have died before reaching the ninth grade, but these probably would have been made up for by immigrants, so Gates being in the top ten in the nation for his age or grade level, implies he scored in the top one in 409,700. This equates to a math IQ of 168.
In other words, had the SAT had a higher ceiling in the 1970s, he would have perhaps scored 910 (the equivalent of IQ 168). Add this to his verbal score of 790, and we get a combined score of 1700, which would have equated to a combined IQ of about 170. So even if we assume 1970s SAT scores were normally distributed, Gates still clocks in at IQ 170 as long as we extend the ceiling.
Commenter Bruno has expressed considerable skepticism about Gates having an IQ this high, citing the fact that he was not the top math student at Harvard.
My response is that a) standardized test scores should be given more weight than school grades, and b) Gates spent his teens obsessing over computers so math IQ made him the best programmer at Harvard instead of the best math student per se. The title of best math student probably went to an equally smart person who spent their teens obsessing over math.
The video clips are from the fascinating new Netflix series Inside Bill’s Brain.
It seems Gates has really mellowed out in recent decades, or at least become better at hiding his arrogance. In the below clip you can see him berating his employees and making a bizarre head twirling facial expression as if implying the employee is mentally retarded.
Indeed with an IQ of 170, even the average member of America’s political, economic, and cultural elite (IQ 125 to 135) is literally mentally retarded compared to Gates, which helps explain how he was able to leapfrog over the establishment to become the richest man of the 20th century, with such a stranglehold over the market that it took the U.S. justice department to stop his complete domination.
On page 694 of the book The Bell Curve by Richard J. Herrnstein and Charles Murray, they mention that the U.S. average on the verbal SAT during the 1980s if all U.S. 17-year-olds took the test, not just the college-bound elite. This data was arrived at using special studies by the college board, where they recruited a nationally representative sample of teens to take the SAT.
But I wanted to know the standard deviation of the math SAT. I knew over a decade ago, but had since forgotten. I reached out to the author of the study Murray cited, but he no longer had a copy of his own paper.
“Why don’t you ask Charles Murray?” somebody said.
“Charles Murray is the most influential social scientist on the planet. He ain’t gona respond to some nobody blogger” I replied.
“But you’re not just any blogger, you’re Pumpkin Person! Never underestimate the power of that brand” they said citing my lucrative advertising deal with wordpress which has been earning money on top of money.
So I sent off a message to the World’s most influential social scientist, not expecting any reply.
He responded IMMEDIATELY.
“Okay, okay, I’ll see if I can find it” he wrote on February 18, 2019.
Precisely 12 minutes later he wrote:
“Verbal mean 375.8, SD 102. Math mean 411.5, SD 109…”
The most influential social scientists on the planet managed to dig up a paper he hadn’t cited in a quarter century with incredible speed and was kind enough to also take an iphone photograph from one of the pages.
But how do we determine the SD for the combined old SAT? Well since we know the estimated means and SD of the subscales, then the below formula is useful for calculating the composite SD (from page 779 of the book The Bell Curve by Herrnstein and Murray):
r is the correlation between the two tests that make up the composite and σ is the standard deviation of the two tests.
Herrnstein and Murray claim that for the SAT population, the correlation between SAT verbal and SAT math is 0.67. Assuming it would be the same for the general U.S. 17-year-old population, then the 1980s SAT had an SD of 192.8
Some might argue that the 0.67 correlation in the SAT population would underestimate the correlation in the general U.S. 17-year-old population, because the SAT sample is a restricted group and thus should be corrected for range restriction. .
However surprisingly, the math SAT standard deviation for the SAT population was 119 in the 1980s (higher than the 109 in the general population).
Source: Trends in educational achievement By Daniel M. Koretz, United States. Congressional Budget Office
So assuming that if all U.S. 17-year-olds had taken the SAT in the 1980s, the combined mean would be 787.3 with an SD of 192.8, then a near perfect score of 1590 would have equated to +4.16 SD or an IQ equivalent of 162.
However as I wrote back in March 2018:
The above conversions were based on the assumption that the SAT would have a roughly normal distribution in the general U.S. population, which is likely true for 99% of Americans but likely false at the extremes.
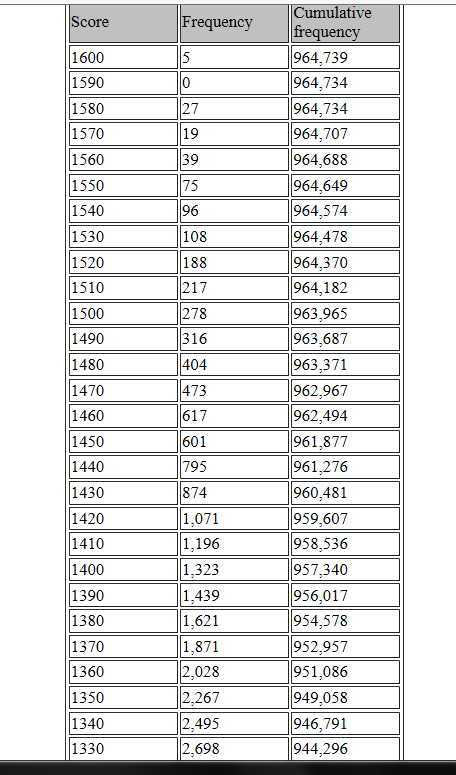
Below is incredibly rare data of the total number of people in 1984 who scored high on the combined SAT.
Table IV
We see that of the 3,521,000 Americans born in 1967, roughly 964,739 would grow up to take the SAT at age 17 in 1984. And of those who did, only 20,443 scored above 1330. If one assumes, as the great Ron Hoeflin does, that virtually all the top SAT talent took the SAT in 1984 (and whatever shortfall was madeup for by foreign students), then those 20,443 were not just the best of the 964,739 who actually took the SAT, but the best of all 3,521,000 Americans their age. This equates to the one in 172 level or IQ 138+ (U.S. norms).
Meanwhile, only five of the 3,521,000 U.S. babies born in 1967 would grow up to score 1590+ on the SAT, so 1590+ is one in 704,200 level, or IQ 170+. However above I claimed that in the mid 1980s, the combined SAT had a mean of 787 and an estimated SD of 220, which means 1590 is “only” +3.65 SD or IQ 155. Clearly the SAT is not normally distributed at the high extreme, so Z scores start to dramatically underestimate normalized Z scores, and modern IQ scales only care about the latter.
Thus, for extremely high SAT scores obtained in the mid 1980s, please use table V and not formula IV:
Table V:
1984 sat
iq equivalent(u.s. norms) based on normalized Z scores(sd 15)