WARNING! THIS ARTICLE CONTAINS SPOILERS

Exactly 40 years ago today, the original Friday the 13th was released (May 9, 1980) and if you haven’t seen it, you need to stop reading, go watch it, and come back.
Friday the 13th (1980) was not the first slasher film (there was Psycho in 1960 and perhaps even earlier ones), but it’s the film that launched the 1980s slasher craze and the iconic Jason. The film was inspired by the incredible success of Halloween and the film makers admit they were deliberately trying to rip that movie off. Indeed Halloween was ripped off so many times it launched its own sub-genre (stalker films). But because Friday the 13th was the first Halloween rip-off, it got to eat all the low hanging fruit Halloween neglected to pick and perfected the stalker film template.
So the first thing you need when ripping off Halloween is your own scary day to set your film on. Since October 31st was already taken, they got the only other scary day on the calendar (Friday the 13th). Later Halloween ripoffs would have to settle for valentines day, graduation day, Christmas, Prom Night, or some some character’s random birthday (Happy Birthday to Me (1981))
The next thing you need when ripping off Halloween is a location where teenagers are isolated. Since Halloween focused on teenagers babysitting in suburbia, Friday the 13th picked counselors at a summer camp and the forest is perhaps even scarier than the suburbs. Again because Friday the 13th was the first Halloween rip-off, it got the prime real estate.
Once you decide to set a slasher film at a summer camp, you need a reason why someone would be killing camp counselors, especially ones who have sex. In Halloween the killer just killed because he was the boogeyman (which made sense since it was Halloween) but what’s a reason why someone would want to kill camp counselors? The most obvious reason is that having sex instead of doing their job caused something terrible to happen? What’s the most obvious terrible thing that can happen at a camp when counselors are distracted? A child drowning. And who would be most upset that a child drowned? The child’s mother. But we need a reason why she’s killing on Friday the 13th because we have to name our film after a scary day to rip-off Halloween. Oh I know, because that’s the child’s birthday, and since it’s a bad luck day, the child drowned.
So see how the entire story just flows organically from the fact that it’s a slasher film set at a summer camp. Unlike other slashers where everything feels so contrived, in this film everything just flows seamlessly because they had the luxury of being the first Halloween rip-off and the first summer camp slasher.
This was the first U.S. slasher to give us real graphic gore.
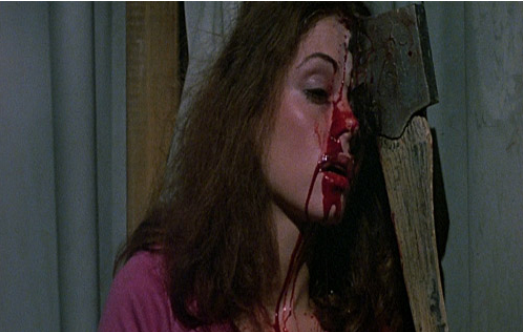

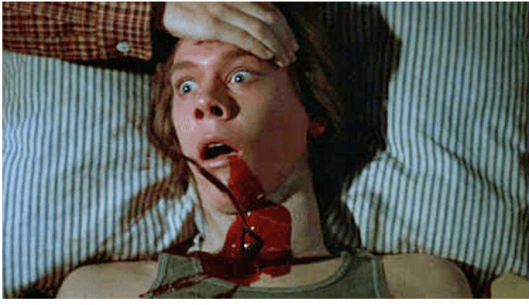
When you see such brutal violence using so many different weapons (axes to the face, arrows stabbing you through your matress from under your bed, machete, knife) and corpses being thrown through windows deep in the woods beneath a full moon and rain storm, you picture the killer as some big hulking man. You picture Jason, the big bald hockey mask wearing brute from the Friday the 13th sequels, but what made the original so brilliantly ironic was that the killer is finally revealed to be all American mom played by the 1950s icon Betsy Palmer.
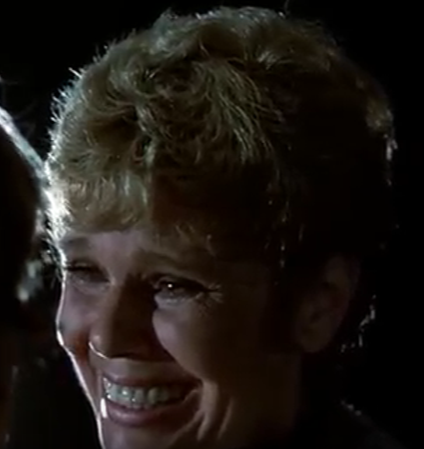
She has the best dialogue in the film, The oh so subtle way she admits her son was mentally retarded without saying it.:
“You see Jason was my son, and today is his birthday” says the killer creepily, explaining both her motive and the film’s title in one brief sentence.
Palmer is incredible in the role. On the one hand she’s the June Clever type mom who had freshly baked chocolate chip cookies for you when you came home from school, the type of woman who would lead the local girl guide troop and thus knew her way around the woods. And yet for all her blonde 1950s aging femininity, she is physically menacing in the part. Wearing multiple sweaters and long johns under her pants to make her character as bulky as possible, the final chase scene is a tour de force. The heroine, Alice, throws a ball of string. The killer punches it away. Alice throws an object too small to see. The killer deflects it with her chin before slapping the hell out of Alice. The two women end up wrestling on the beach until Alice finally prevails in the most dramatic and graphic killing in the entire film. A Shakespearean beheading that put special effects master Tom Savini on the map, decades before CGI made his skills obsolete.
But if all that wasn’t great enough, what makes this the greatest slasher of all time is that one last jump scare that no one saw coming.
Imagine being in the theater in 1980. Viewers would have been jumping out of their seats, their popcorn flying through the air and landing on other viewers.
And yet unlike so many final jump scares, there’s nothing contrived about this. It flows naturally from the story: Alice had just beheaded a mom who was avenging her son’s drowning, so by the logic of horror films, it’s only natural that the child’s drowned corprse would pull her into the lake to avenge mom’s beheading. I love the Shakespearean way it comes full circle.
Of course being pulled into a lake by a child who drowned 23 years ago turns out to just be a dream on Alice’s part. Or was it? The film makers claim they had no intention of a sequel and the final jump scare was all just a dream, but what made the ending so brilliant is we just don’t know. When the film broke box office records, a sequel appeared a year later, and is set just a couple months after the events of the first film.
What makes the start of part 2 so creepy is that Jason has apparently followed Alice from the lake at the camp, to her home in the suburbs but instead of being the drowned child she “dreamed” pulled her into the lake a couple months ago, he’s a big grownass man.

So if Alice had merely dreamed Jason had returned to attack her, why did her dream come true a few months later? But if her dream was true, why was he a child in the dream and a grown man a few months later? Was he a flesh and blood ghost that had catch-up growth to makeup for the 23 years he had been dead a la Toni Morrison’s Beloved, or had he never really drowned at all, but survived in the woods for those 23 years?
I prefer the latter interpretation: Being attacked by a child’s drowned corpse was just a premonition that Jason would indeed return to attack her for killing his mom, but in reality he was a grown man, not a drowned child’s corpse, because he had actually survived. It’s also possible that Jason may indeed have pulled her into the lake, but perhaps she thought she was being pulled in by a child’s corpse (and not a grown man) since she’s thought Jason drowned as a child.
But I love how the series has two interpretations: A supernatural one for the lower IQ and more schizophrenic fans, and a realistic one for the higher IQ and more autistic fans. By part 6 Jason is indisputably undead (they literally dig up his grave and open his coffin) but not even the film makers can agree on whether he was undead in the earlier sequels.