• About

Pumpkin Person

~ The psychology of horror

Pumpkin Person

Category Archives: Uncategorized

Estimating Cro-Magnon man’s IQ from brain size and drawings

26 Wednesday Oct 2016

Posted by pumpkinperson in Uncategorized

≈ 32 Comments

Cro-Magnon man dominated Europe from about 45,000 years ago to 10,000 years ago.  Although they are sometimes considered the first Whites, the white gene pool is more complex given the spread of agriculture from the Middle east and actual white skin is thought not to have appeared until 7000 years ago, so Cro-Magnon’s probably looked liked this.

Brain Size suggests an IQ of 92 to 99

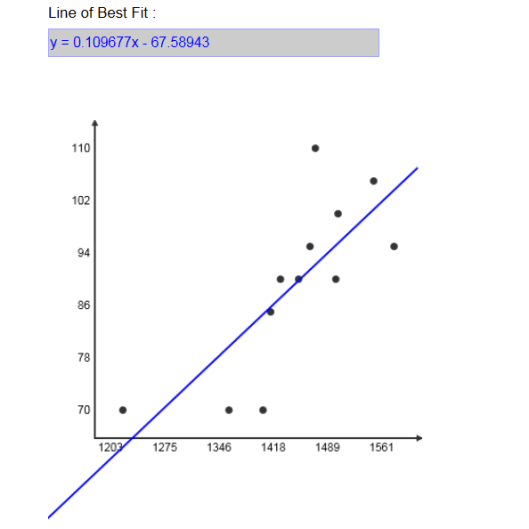
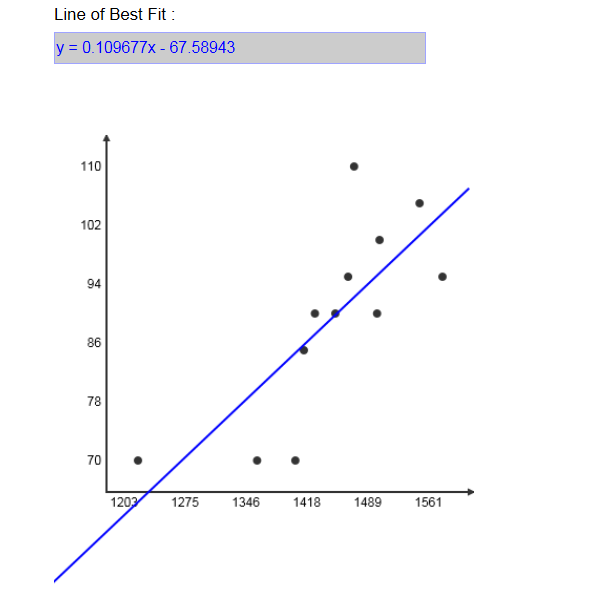
Commenter Milo wanted me to estimate their IQ from their brain size and using my line of best fit, which predicts mean genetic IQ (y) from mean genetic brain size (x) in 13 modern races, I can possibly do so.
popbrain

About 15,000 years ago their cranial capacity was 1450 cc, suggesting an IQ of 92, but by 10,000 years ago, the incredible cognitive demands of surviving ice age Europe had raised their brain sizes to 1518 cc, suggesting an IQ of 99.

Draw-A-Man IQ test suggests an IQ of 75

To validate these IQ estimates, I decided to look at their cave art, with an emphasis on drawings of people, so I could apply Dale Harris’s revision of the beloved Goodenough Draw-A-Man IQ test.  The first drawing of a man I found was discovered in South-western France and believed to be 17,000 years old.  It’s known as “The Wounded Man”.

woundedman

The Goodenough Harris Draw-A-Man test has a maximum raw score of 73, but because this drawing depicted the man with the head of a bird, not a human, 13 of the items dealing with features unique to the human head could not be scored, so it ended up with a score of 22/60 which I then prorated to 27/73.

Another mysterious cave painting found in the cavern known as ‘The Sanctuary’ at Trois-Frères, Ariège, France, made around 15,000 years ago is known as “The Sorcerer”.
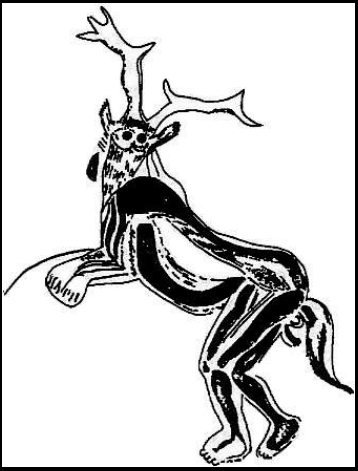
sorc

Unfortunately this too is a man-animal hybrid, and the animal features made some of the items inapplicable, in this case, the six items dealing with clothing (items #29,#55,#56,#57,#58 and #59), but out of the remaining 67 items, the picture scored 49, which I prorated into a score of 53/73.

Averaging the two drawings together, Cro-Magnon man scored 40/73 on the Goodenough-Harris Draw-A-Man test.  The smoothed mean and standard deviation for U.S. 15-year-olds (considered adult level for the purpose of this test) is 45.2 and 9.83  respectively, so this equates to an IQ of 92 (U.S. norms) or 90 (U.S. white norms).  But because these norms were published in 1963, and norms on this test became inflated at a rate of 3 IQ points per decade (Lynn, 2006) until at least 2006, we must reduce this IQ to 77 on modern white norms.

Correcting for culture bias, Draw-A-Man test suggests an IQ of 95

Because even the Draw-a-man test is culturally biased, we must do our best to adjust for the stone age environment Cro-Magnons lived in.  It’s well known that on typical IQ tests, dropping out of school causes IQ scores (though perhaps not real intelligence) to drop by 2 points per missed year, and research on adopted kids shows that each extra year of education in the rearing parent raises a child’s IQ score by 1.17 points.  Although such cultural biases fade by adulthood, as scholars Dickens and Flynn brilliantly noted, this is only true within generations.  Between generations these environmental effects are permanent.

So considering the average Cro-Magnon had about 13 years less schooling than today’s average white, this would artificially depress his IQ by 26 points.  Further, being raised by parents with 12 less years schooling than today’s average white would artificially depress his IQ by 14 points. So these two cultural biases together should artificially depress his IQ by 40 points on a typical IQ test, but because the Draw-A-Man test is only about half as culturally biased as a typical IQ test, we’ll say it’s depressed by only 20 points.

You might ask, why, if the Draw-A-Man test is only half as culturally biased as a typical IQ test, does it show the full 3 point a decade Flynn effect.  The answer is because the Flynn effect is not entirely cultural, it’s also biological (nutrition) and Performance IQ tests like Draw-a-man are sensitive to nutrition (which Cro-Mangnons had plenty of).

So adding 20 IQ points to their IQ of 77, to compensate for the test’s cultural bias, raises them to IQ 97.

I realize such corrections are very simplistic, but it seems to give believable results.

Share this:

  • Share on X (Opens in new window) X
  • Share on Facebook (Opens in new window) Facebook
Like Loading...

How smart was Homo Erectus?

26 Wednesday Oct 2016

Posted by pumpkinperson in Uncategorized

≈ 6 Comments

homo_erectus_new


I’ve posted about the IQ of Homo Erectus before, but in this post, I will refine my analysis in light of better understanding.

Experiments suggest that it’s not until a child is seven that she has the mental capacity to create the kind of stone tools Homo erectus created. In other words, Homo erectus may have had the intelligence of a Western seven-year-old. On the WISC-R IQ test, an incipient adult (age 16.9) who performs like a seven-year-old on the spatial construction subtest scores lower than 99.5% of biologically normal members of his generation. In other words, an IQ of about 60.

But we should keep in mind that the research on seven-year-old tool making ability was published in 1979. Probably because of better nutrition/health,truly culture reduced spatial skill has been improved by about 0.2 points a year until 2006 (when U.S. nutrition gains seem to have ended). So Homo erectus probably had an IQ around 55 on the most recent culture reduced Western norms (U.S. white norms).

Brain size of Homo erectus

According to research cited by scholar Richard Lynn, Homo erectus emerged 1.7 million years ago with an average brain size of 885 cc and by 200,000 years ago, their brains had increased to 1,186 cc.

The below chart shows a line of best fit for the average genetic brain size and the average genetic IQ for 13 contemporary human races.

popbrain

If we extend the trend line to extinct Homo species like Erectus, and if we assume Erectus reached their genetic potential for brain size and IQ (early hunter/gatherers living their natural life style seemed to have far better nutrition than all but the most  recent First World agriculturalists and Erectus eventually learned to cook its food, digesting even more nutrients) then we can estimate from their brain size that they had an IQ of about 30, when they first appeared 1.7 million years ago, and about 62 when they were finally killed off by anatomically modern humans.  On the other hand, based on their lack of tool progress, they never progressed beyond a mean IQ of 55.


Share this:

  • Share on X (Opens in new window) X
  • Share on Facebook (Opens in new window) Facebook
Like Loading...

The RISE and fall and RISE of brain SIZE

26 Wednesday Oct 2016

Posted by pumpkinperson in Uncategorized

≈ 47 Comments

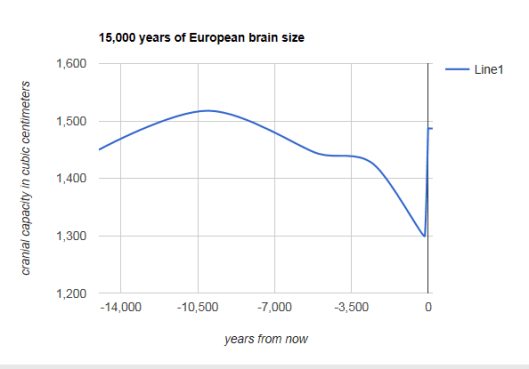
In four million years of human evolution, brain size roughly tripled from 500 cm3 in Australopithecenes to 800 cm3 in Homo habilis to 1000 cm3 in Homo erectus to over 1300 cm3 in modern Homo sapiens and over 1500 cm3 in late ice age Europeans. However about 10,000 years ago, the human brain began to shrink quite precipitously only to rebound since the industrial revolution.   Here’s my best attempt to show the historical trend in sex-combined Europeans, though it may need some revising:

recoveredbrain

The simplest explanation for this is the development of agriculture, as scholar Richard Lynn explains:

The period of around 25-10,000 yr ago was the last ice-age and at this time the Caucasoid peoples of Europe and the Near East had brains of approximately the same size as today (Henneberg, Budnik, Pezacka & Puch, 1985). These peoples lived largely by hunting because plant foods were unavailable for much of the year and their meat diet evidently provided them with a high standard of nutrition and enabled them to develop their large heads and brains.

Following the recession of the ice age people evolved a new life style living in permanent village settlements with domestic animals and cereal agriculture. But although the new life style was more convenient the quality of nutrition fell and many skeletal remains show signs of rickets and other malformations caused by suboptimal nutrition (Festinger, 1983).

For the last 2000 yr data on heights of adult males in Britain have been collected by Kunitz (1987) and by Floud, Gregory and Wachter (1988). The broad trend is that height has been constant at a mean of approx. 172 cm up to the cohort born around 1930. From this date onwards height has increased. It seems reasonable to infer that brain size and intelligence were approximately stable for about 2000 yr up to around 1930 and it is only in the last half century that the increases have occurred. In the economically advanced nations the improvements in nutrition have enabled us to recover the brain size and intelligence levels of our ancestors of 25,000 yr ago.

Of course this analysis ignores long term secular changes which may have taken place in the genetic and cognitive stimulation determinants of intelligence, but is nevertheless offered as an approach to the intriguing question of long term historical trends in intelligence.

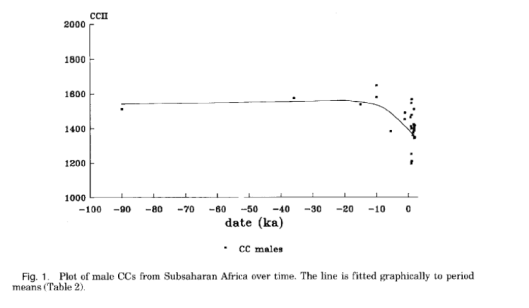
As usual, Lynn provides the most parsimonious explanation.  Of course not everyone agrees that agriculture was the cause of falling brain size, because brains shrunk even in sub-Saharan Africa and Australia where agriculture arrived late.  While it’s true Australian aboriginals had much bigger brains 10,000 years ago than they do today, there’s seemingly no evidence that their brains shrunk prior to European colonization and the resulting change in diet and life style.  Meanwhile the chart below shows little evidence that brain size in Africa shrunk prior to the arrival of agriculture there, several thousand years ago.

agriculture

Thus I think brains shrunk because of malnutrition and disease (agriculture) and not because of backwards evolution.  Of course with the end of the ice age, intelligence was not as crucial to survival (even in the tropics where it caused drought) so that may have relaxed selection for higher IQs, creating a dysgenic effect.  Also, a warming climate selects against brain size because a big head overheats like a 100 watt light bulb. However ice ages have ended before and brains did not shrink.  What was different the last time? Agriculture.


Share this:

  • Share on X (Opens in new window) X
  • Share on Facebook (Opens in new window) Facebook
Like Loading...

Open thread, Oct 11, 2016

11 Tuesday Oct 2016

Posted by pumpkinperson in Uncategorized

≈ 510 Comments

For topics unrelated to my 4 latest articles, please post in this thread.  Please post about any topic at all.

However comments related to my 4 latest articles should be posted in their comment sections:

Trump wins second debate

More evidence that intelligence is the ability to adapt

The antiquity of the three main races

Prehistoric genocide


Share this:

  • Share on X (Opens in new window) X
  • Share on Facebook (Opens in new window) Facebook
Like Loading...

Trump wins second debate!

11 Tuesday Oct 2016

Posted by pumpkinperson in Uncategorized

≈ 64 Comments

I have to give Trump credit.  Despite having virtually no political experience, he went face to face with one of the most experienced and intelligent politicians in America Sunday night, and beat her at her own game.

And he was quick on his feet.

Hillary said “It’s just a good thing that someone with the temperament of Donald Trump is not in charge of the law in our country,” to which Trump brilliantly replied:

“Because you’d be in jail.”

The crowd went wild.

That’ll go down in history as one of the greatest debate moments in U.S. history, along with “you’re no Jack Kennedy” and Reagan’s famous “there you go again.”

In an earlier post, I had somewhat facetiously estimated Trump’s IQ to be only 94 (white norms) because he failed to correctly multiply 17 by 6.  Perhaps his Arithmetic IQ is only 94, but having beat the 140 IQ Hillary in a debate (something not even Barack Obama accomplished), I assign him a verbal-improvisational IQ of 140.

Debating must be a fairly g loaded skill, so Trump’s debate performance, especially against a much more experienced opponent is empirical evidence of IQ.

Arithmetic and debating can be thought of two very different kinds of “verbal” subtests and Trump clocks in at IQ 117 when both are averaged .  On the WAIS-III IQ test, someone who averages the equivalent of IQ 117 on the various verbal subtest,  clocks in at IQ 121 on the composite verbal score (a good proxy for overall IQ).

Trump is probably smarter than your typical inheritance billionaire (IQ  114) because he built on his inheritance, but he’s probably not as smart as your typical self-made billionaire (IQ 132).  An IQ of 121 is entirely believable.

Nonetheless, winning a debate and winning an election are two very different things.  It’s unlikely Trump’s strong debate performance will heal his political wounds caused by a release of audio of him saying extremely lewd things.

Share this:

  • Share on X (Opens in new window) X
  • Share on Facebook (Opens in new window) Facebook
Like Loading...

More evidence that intelligence is the ability to adapt

11 Tuesday Oct 2016

Posted by pumpkinperson in Uncategorized

≈ 75 Comments

I have long championed the view that intelligence is the mental ability to adapt: to take whatever situation you’re in, and turn it around to your advantage.  I fell in love with this definition because it unified the many parts of intelligence (verbal ability, spatial ability, Theory of Mind) into a single system, and because it placed intelligence at its rightful place at the pinnacle of evolution: for all animals have adaptations, but humans dominate, because our adaptation is the ability to adapt itself.

But the question becomes, why did humans become so uniquely intelligent?  The logical theory that I had always believed, and that Darwin himself believed, was that it was bipedalism. Once we started walking erect, we freed our hands up to make tools and this selected for intelligence, which allowed us to make more tools, which selected for even more intelligence.

Duh!

And yet the fossil record shows intelligence did not immediately follow bipedalism.  Indeed our ape ancestors may have been bipedal for nearly four million without showing much of any evidence for increased brain size or intelligence.

Then only in about the last few million years did brain size suddenly TRIPLE.  How do we explain this?

Scholar Rick Potts argues that during the last few million or so years there was rapid climate change in Africa.  Massive droughts followed by massive wet periods followed by massive droughts.  Lakes would come and go in the blink of a geological eye.  One day it dawned on Potts that it wasn’t the particular environment that was selecting for intelligence, it was the constant CHANGE in environment.

And who thrives in a constantly changing environment?  Those who can adapt.

Of course every organism adapts to its environment, that’s the point of evolution, however most organisms adapt by changing their genes over many generations.  We also adapted by changing our genes, but we took it a step further: We were selected for genes that allowed us to change our BEHAVIOR, which allowed rapid instantaneous change, far outpacing slow genetic change.

Intelligence is just whatever mental abilities are needed to change your behavior as successfully as possible.  Those who couldn’t learn quickly and think creatively during rapid change died out, leaving bigger brained primates as the survivors.

As an HBDer, I have long believed that adapting to newer colder climates caused whites and Northeast Asians to evolve especially high intelligence,  but I had no idea that climate change in Africa was so key to the evolution of human intelligence itself.

This theory is discussed starting at the 40 minute mark in the below video:


Share this:

  • Share on X (Opens in new window) X
  • Share on Facebook (Opens in new window) Facebook
Like Loading...

Prehistoric genocide

11 Tuesday Oct 2016

Posted by pumpkinperson in Uncategorized

≈ 22 Comments

With Halloween only weeks away, I have to share one of the most terrifying images of my childhood.  When I was a little kid (I’m now in my 30s) I was already really interested in evolution, but in all the books on the subject I had leafed through, nothing scared me or captured my imagination as much as this image.

photo-1


I wish I could credit the artist, but it’s from a 1979 TIME-LIFE book called Early Man by F. Clark Howell and the editors of TIME-LIFE books.

It terrified me because it depicts the more evolved australopithecines killing off the primitive Australopithecus robustus but it captured my imagination because it shows Africa in all its glory.  There was such beauty in living in Africa millions of years ago, at the dawn of humanity while the setting sun subtly colors the rocks on the hills.  The open fields and endless landscape, on a lonely planet with only a few scattered Stone Age tribes on just a single continent.

In the picture, the more advanced tribe adapts the situation to their advantage by using lighter but sharper rocks, while the monkey tribe gets much less bang for their buck by draining their energy with heavy blunter weapons.

Intelligent behavior = low cost/benefit behavior.

Share this:

  • Share on X (Opens in new window) X
  • Share on Facebook (Opens in new window) Facebook
Like Loading...

The Friday the 13th movies show how IQ becomes more heritable with age

04 Tuesday Oct 2016

Posted by pumpkinperson in Uncategorized

≈ 41 Comments

With Halloween only weeks away, the topics on this blog are getting darker.  I find it fascinating how art imitates life, even when the artists don’t understand the life they are imitating.  I doubt the writers of the original Friday the 13th movies (released in the 1980s) understood the concept of heritability, let alone the fact that heritability increases with age, and yet their main character, the iconic hockey mask wearing machete wielding killer, Jason, was a perfect example of exactly that.

In the late 20th century, it was discovered that genes explain about 45% of the IQ variation in childhood, 65% of the variation in adolescence, and about 80% in later maturity.  Family environment explains about 35% of the IQ variation in childhood, and near zero by later adulthood.  Meanwhile chance environment explains about 25% at all ages.

The character of Jason was born with extremely bad genes for IQ, a genetic condition called hydrocephalis, where there is too much cerebrospinal fluid in the brain, causing the head to swell and deform.  Yet despite his extremely bad genes, growing up he would have scored above 60 on IQ tests because his mother was constantly teaching him and getting him to participate in educational activities like summer camp.


tumblr_no4enpt1ye1sqftoto1_400

The late actress Betsy Palmer was brilliant as Jason’s all American mother; the ultimate summer camp mom

However the problem with trying to educated people beyond their genetic ability, is that as soon as they are placed in a novel situation, they can’t adapt, and their learning and training is useless.  For Jason, that novel situation was going swimming one evening at Camp Crystal Lake.

maxresdefault

Not intelligent enough to remember how to swim, he almost drowned and was washed to the other side of the lake.  When he came out of the water, in the unfamiliar wilderness, he could not adapt by finding his way back to the camp, let alone to his grieving mother.  So he simply lived in the woods like animal, for decades.

So he started with a great environment (being raised by an attentive all-American mother) which artificially propped his IQ up above 60, but because his genetic ability was so low, when faced with a truly novel problem (nearly drowning and washing up in an unfamiliar part of the woods), he turned the situation to his disadvantage, by getting stranded in the woods for decades and becoming a feral child, losing his capacity for speech.

0021

So what started as extremely bad genes being propped up by a good environment (attentive mother) became extremely bad genes in an extremely bad environment (living like an animal in the woods).  This is a classic example of the gene-environment correlation increasing with age: bad genes create bad environments, even when they start with good environments.

This shows that while a good cultural environment can raise IQ scores, it can’t do much to raise real intelligence.  Because if real intelligence was being raised, why do genetically dull people from good environments see their IQs drop with age?  It’s not that the effects of environment fade, it’s that environmentally enhanced IQs were never real to begin with, which is precisely why they can’t maintain their good environments.

By the time Jason was in his 30s (my age), not only had his low genetic IQ destroyed his cultural environment (living in the woods devoid of all culture) but he had finally destroyed his biological environment, as his violent behavior caused someone to sink a machete into his head, physically damaging his brain.


jason-4

Such damage from the physical environment, like the cultural deprivation of becoming a feral child, damaged his IQ score, but unlike cultural deprivation, the biological insults destroy real intelligence, and not mere test performance.

Jason was born with a genetic IQ of perhaps 40, but because of a loving mother (good environment) he had a phenotypic IQ of over 60 in childhood.  But because the phenotypic IQ was artificially propped up by an environment he could not adapt to his advantage, his environment precipitously declined, until his IQ was as low as his genetic IQ.


Share this:

  • Share on X (Opens in new window) X
  • Share on Facebook (Opens in new window) Facebook
Like Loading...

Open thread Oct 02, 2016

02 Sunday Oct 2016

Posted by pumpkinperson in Uncategorized

≈ 22 Comments

For comments unrelated to my latest post, Canadian provinces ranked by IQ, please post here.

Please post here about any topic at all.


Share this:

  • Share on X (Opens in new window) X
  • Share on Facebook (Opens in new window) Facebook
Like Loading...

Canadian provinces ranked by IQ

02 Sunday Oct 2016

Posted by pumpkinperson in Uncategorized

≈ 24 Comments

Commenter JS was interested in how Canadian provinces ranked by IQ so I decided to look into this.  In 2013, the Pan-Canadian Assessment Program (PCAP) test was administered to a sample of more than 32,000 Grade 8 students from across the country.  Scores were given in reading, math, and science, but I decided to focus only on reading and math, since those are the basics, and resemble the familiar U.S. SAT scores so often used as proxies for IQ.

In researching the PCAP, I learned that each subscale was normed so that the distribution for all Canadians has a mean of 500 and a standard deviation of 100.  However by 2013, the mean Canadian reading score had drifted up to 508 and the mean math score had drifted up to 507 (I assume the SDs had remained at 100).  Assuming the correlation between reading and math scores is 0.67 (as it is for the SAT), I calculated that the composite score (reading + math) would have a mean of 1015 and a standard deviation of 182.76.  For each province, I converted the reading, math, and composite score into a Z score relative to the distribution of all Canadians.  These Z scores were then converted to IQs by multiplying by the IQ SD of Candians, and adding it to the mean Canadian IQ.

To determined the IQ mean and SD of Canadians, I noted that on a scale where the mean and SD for all Americans is set at 100 and 15 respectively, Canadians average 104.5 (SD = 13.4) and white Americans average 103.4 (SD = 14).  But on a scale where the mean and SD of white Americans is set at 100 and 15 respectively, Canadians average 101 (SD = 14.36) and all Americans average 96.36 (SD = 16.07).  The first scale is known as U.S. norms, while the second is known as U.S. white norms.


reading iq

(u.s.white norms)

math iq

(u.s. white norms)

composite iq

(u.s. white norms)

composite iq

(u.s. norms)

ontario 103 102 103 106
quebec 100 104 102 105
alberta 100 100 100 103
british columbia 100 98 99 103
prince edward island 99 99 99 103
newfoundland and labrador 99 98 98 102
saskatchewan 98 98 98 102
nova scotia 98 98 98 102
new brunswick 96 97 96 100
manitoba 95 96 95 99

Discussion

The vast majority of Canadian provinces average IQs below the U.S. white mean (100, U.S. white norms)  However because high IQ provinces like Ontario and Quebec are the most populous, the average Canadian is smarter than the average white American, and is substantially smarter than the average of all Americans (96.35 U.S. white norms). Only one Canadian province (Manitoba) falls below the overall U.S. mean, though only by 1 point.

The 8 point IQ gap

Toronto: One of the most vibrant cities in the World

With a mean IQ of 103 (U.S. white norms) it comes as no surprise that Canada’s smartest province is Ontario, since this province is home to both the nation’s capital (Ottawa) and its most populous city (Toronto).

While Canadians like to think of ourselves (correctly in my opinion) as a much less socially stratified country than the United States, there remains a shocking 8 point IQ gap between the mean IQ of Ontario (103, U.S. white norms) and Manitoba (95, U.S. white norms).  It’s unclear if this gap is cultural or biological.  The  most obvious explanation is economic selection.  The brightest folks migrate to the richest and most powerful province (Ontario), leaving the less intelligent behind in Manitoba.

Manitoba: The province Canada forgot

Unlike the skyscrapers and busy streets that adorn Ontario, Manitoba is full of dreary run down shacks cursed by terrifying Northern lights.

One can drive for hours in Manitoba and not see a single person.  Sometimes the only thing scarier than not being able to find human life in Manitoba, is actually finding it:

Low IQ Manitobans who can not achieve wealth or status, will get pleasure from the simple things in life, like enjoying the Northern lights, or gazing at the sun rise.

While Manitoba is one of the most beautiful places on Earth, it is also a land of great poverty:

Manitoba is a land of great beauty and serenity.  A place where you can turn off the noise of modernity and get in touch with your sense of awe and wonder.

And while it appears to be the least intelligent province in Canada, the average Manitoban is about as bright as the average American.


Share this:

  • Share on X (Opens in new window) X
  • Share on Facebook (Opens in new window) Facebook
Like Loading...
← Older posts
Newer posts →

contact pumpkinperson at easiestquestion@hotmail.ca

  1. James Peach's avatar
    James Peach on Brain the size of a basketball?July 27, 2026

    Asking who is more adapted is like asking who is healthier. That has no objective answer. The standard answer for…

  2. James Peach's avatar
    James Peach on Brain the size of a basketball?July 27, 2026

    You do not view intelligence as the ability to coordinate mental cognitive processes? That be my whole point. That adaptation…

  3. pumpkinperson's avatar
    pumpkinperson on Brain the size of a basketball?July 27, 2026

    What does it mean to “adapt”? To take whatever situation you're in and turn it around to your advantage. To…

  4. James Peach's avatar
    James Peach on Brain the size of a basketball?July 27, 2026

    Just read this book on inflammation and depression. The underlying cause of depression is stress damage to the brain. No…

  5. James Peach's avatar
    James Peach on Brain the size of a basketball?July 26, 2026

    What does it mean to "adapt"? Is Elon Musk the smartest man because he has the most money or does…

Recent Comments

James Peach's avatarJames Peach on Brain the size of a baske…
pumpkinperson's avatarpumpkinperson on Brain the size of a baske…
James Peach's avatarJames Peach on Brain the size of a baske…
pumpkinperson's avatarpumpkinperson on Brain the size of a baske…
God's Word's avatarGod's Word on Brain the size of a baske…
James Peach's avatarJames Peach on Brain the size of a baske…
pumpkinperson's avatarpumpkinperson on Brain the size of a baske…
James Peach's avatarJames Peach on Brain the size of a baske…

Archives

  • June 2026
  • May 2026
  • January 2026
  • December 2025
  • November 2025
  • October 2025
  • September 2025
  • August 2025
  • July 2025
  • June 2025
  • May 2025
  • April 2025
  • March 2025
  • February 2025
  • January 2025
  • December 2024
  • November 2024
  • October 2024
  • September 2024
  • August 2024
  • July 2024
  • June 2024
  • May 2024
  • April 2024
  • March 2024
  • February 2024
  • January 2024
  • December 2023
  • November 2023
  • October 2023
  • September 2023
  • August 2023
  • July 2023
  • June 2023
  • May 2023
  • April 2023
  • March 2023
  • February 2023
  • January 2023
  • December 2022
  • November 2022
  • October 2022
  • September 2022
  • August 2022
  • July 2022
  • June 2022
  • May 2022
  • April 2022
  • March 2022
  • February 2022
  • January 2022
  • December 2021
  • November 2021
  • October 2021
  • September 2021
  • August 2021
  • July 2021
  • June 2021
  • May 2021
  • April 2021
  • March 2021
  • February 2021
  • January 2021
  • December 2020
  • November 2020
  • October 2020
  • September 2020
  • August 2020
  • July 2020
  • May 2020
  • April 2020
  • March 2020
  • February 2020
  • January 2020
  • December 2019
  • November 2019
  • October 2019
  • September 2019
  • August 2019
  • July 2019
  • June 2019
  • May 2019
  • April 2019
  • March 2019
  • February 2019
  • January 2019
  • December 2018
  • November 2018
  • October 2018
  • September 2018
  • August 2018
  • July 2018
  • June 2018
  • May 2018
  • April 2018
  • March 2018
  • February 2018
  • January 2018
  • December 2017
  • November 2017
  • October 2017
  • September 2017
  • August 2017
  • July 2017
  • June 2017
  • May 2017
  • April 2017
  • March 2017
  • February 2017
  • January 2017
  • December 2016
  • November 2016
  • October 2016
  • September 2016
  • August 2016
  • June 2016
  • February 2016
  • January 2016
  • November 2015
  • May 2015
  • January 2015
  • December 2014
  • November 2014
  • October 2014

Categories

  • ethnicity
  • heritability
  • income
  • Oprah
  • Uncategorized

Meta

  • Create account
  • Log in
  • Entries feed
  • Comments feed
  • WordPress.com
  1. James Peach's avatar
    James Peach on Brain the size of a basketball?July 27, 2026

    Asking who is more adapted is like asking who is healthier. That has no objective answer. The standard answer for…

  2. James Peach's avatar
    James Peach on Brain the size of a basketball?July 27, 2026

    You do not view intelligence as the ability to coordinate mental cognitive processes? That be my whole point. That adaptation…

  3. pumpkinperson's avatar
    pumpkinperson on Brain the size of a basketball?July 27, 2026

    What does it mean to “adapt”? To take whatever situation you're in and turn it around to your advantage. To…

  4. James Peach's avatar
    James Peach on Brain the size of a basketball?July 27, 2026

    Just read this book on inflammation and depression. The underlying cause of depression is stress damage to the brain. No…

  5. James Peach's avatar
    James Peach on Brain the size of a basketball?July 26, 2026

    What does it mean to "adapt"? Is Elon Musk the smartest man because he has the most money or does…

Create a free website or blog at WordPress.com.

Privacy & Cookies: This site uses cookies. By continuing to use this website, you agree to their use.
To find out more, including how to control cookies, see here: Cookie Policy
  • Subscribe Subscribed
    • Pumpkin Person
    • Join 668 other subscribers
    • Already have a WordPress.com account? Log in now.
    • Pumpkin Person
    • Subscribe Subscribed
    • Sign up
    • Log in
    • Report this content
    • View site in Reader
    • Manage subscriptions
    • Collapse this bar
Loading Comments...
%d