• About

Pumpkin Person

~ The psychology of horror

Pumpkin Person

Category Archives: Uncategorized

Your brain on poverty by Afrosapiens

25 Tuesday Jul 2017

Posted by pumpkinperson in Uncategorized

≈ 192 Comments

[Note from Pumpkin Person, July 25, 2017: The following guest post does not necessarily reflect the views of Pumpkin Person.  Out of respect for the author, please try to keep all comments on topic.  I understand conversations naturally evolve but at least start on topic.  It should be noted that the theories described have been severely criticised by Greg Cochran]

Poverty has long been associated with educational under-achievement and various behavioral issues. Although the underlying causes of these differences have been at the center of a nature vs.. Nurture debate for decades, it’s only recently that insights from neuroscience have allowed better understanding of how poverty affects the brain. Observations from MRI scans show slower brain growth in children growing up in low SES households (poor and near-poor) which results in reduced volume and grey matter thickness in the frontal and parietal cortices as well as lower amygdala and hippocampus size. All those affected brain areas are crucial to learning and social functioning as they govern cognitive and executive functions such as language, working and long-term memory, attention, impulse control, emotional management and information processing.

poverty-and-brain-300x202

Although research using animal experiments indicate that the relationship between poverty and altered brain development is causal, it is yet not clear which aspect of poverty impacts which function the most. The most cited factors are stress, trauma, low stimulation, poor child-parent relationship, poor nutrition and poor health. Although it is also possible that genetics play a role in individual susceptibility to these factors, the idea that genetic background cause people to be poor in the first place and then have their brains damaged by environmental factors is not supported by science and belongs to pseudo-Darwinian creationism, especially since such deficits appear to be reversible to a substantial degree due to brain plasticity.

Various interventions to improve or prevent decrease in cognitive and executive function have shown good and lasting results in reducing behavioral issues and increasing school performance and job market participation. Interventions can take various forms, first of all, since poverty is lack of financial resources, income supports to families with children are an obvious means of limiting children’s exposure to poverty-related adversity. Although this is absolute common sense, conservative ideologues have managed to convince a large part of the public that pro-poor policies would in fact be harmful to the needy whereas pro-rich ones would mysteriously benefit them.

Besides redistribution, executive function coaching in the form of computer or non-computer games, aerobic exercise and sports, music, martial arts and mindfulness practices as well as improvements in school curricula and teaching methods have been shown to improve social and educational outcomes. One last type of intervention that yielded good results is nurse home visits to low-income mothers of young children which had the effect of improving developmental outcomes of children by teaching mothers parenting skills and healthy practices.

These interventions aren’t to be confused with efforts at increasing IQ that caused little improvement beyond temporarily increasing IQ scores, which has no relevance in terms of life outcomes. IQ can probably benefit from increased language skills and executive function but it doesn’t seem to be the target of remedial intervention on those underlying abilities of which IQ test performance would only be a byproduct.

Now you might wonder how big a problem child poverty and its neurological consequences are in contemporary societies. Although the most extreme and widespread child poverty is seen in developing countries, industrialized countries like the USA, Israel, Turkey, Chile and Spain have rates of prevalence above 20%, whereas countries in Western Europe tend to maintain rates around or below 10%.

While informative, reported child poverty rates only include those who live below an arbitrarily defined poverty threshold in a given year, but the effects on poverty likely affect those living only slightly above poverty line and do not meet their developmental needs and those who have experienced poverty in the past but were living above the threshold when the figures were reported.

Within the United States, significant differences in the prevalence and the nature of child poverty exist between ethnic groups with 34% of Native Americans, 13% of Asians/Pacific Islanders, 36% of African-Americans, 31% of Hispanics and 12% of European Americans living under poverty line in 2015.

Comparing African-Americans and European Americans, the nature of poverty differed markedly with 77% of African Americans experiencing poverty at least once in their childhood and 37% living in poverty for more than 9 years.In comparison, only 30% of European American children experienced poverty while growing up, including 5% for more than 9 years. 40% of black children and 8% of white children were poor at birth. Among those born poor, 60% of African Americans and 25% of European Americans were still poor at age 17, among those not born in poverty, 20% of black children and 5% of whites were poor at age 17.

With the effects of poverty worse felt at a younger age and during long periods of time, such interracial differences in prevalence and persistence of child poverty are one plausible large contributor to the observed gaps in educational and behavioral outcomes between the two groups.

Read more:

  • Association of Child Poverty, Brain Development, and Academic Achievement
  • The Effects of Poverty on Childhood Brain Development: The Mediating Effect of
  • Caregiving and Stressful Life Events
  • Family Poverty Affects the Rate of Human Infant Brain GrowthThe impact of poverty on the development of brain networks
  • Effects of childhood poverty and chronic stress on emotion regulatory brain function in adulthood
  • Poverty’s Most Insidious Damage: The Developing Brain
  • Socioeconomic status and the brain: mechanistic insights from human and animal research
  • Childhood Poverty, Chronic Stress, Self-Regulation, and Coping
  • Socioeconomic status and structural brain developmentChildhood Poverty: Specific
  • Associations with Neurocognitive Development
  • POVERTY, PRIVILEGE, AND BRAIN DEVELOPMENT: EMPIRICAL FINDINGS AND ETHICAL IMPLICATIONS
  • Neural correlates of socioeconomic status in the developing human brain
  • Poverty, cultural disadvantage and brain development: a study of pre-school children in Mexico.
  • Rethinking the Brain: New Insights into Early Development.Malnutrition, poverty and intellectual development
  • State of the Art Review: Poverty and the Developing Brain
  • Poverty Impedes Cognitive Function
  • Brain Drain: A Child’s Brain on Poverty
  • Poverty, Stress, and Brain Development: New Directions for Prevention and Intervention
  • Effects of Socioeconomic Status on Brain Development, and How Cognitive Neuroscience May Contribute to Levelling the Playing Field
  • Family income, parental education and brain structure in children and adolescents
  • Neglected infections of poverty in the United States and their effects on the brain
  • Brain on stress: How the social environment gets under the skin
  • How Poverty Affects the Brain: An unprecedented study in Bangladesh could reveal how malnutrition, poor sanitation and other challenges make their mark on child development
  • Interventions shown to aid executive function development in children 4 to 12 years old.
  • Short-Term Music Training Enhances Verbal Intelligence and Executive Function
  • The development of inhibitory control in preschool children: Effects of “executive skills” training
  • Relating Effortful Control, Executive Function, and False Belief Understanding to Emerging Math and Literacy Ability in Kindergarten
  • Competitive Versus Cooperative Exergame Play for African American Adolescents’ Executive Function Skills: Short-Term Effects in a Long-Term Training Intervention
  • Training and transfer effects of executive functions in preschool children
  • Effects of physical activity on children’s executive function: Contributions of experimental research on aerobic exercise
  • Reflection training improves executive function in preschool-age children: Behavioral and neural effects
  • Hot and Cool Executive Function in Childhood and Adolescence: Development and Plasticity
  • Childhood Poverty Persistence: Facts and Consequences
  • Child poverty OECD

Share this:

  • Share on X (Opens in new window) X
  • Share on Facebook (Opens in new window) Facebook
Like Loading...

Estimating Jeff Bezos’s IQ

24 Monday Jul 2017

Posted by pumpkinperson in Uncategorized

≈ 116 Comments

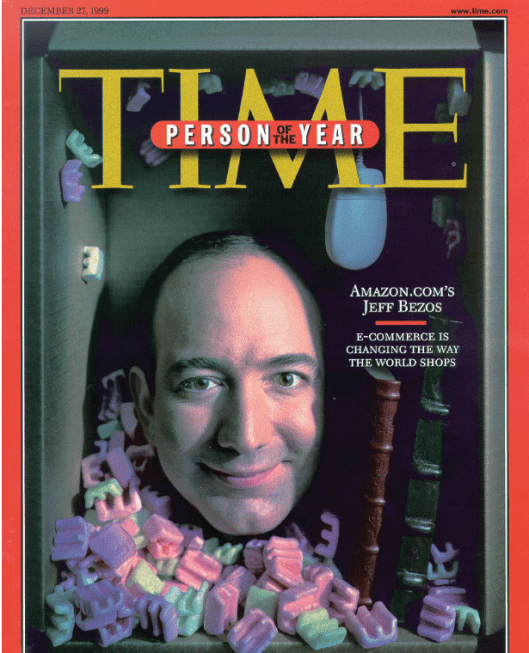
bezos.PNG

Commenter Deeru asked me to blog about Jeff Bezos’s IQ.  I don’t know much about him beyond seeing him on Oprah way back in the 1990s or early 2000s.  What I most remember is that he was constantly giggling and when he first came on stage he turned to the audience and said:

I just have one thing to say. I LOOOOOOOOOOOOOOOOOOOOOOOOOOOOOOOOOVE OPRAH!…Oprah is the exact same person off camera as she is on TV.

Bezos was there to teach Oprah how to surf the web.

“It was fun surfing with you, Jeff” Oprah said flirtatiously causing Bezos to giggle even more.

At the time Bezos and Oprah were both already members of the Forbes 400 richest Americans list but since then Bezos’s fortune has skyrocketed to the second richest person in the World.

So what is his IQ?

Steve Hsu mentioned the following quote from Jeff Bezos:

So, I went to Princeton primarily because I wanted to study physics, and it’s such a fantastic place to study physics. Things went fairly well until I got to quantum mechanics and there were about 30 people in the class by that point and it was so hard for me. I just remember there was a point in this where I realized I’m never going to be a great physicist. There were three or four people in the class whose brains were so clearly wired differently to process these highly abstract concepts, so much more.

Notice that Bezos is clearly smart enough to understand that intelligence is a PHYSIOLOGICAL ability and not acquired knowledge and skill.  The brains of super smart people are WIRED differently.  He continues:

I was doing well in terms of the grades I was getting, but for me it was laborious, hard work. And, for some of these truly gifted folks — it was awe-inspiring for me to watch them because in a very easy, almost casual way, they could absorb concepts and solve problems that I would work 12 hours on, and it was a wonderful thing to behold. At the same time, I had been studying computer science, and was really finding that that was something I was drawn toward. I was drawn to that more and more and that turned out to be a great thing. So I found — one of the great things Princeton taught me is that I’m not smart enough to be a physicist.

This tells us Bezos math IQ was much lower than the top four math students of his Princeton graduating class.  So what was their math IQ?  Given that about 1100 people graduated from Princeton a year, these top four represent the top 0.36%.  If we assume Princeton was representative of the top ten colleges in America, who enrolled 18,000 freshman a year circa 1990, and if we further assume that virtually 100% of the pinnacle of U.S. math talent ended up at a top ten college (and whatever shortfall was balanced by brilliant foreign students), then this top 0.36% of the top ten colleges represented the 65 best math minds out of all 3 million U.S. 18-year-olds per year.  This equates to a math IQ of 161+.

So we know Bezos’s math IQ was much lower than 161.

At the same time, the mere fact that he was in this extremely challenging math class, and was getting good grades suggests his math IQ was well above the average Princeton student’s.  Circa 1990, the average math SAT score at Harvard (and presumably Princeton also) was in the 695 to 718 range (pre-recentering), which I estimated equated to a math IQ of 133.

So we can guess Bezos’s math IQ is well above 133 yet well below 161.  Can we be more precise than that?  A member of the Prometheus high IQ society had a brilliant theory that because the human mind operates in parallel, complex learning and problem solving speed doubles every 5 IQ points.  So if it took Bezos 12 hours to grasp the physics concepts that his math IQ 161+ classmates grasped easily and casually (i.e. in under an hour?), then:

Math IQ 161+ = grasp in under an hour

Math IQ 156 = grasp in under 2 hours

Math IQ 151 = grasp in under 4 hours

Math IQ 146 = grasp in under 8 hours

Math IQ 141 = grasp in under 16 hours

Thus, I’m guessing Bezos has a math IQ above 141 but below 146.  Let’s say 144 (U.S. norms), or 143 (U.S. white norms).  Smarter than 99.8% of Americans in his generation.

Of course math IQ is not the same as overall IQ, but this nonetheless seems like a random non-biased sample of his intelligence so I would not expect his official IQ to regress to the mean the way it does for Ivy League students as a whole.

Share this:

  • Share on X (Opens in new window) X
  • Share on Facebook (Opens in new window) Facebook
Like Loading...

Converting GMAT scores to IQ

21 Friday Jul 2017

Posted by pumpkinperson in Uncategorized

≈ 223 Comments

Commenter Deeru asked me to convert GMAT scores to IQ equivalents.  This is always tricky because while IQ tests are normed on the general population of Western countries, college admission tests are normed on only the educated segment of a population, so converting from one type of norming to another requires some assumptions.

According to Wikipedia:

The Graduate Management Admission Test (GMAT (/ˈdʒiːmæt/ (JEE-mat))) is a computer adaptive test (CAT) intended to assess certain analytical, writing, quantitative, verbal, and reading skills in written English for use in admission to a graduate management program, such as an MBA.[3] It requires knowledge of certain grammar and knowledge of certain algebra, geometry, and arithmetic. The GMAT does not measure business knowledge or skill, nor does it measure intelligence.[4] According to the test owning company, the Graduate Management Admission Council (GMAC), the GMAT assesses analytical writing and problem-solving abilities, while also addressing data sufficiency, logic, and critical reasoning skills that it believes to be vital to real-world business and management success.[5] It can be taken up to five times a year. Each attempt must be at least 16 days apart.[6]

It’s ironic how they deny the GMAT is an intelligence test, while in the next sentence describing it is a test of “problem-solving abilities” because one of the most common definitions of intelligence is the (cognitive) ability to problem solve.  It’s clear that the people who make the GMAT are trying to have their cake and eat it too.  They want the predictive validity of an IQ type test, while at the same time, want to be seen as good liberals who don’t believe in IQ.

Of course any test that measures literacy and numeracy  will tend to correlate substantially with g (the general factor of all cognition, measured by IQ tests) whether the test manufacturers intended it to be an IQ test or not because symbolism itself (words and numbers) is a defining feature of the human intellect.

Here’s some basic GMAT data:

gmat

My first observation is that from about 300 to 700, GMAT scores are more or less normally distributed with a mean of 551.94 and a standard deviation (SD) of 120.88.

GMAT scores of 300 to 700

If we assume that the GMAT population is roughly equivalent to the U.S. college graduate population (mean IQ 111, SD = 13.5), compared to the general U.S. population (mean IQ 100, SD = 15), then the following formula equates GMAT scores to IQ equivalents (U.S. norms):

Formula one (for GMAT scores of 300 to 700):

IQ = [(GMAT score – 551.94)/120.88](13.5) + 111

GMAT scores of 700 to 800

However much like the pre-1995 SAT, GMAT scores seem to become much more rare than the Gaussian curve would predict at the highest levels (perhaps because of ceiling bumping or even Spearman’s Law of Diminishing Returns reducing the correlation between sub-sections).  For example, a score of 800 is 2.05 SD above the GMAT mean, which on a Gaussian curve, predicts one in 52 GMAT testees should score 800.  Instead Deeru claims only one in 6,667 scores this high!

But in order to map this to the IQ scale, we need to know how many people  would score 800 on the GMAT if all four million 22-year-old Americans took the GMAT every year (including college dropouts, high school dropouts etc).

I begin with the assumption that the higher you would score on a graduate school admission test, the more likely you are to actually take such a test (given the correlation between academic talent and education level). and so roughly 100% of U.S. 22-year-olds who would score perfect on a graduate school admission test, actually take such a test, and whatever shortfall there may be is roughly balanced by perfect scoring foreign-test takers, or test-takers from other age groups.

Thus people who score perfect on graduate school admission tests did not merely score higher than those who are applying to graduate school, but they scored higher than all 22-year-olds in America, if all 22-year-olds took these tests.

So if only 30 people a year score perfect on the GMAT, does that mean that only 30 of the four million 22-year-olds in America each year would score 800 on the GMAT?  No, because there are many genius 22-year-olds who would have scored 800 on the GMAT had they decided to major in business, but instead are busy acing the LSAT or the GRE or the MCAT etc.

Only 23.6% of advanced degrees are in business, thus I estimate that only 23.6% of people who write graduate school admission tests are writing the GMAT.  But if 100% of aspiring grad students wrote it, then the number scoring perfect each year should jump from 30 to 127.

So assuming roughly 100% of U.S. 22-year-olds who would have scored perfect on grad school admission tests actually take said tests (and whatever shortfall is roughly balanced by foreigners and other age groups), and assuming only 23.6% of said testees take the GMAT in particular, then:

if all four million U.S. 22-year-olds took the GMAT, only 127 would score 800, which means that an 800 is a one in 31,497 level score.  This equates to an IQ of 160 (U.S. norms).

So given that:

GMAT 800 = IQ 160

and given that 700 = IQ 128 (per formula one), then the following formula equates high GMAT scores to IQ (U.S. norms):

formula two (for GMAT scores 700 to 800):

IQ = 0.32(GMAT score) – 96

I do not consider the GMAT or any other college admission test to be a particularly good measure of intelligence, however when scores from actual IQ tests are not known, the above conversions are a useful proxy.

THEY SHOULD NOT HOWEVER BE USED TO ESTIMATE THE MEDIAN IQ OF ELITE BUSINESS SCHOOLS BECAUSE SUCH STUDENTS ARE SELECTED BASED ON GMAT SCORES WHICH MEANS GMAT PERFORMANCE IS NOT A RANDOM SAMPLE OF ELITE BUSINESS SCHOOL INTELLIGENCE. THIS SUBTLE CONCEPT HAS PROVEN EXTREMELY HARD FOR MANY READERS, BLOGGERS AND SCHOLARS TO GRASP!  YOU’RE EITHER HAVE A STATISTICALLY INTUITIVE BRAIN OR YOU DON’T.  IT’S GENETIC!

Share this:

  • Share on X (Opens in new window) X
  • Share on Facebook (Opens in new window) Facebook
Like Loading...

Intelligence and problem solving

17 Monday Jul 2017

Posted by pumpkinperson in Uncategorized

≈ 265 Comments

Commenter Gypsy recently sent me the following email:

I know it’s a little dumb to mention it again, especially after so much time has elapsed between convos about it, but I feel as though definitions of intelligence posed most commonly (Adaptability, problem solving, even potentially reasoning) lack an intuitive connection to an essential side of intelligence commonly ignored mainly because of our main practise for assessing intelligence: Problem POSING. We discover intelligence broadly by posing questions and assessing the ability of the candidate to deliver the correct answer, but the construction of a sophisticated plan is an essential and actually more used element of intelligence that is not immediately implied by the definitions we propose.

I know that problem proposition is implied by the definition, but the language doesn’t intuitively convey it and it is thus not immediately implied. I think the language used should be as intuitive as possible so as to immediately capture the essence of the thing itself all at once.

Thanks for reading,
Gypsy.

If I understand Gypsy’s email correctly, he seems to be saying that the inherent flaw in how we define and measure intelligence is that we only look at the ability to solve problems, when a crucial part of being smart is identifying the problem itself.

Of course I would argue that it’s not our intelligence that identifies the problem, but rather it’s our feelings.  If we feel the slightest bit of discomfort, even if it’s something as trivial as an itch that needs to be scratched, it’s by definition a problem (since it’s bothering us), and our intelligence is just the brain’s problem solving computer that solves whatever problems our feelings identify.

Now we evolved to feel pleasure when we are engaging in behavior that enhances our genetic fitness (surviving, making money, making love, making friends) and feel pain when we are denied these achievements, and so we are generally motivated to use our intelligence to our genetic advantage,  at least to some degree, or it couldn’t have evolved in the first place.

However because everyone’s incentive structure is unique, one man’s problem is another man’s solution, so an IQ test must DECIDE for us what the problem is, so everyone’s problem solving computer (IQ) can be tested by the same standard.

However where Gypsy makes a very good point (if I understand him) is that the problem solving IQ tests often demand is very one dimensional, while in the real life strategic situations Gypsy is interested in, we have problems within problems within problems.

So instead of the problem being clearly defined like it is on most IQ tests (how do I fit the puzzle pieces together to make an animal?) it could be something as complex as “how do I win a war?”  This is such a complex problem that you have to break it down into lots of mini-problems, and solve them in the correct sequence, while at the same time, the problem is constantly changing because your enemy is adapting to each of your moves.

German military strategist Helmuth von Moltke famously stated ““No battle plan survives contact with the enemy.”

I actually don’t think IQ tests do a very good job at capturing this kind of dynamic interactive problem solving because all of the problems on IQ tests are static and simple enough to be solved in a few minutes.  What is needed is not so much an IQ test, but an interactive IQ contest, where people compete in a cognitively demanding zero sum game where one person must outsmart the other.

I used to think chess was the ultimate test of intelligence, but its sensitivity to practice and teaching, and the fact that computers do better than people, dampened my enthusiasm.

What is needed is a version of chess that’s constantly changing, so you can’t practice it or study openings, endgames, and traps, you must constantly invent your own; because one day the board has 64 squares, the next day it has 225.  One day each side has one queen, the next day each side has eight queens etc.  Perhaps some genius could write a computer chess program where such changes would occur randomly, so whoever had the highest rating on this constantly changing version of chess, would be judged the smartest person.

But unfortunately no matter how much you altered the size of the chess board or the number of pieces, computers would probably still beat people, so what is needed is a strategy game that computers can’t outsmart us at, if it’s going to have credibility as a test of intelligence.

Share this:

  • Share on X (Opens in new window) X
  • Share on Facebook (Opens in new window) Facebook
Like Loading...

Mug of Pee’s IQ

16 Sunday Jul 2017

Posted by pumpkinperson in Uncategorized

≈ 103 Comments

Commenter Philosopher wanted to know what I think Mug of Pee’s IQ is.

On college admission tests, Mug of Pee’s IQ equivalent is as high as 160, but on actual IQ tests like the Wechsler intelligence scale which he took at age nine, I crudely estimate Mug of Pee scored 127 (after adjusting for old norms).

Now, normally when someone has a huge achievement score > IQ score gap, they are described as overachievers, because they have learned far more than their IQ would predict.  Instead of humbly accepting this label, Mug of Pee has devoted his life to denying any distinction between IQ tests and achievement tests, irrationally claiming the SAT is the best IQ test and  pretentiously dismissing actual IQ tests as “soi-disant IQ tests”.

So what is his true IQ?

In order to answer this question, we must first note that IQ tests are largely considered valid to the extent that they measure g (general intelligence).  g is simply whatever causes all cognitive abilities to positively correlate.  The g loadings of the Wechsler and the SAT in the general U.S. population are not known, but by dividing their correlations with the Raven by the Raven’s g loading, it can be estimated that the Wechsler has a g loading of 0.94 and the SAT has a g loading of 0.68.  Further, based on the fact that Dartmouth students, largely selected based on SAT scores, regressed nearly half way to the U.S. mean on the WAIS, I estimate the WAIS and SAT correlate 0.52.

Armed with these three statistics, the following regression equation can be built (hat-tip to a member of Prometheus who suggested such equations to me many years ago):

Expected g Z score = 0.8(Wechsler Z score) + 0.26(college admission test Z score)

So, since I estimate Mug of Pee has a Z score of +1.8 on the Wechsler (IQ 127) and as high as +4 on college admission tests (IQ equivalent of 160), we’ll plug those values into the equation:

Expected g Z score = 0.8(1.8) + 0.26(4)

Expected g Z score = 1.44 + 1.04

Expected g Z score = 2.48

So on a hypothetically perfect measure of psychometric g, Mug of Pee would be expected to score 2.48 standard deviations above the U.S. mean (IQ 137).  We can say with 95% certainty that his true level of g is between 129 and 145.


Share this:

  • Share on X (Opens in new window) X
  • Share on Facebook (Opens in new window) Facebook
Like Loading...

The SAT is to IQ as shadows are to height

15 Saturday Jul 2017

Posted by pumpkinperson in Uncategorized

≈ 65 Comments

shadow.PNG

Arthur Jensen noted how measuring a trait indirectly can often lead to misleading conclusions.  He compared it to measuring a person’s height by measuring the height of their shadow.  The correlation between actual height and shadow height could be extremely strong under controlled conditions, but when the position of the sun moves, the measurements become meaningless.

I think giving someone an official IQ test like the Wechsler, is somewhat analogous to measuring their height directly on a stadiometer, while giving someone the SAT is like measuring height from one’s shadow.  Because you’re not directly observing how fast one can learn like you do on many Wechsler subtests, you’re indirectly inferring it from how much they know.

Of course shadow measurements can be extremely accurate.  If everyone is measured at the same time of day,  shadow height will correlate near perfectly with actual height, and when everyone takes the SAT with a similar academic background, the SAT correlates near perfectly with general intelligence (the g factor) as found in a sample from the University omTexas at San Antonio.

.However in America, there’s a strong class divide, so you have the upper class, who studies AP algebra, geometry, calculus and Shakespeare, and then you have the lower class, who attends working class schools and is dissuaded from going to college at all.  The lower class tend not to even take the SAT, but when they do, they tend to score below their genetic potential.  For example Bill Cosby had an IQ equivalent around 80 on the SAT despite being very intelligent on an official IQ test and known for his comic wit.  Other quick comic minds from working class backgrounds who underperformed on the SAT include Rosie O’Donnell and Howard Stern.

A good analogy would be the upper class has their shadow height measured in the morning where shadows are quite long.  The lower class has their shadow height measured in the afternoon, when shadow height is quite short.  Now within each class, shadow height may correlate near perfectly with stadiometer height, just as within each class, the SAT may correlate near perfectly with official IQ.  But when the ENTIRE population is aggregated, the correlation between shadow height and stadiometer height plummets because of the class inequality, just like the correlation between SATs and official IQ scores plummet.

This explains why people who are 46 IQ points above the U.S. mean on the new SAT regress to only 21 IQ points above the U.S. mean on the Raven IQ test, suggesting the new SAT correlates 21/46 = 0.46 with the Raven in the general U.S. population.  Arthur Jensen noted that the correlation between two tests is a product of their factor loadings, so assuming the only factor the SAT and Raven share is g, then dividing their 0.46 correlation by the 0.68 g loading of the Raven tells us the SAT also has a g loading of 0.68, or roughly 0.7 if you like round numbers.

A g loading of 0.7 is not low, and tells us the SAT is a reasonable proxy for g in the general U.S. population, but it’s nowhere near the 0.9 g loading the SAT enjoys in more socioeconomically homogenous subsets of America such as students at the University of Texas at San Antonio.  This is because the general U.S. population is analogous to people having their shadow heights measured at different times of day, while the students at a given local university are analogous to students all having their shadow height measured at the same time of day, thus maximizing the correlation between shadow height and real height. 

Share this:

  • Share on X (Opens in new window) X
  • Share on Facebook (Opens in new window) Facebook
Like Loading...

Reaction norms vs independent genetic effects

05 Wednesday Jul 2017

Posted by pumpkinperson in Uncategorized

≈ 376 Comments

Commenter Mug of Pee writes:

he rots in the [Northern] california coast.

pic1

he sears/is sere and dies in the Saguaro National Park.

pic2.PNG

so [an HBDer] walks through Redwood National Park. he looks around and sees no cacti. he concludes that cacti are genetically inferior to redwoods.

he walks through Saguaro National Park. he looks around and sees no redwoods. he concludes that redwoods are genetically inferior to cacti.

Mug of Pee has been preaching the gospel of reaction norms for years and insisting that HBDers don’t grasp the concept.  I think I do, though I never heard of it until Mug of Pee mentioned it.  It was not discussed in any HBD book I read (though I’ve only read a few authors).

The Phenotype = Genotype + Environment model (independent genetic effects)

Of course I was well aware that environment affects IQ (the Flynn effect is proof of that), but my thinking was confined to the Phenotype = Genotype + Environment model which states that while the same genotype can have a very different phenotype depending on which environment it’s reared in,  the rank order of phenotypes will remain very constant regardless of which environment the genotypes are reared in, as long as they’re reared in the same one.

So for example, although environment drastically affects the heights of men and women (both sexes are much taller today than in the 19th century, and both sexes are much taller in the developed World than in the Third World) the male > female height gap remains of similar size and direction across time and place.

Reaction norm model (dependent genetic effects)

The reaction norms model is more subtle, instead arguing that genes for tallness in environment A might be genes for shortness in environment B, so while men might be taller than women in America, if those same genotypes were raised in a different country, the women might be taller than the men.

Of course in reality we don’t see this.  Men are taller than women on average in every country and time period I’m aware of, thus the sex-linked height genes would be what Mug of Pee calls “independent genetic effects”, meaning their effect on the phenotype is independent of the environment (the Phenotype = Genotype + Environment model) because no matter what environment you’re in, having a Y chromosome adds height.

You’ll be much taller if raised in 21st century Western Europe than in 19th century sub-Saharan Africa, but in both times and places, you’ll be much taller with a Y chromosome than without.  Mug of Pee concedes that physical genotypes (i.e. height genes) tend to have independent genetic effects, however he suspects that mental genotypes (IQ genes, personality genes, genes for autism and schizophrenia) have dependent genetic effects because humans are cultural creatures known for our behavioral plasticity.

Mug of Pee feels that most estimates of the heritability of IQ (whether from twin studies of Genome-wide Complex Trait Analysis) are too high because they are limited to people in the same country, and it could be that a certain genotype increases IQ all over that country, thus spuriously increasing heritability, when in another country it may decrease IQ.  To get a better estimate of heritability, Mug of Pee would like to see a study where identical twins reared apart were not just raised in different towns, but different developed countries (i.e. an American’s identical twin is raised in Japan, a Canadian’s identical twin is raised in Germany).  If this were done, Mug of Pee feels the adult IQ correlation of identical twins raised apart would drop precipitously because a genotype that intellectually benefits from one country’s language or education system might be stunted by another’s.

In support for the reaction norm model of IQ, Mug of Pee frequently cites Ashkenazi Jews who were intellectually super accomplished in the 20th century, but barely a blip on the radar screen in prior centuries.

Ability vs. success

The problem with thinking IQ follows a reaction norm model is that IQ is moderately correlated with physical traits like brain size and highly correlated with physiological abilities like the speed and consistency of complex reaction times and physical genotypes seem to have independent genetic effects.

However Mug of Pee might be half-right.  While IQ genes probably have independent genetic effects, success genes (i.e. wealth, status, power, eminence) probably follow the reaction norm model to a large degree.  So while Ashkenazi Jews may have had higher IQs than gentiles for many centuries, their achievements only surpassed those of Gentiles in the 20th century because the cultural and economic changes that occurred were both favorable to the Ashkenazi genotype and unfavourable to the Gentile genotype.

So wealth, status, and achievement genotypes may have environment dependent effects.  Billionaire Warren Buffet has stated that his brain is just wired for a certain type of thinking that happens to be valued in modern markets, but in other periods of history he would have been a loser.  So while Warren’s mathematical genotype is an independent genetic effect, his wealth genotype may be a dependent genetic effect.  Bill Maher has stated that he’s only rich because it’s a fluke to live in a society where you gain wealth by telling jokes.

So one can see how a reaction norm view of humanity would correlate with Marxism and commenter Mug of Pee is a devout Marxist.

I suspect the heritability of income, power, and status would drop much more when moving from a within country twin study to an international twin study, than the heritability of IQ would because I suspect achievement is much more culture dependent than IQ.  Nonetheless, I feel even the former variables are caused by some independent genetic effects.

Share this:

  • Share on X (Opens in new window) X
  • Share on Facebook (Opens in new window) Facebook
Like Loading...

Did Neanderthals go extinct because they weren’t smart enough to survive the cold?

04 Tuesday Jul 2017

Posted by pumpkinperson in Uncategorized

≈ 33 Comments

Neanderthals had short stocky bodies perfectly suited to the cold.  Modern humans had tall skinny bodies, terribly suited to the cold. Yet despite being at a physical disadvantage, modern humans had the intelligence to adapt the situation to their advantage.  The BBC writes:

…Neanderthals, with their shorter and stockier bodies, were actually better adapted to Europe’s colder weather than modern humans. They came to Europe long before we did, while modern humans spent most of their history in tropical African temperatures.  Paradoxically, the fact that Neanderthals were better adapted to the cold may also have contributed to their downfall.

If that sounds like a contradiction, to some extent it is.

Modern humans have leaner bodies, which were much more vulnerable to the cold. As a result, our ancestors were forced to make additional technological advances. “We developed better clothing to compensate, which ultimately gave us the edge when the climate got extremely cold [about] 30,000 years ago,”…

If this analysis is correct, it provides strong support for the cold winters theory of human population differences in IQ, because it suggests cold climates were so cognitively demanding for hominins, that not even Neanderthals, whose bodies were physically adapted to the cold, could survive when it got really cold.


Share this:

  • Share on X (Opens in new window) X
  • Share on Facebook (Opens in new window) Facebook
Like Loading...

The brain-size IQ correlation comes roaring back to life!

03 Monday Jul 2017

Posted by pumpkinperson in Uncategorized

≈ 24 Comments

During the 1990s to the early 2010s, it had become well documented the brain-size IQ correlation among adults living in developed countries was about 0.4.  Then in 2015, a meta-analysis by Jakob Pietschnig, Lars Penke, Jelte M. Wicherts, Michael Zeiler, and Martin Voracek surfaced claiming the brain size-IQ correlation was only 0.24!  The paper argued that the 0.4ish figure that was typically cited was inflated by publication bias and these authors went out of their way to counter this.

While much of the HBD-o-sphere and academic community uncritically accepted the results of this meta-analysis and routinely cited it in their articles, I was immediately suspicious and argued that failure to correct to for range restriction and other methodological problems had spuriously deflated the correlation and that the true correlation was much closer to the traditional 0.4 than to the 0.24 Pietschnig et al had reported.

Now a brand new meta-analysis by Gilles E. Gignac and Timothy C. Bates is being published in the peer reviewed journal Intelligence showing once again Pumpkin Person was right!  The authors reviewed the research cited by Pietschnig et al but corrected for range restriction, test quality, and sample quality and a 0.4 correlation was found.

Abstract below:

abstractbrain

However even 0.4 might be an underestimate of the within sex correlation between brain size and IQ because no correction was made for the fact that some samples combined men and women which lowers the correlation because men have substantially larger brains than women, yet virtually the same IQs.  The within sex correlation might be closer to 0.45.

It seems the brain-size IQ correlation is very similar to the height-weight correlation. In a sample of male university students, the heigh-weight correlation was about 0.4.  Arguably brain size is to IQ as height is to weight.  A big brain helps make you smarter just as a tall height helps make you bigger but just as large brains are only one cause of IQ, greater height is only one cause of greater size, and it’s possible for small brained people to be brilliant just as it’s possible for very short people to be huge, and vice versa.

A genetic basis for IQ?

The brain-size IQ correlation is controversial because it suggests IQ is a biological variable, which in turn suggests it’s genetic.  While IQ skeptics have been cheering the failure of genome-wide association studies to identify many genetic variants associated with IQ, they would be wise to not get their hopes up. Davies et al (2011) genotyped 3511 unrelated adults and found heritabilities of 0.44 for crystallized intelligence (acquired knowledge) and 0.51 for fluid intelligence (abstract reasoning).  Taking the square root of these heritabilities suggests the IQ phenotype-genotype correlation may exceed 0.7!  It should be noted that unlike traditional twin studies which yielded even higher numbers, genome-wide complex trait analysis only quantifies the additive portion of heritability, so the full heritability may be higher still.

Of course as commenter “Mugabe” notes, research is needed across a much wider range of environments to determine whether these are independent genetic effects.

Share this:

  • Share on X (Opens in new window) X
  • Share on Facebook (Opens in new window) Facebook
Like Loading...

Marching up the evolutionary tree

29 Thursday Jun 2017

Posted by pumpkinperson in Uncategorized

≈ 118 Comments

Scientists commonly assert that evolution is not progressive and that organisms occupying lower branches on the evolutionary tree are not anymore primitive or ancestral than organism’s occupying higher branches, because all extant life are, as journalist Peter Knudtson stated, “equivalent cases of time-tested evolutionary success”.

For example, Harvard biologist Stephen Jay Gould wrote “evolution forms a conspicuously branching bush, not a unilinear progressive sequence…earth worms and crabs are not our ancestors; they are not even ‘lower’ or less complicated than humans in any meaningful sense.”

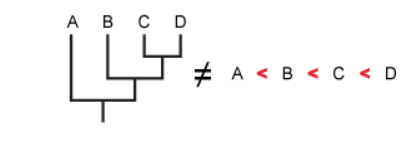
This web page even displays a helpful diagram of an evolutionary tree to debunk the idea of evolutionary progress:

It’s technically true that no extant species is precisely ancestral to humans.  It’s also true that smart, complex and impressive life forms could theoretically have split off at any point on the evolutionary tree, and that “progress” is a somewhat subjective term.  But if all extant life forms were truly equally evolved, and if lower branching life forms were in no sense ancestral to higher branching life forms,  there should be zero correlation between position on the tree, and “progressive” traits like brain size and encephalization quotient (ratio of brain size to expected brain size for body size).

In order to test this hypothesis, I decided to compare degree of branching on the evolutionary tree (which I defined as number of splits on the tree before a given taxa splits off) and brain size/enchephalization, in 1) three major kingdoms of life, 2) four major animal groups, 3) five major higher primate groups, 4) four species of the genus homo, and 5) nine populations of modern humans.

For each of these samples, the Pearson correlation coefficient (r) was computed.  Such correlations can range from -1.0 (an increase in X perfectly predicts a decrease in Y, and vice versa) to +1.0 (an increase in X perfectly predicts an increase in Y, and vice versa).  If evolution is progressive, we’d expect most of the correlations to fall between 0 and +1.0.  If evolution is regressive, we’d expect most of the correlations to fall between 0 and -1.0.  If evolution were neither progressive nor regressive, we’d expect a mix of positive and negative correlations, averaging out to roughly zero.

What I actually found was that all the correlations were positive, ranging from +0.5 to about +1.0.

Correlation between number of splits and encephalization among kingdoms: +0.5

The following tree shows that plants, animals and fungi are all descended from a common ancestor.  That lineage split into plants (on the left) and non-plants (on the right) and then the non-plant branch splits again into animals and fungi. So plants are descended from one split, but animals and fungi are descended from two.

kingdomlife

Notice how animals, which are descended from two splits have a brain (averaging an encephalization quotient of about 0.5), but plants which are descended from only one split, do not.  This implies a positive correlation between number of splits and intelligence, but since brainless fungi are also descended from two splits, the correlation is only moderate: +0.5.

complete1

Correlation between number of splits and encephalization among four major animal groups: +0.9

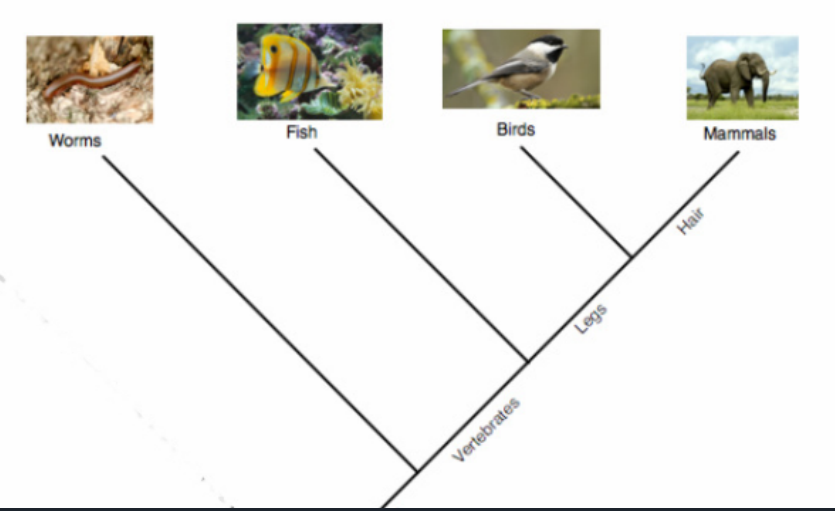
Now among animals, in the below tree, worms are descended from one split, fish are descended from two, and birds and mammals are descended from three.

classes

Because mammals have an average encephalization quotient (EQ)  of 1.0,  birds average EQs of 0.75, fish have EQs of 0.05, and worms have unknown EQs, but probably about 0.01, the correlation between EQ and number of splits among major animal groups in the above tree is an astonishing +0.9!

complete2

Correlation between brain size and number of splits among five major higher primates

Just from looking at the below two images, it should be obvious that there’s a positive correlation between primate brain size and number of splits on the hominoidea evolutionary tree.

hominoid
primatebrain

As shown below, the correlation between a primate group’s brain size and its branching on the evolutionary tree is +0.67.

complete3

Correlation between brain size and number of splits among four species in the genus homo

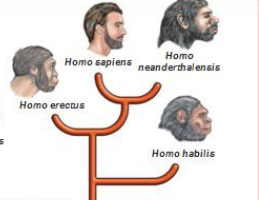
Wikipedia states that Homo habilis (descended from one split in the below tree) had a brain size of 610 cm3 , Homo erectus (descended from two splits) had a brain size of 1093 cm3 and that modern humans and Neanderthals (both descended from three splits) have brain sizes of 1497 cm3 and 1427 cm3 respectively.

This results in an astonishing +0.995 correlation between brain size and number of splits:

complete4

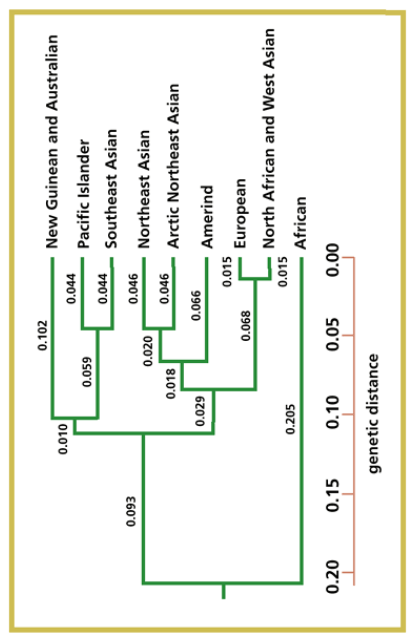
Correlation between brain size and number of splits among nine modern human populations: +0.71

Lastly, I decided to explore the correlation between brain size and number of splits among nine modern human populations using brain size data from Richard Lynn, which he adapted from Smith and Beals (1990).

distance
Genetic distance tree by Cavalli-Sforza
beals
From Race Differences in Intelligence (2006) by Richard Lynn

Plotting the average brain size of each “race” as a function of number of splits before it branched off of Cavalli-Sforza’s tree gives a potent +0.71 correlation, suggesting that ancient splitting-off dates explain 50% of the variation in racial brain size.

complete5

Interpreting the results

The above correlation between brain size/encephalization and number of splits on the evolutionary tree, are all positive, and in some cases, extremely strong, suggesting 1) evolution is progressive, 2) some extant organisms are more evolved than others, 3) organisms that branch off the evolutionary tree prematurely, and don’t do anymore branching, tend to resemble the common ancestor of said tree.

Although the preliminary evidence I document here is strong, more research is needed because the choice of trees I decided to analyze was not random and one can imagine how a different set of trees might not produce such high correlations.  While I tried to find trees that compared taxa of relatively equal rank (i.e. comparing species with species within the same genus, or comparing race with race within the same species) many of the groupings are arbitrary, and the decision to lump or split various groups can result in fewer or more splits in the evolutionary trees and thus it’s crucial that these decisions are made based on objective criteria.

Nonetheless the fact that trees made by other people, who made them without considering the brains of the taxa, still correlated so consistently with brain size/encephalization, is compelling.

Explaining the trend

But if evolution is progressive, the question is why?  Stephen Jay Gould claimed that any trend towards complexity is merely an artifact of the fact that life started extremely simple, and had nowhere to go but up, so random variation in all directions will be progressive merely because there’s a floor on how simple life can get.  And yet there’s no floor on how small a brain can get, but I have yet to find a single phylogenetic tree where encephalization is negatively correlated with number of splits, and while such trees undoubtedly exist, they are conspicuously rare.  Thus an additional explanation for evolutionary progress is that because intelligence allows organisms to adapt behaviorally instead of genetically, it’s more efficient than evolving new traits every time the environment changes, and thus it tends to be highly favoured by natural selection.

An ancient tradition

Although the notion of evolutionary progress is today often dismissed as pseudoscience, it has a rich intellectual history that predates even the theory of evolution itself by over two millennia.

aristotle
Aristotle

As J.P. Rushton noted, Aristotle suggested a scala naturae in which animals > plants > inanimate objects.   One of the most important ideas in Western thought,  Aristotle viewed higher ranked organisms as more perfect, God-like and rational.  The great Greek philosopher stated:

Now some simply like plants accomplish their reproduction according to the seasons; others take trouble as well to complete the nourishing of their young, but once accomplished they separate from them and have no further association;  but those that have the understanding and possess some memory continue the association, and have a more social relationship with their offspring.

Over 2000 years later this would be roughly known as the r/K scale where K selected organisms have lower reproduction rates, but higher survival rates, investing in more parenting than reproducing, while r selected organisms do the opposite.

rk

Although r/K theory (and its applications to humans) has been severely criticised, it remains undeniable that regardless of its selective agents, there is an evolutionary trade-off between high quantity and high quality offspring and different organisms fall at different points on this continuum.

Modern theories of evolutionary progress

E.O. Wilson, the co-father of the r/K scale believed evolution was progressive dividing life’s history into four major stages:

(1) the emergence of life itself in the form of primitive prokaryotes with no nucleus

(2) the emergence of eukaryotes with nucleus and mitochondria

(3) the evolution of large multicellular organisms that have complex organs like eyes and brains

(4) the emergence of the human mind

Princeton biology professor John Bonner noted that there’s been an evolution from primitive bacteria billions of years ago to complex life forms today, and the newer animals have bigger brains than older animals and that it’s perfectly natural to say that older life forms are lower than newer life forms, because their fossils are literally found in lower strata. Even plants can be ranked he argued; angiosperm > slime molds.

Paleontologist Dale Russel noted that the mean encephalization of mammals had tripled in the last 65 million years and that the mean encephalization of dinosaurs steadily increased for over 140 million years.  Extrapolating from the latter trend, Russel argued that had dinosaurs not gone extinct 65 million years ago, they would have eventually evolved into big-brained bipeds.

dinosaur

While the specific humanoid form Russell imagined was highly speculative, the increase in encephalization seems quite plausible.

Inspired by such thinkers, in 1989 J.P. Rushton argued that archaic forms of the three main races (Negroids, Caucasoids, and Mongoloids) differed in antiquity, with newer races being more K selected than older races, though Rushton’s model has excited enormous criticism.

Share this:

  • Share on X (Opens in new window) X
  • Share on Facebook (Opens in new window) Facebook
Like Loading...
← Older posts
Newer posts →

contact pumpkinperson at easiestquestion@hotmail.ca

  1. pumpkinperson's avatar
    pumpkinperson on Brain the size of a basketball?July 25, 2026

    Anything can adapt if the situation is simple enough. But my chemistry teacher's definition defines adapt as "take WHATEVER situation…

  2. James Peach's avatar
    James Peach on Brain the size of a basketball?July 24, 2026

    We also have to make the distinction between simple and complex mistakes. Kids make mistakes all the time but they…

  3. James Peach's avatar
    James Peach on Brain the size of a basketball?July 24, 2026

    Adaptation cannot fully express the true definition of intelligence. Anything can adapt if the situation is simple enough. In the…

  4. James Peach's avatar
    James Peach on Brain the size of a basketball?July 24, 2026

    The way reaction norms are presented. If you took plant seeds from everywhere on the planet and distributed them randomly…

  5. James Peach's avatar
    James Peach on Brain the size of a basketball?July 23, 2026

    There is a great amount of nutritional information that the general population does not have access to. In my life…

Recent Comments

pumpkinperson's avatarpumpkinperson on Brain the size of a baske…
James Peach's avatarJames Peach on Brain the size of a baske…
pumpkinperson's avatarpumpkinperson on Brain the size of a baske…
God's Word's avatarGod's Word on Brain the size of a baske…
Anime's avatarAnime on Brain the size of a baske…

Archives

  • June 2026
  • May 2026
  • January 2026
  • December 2025
  • November 2025
  • October 2025
  • September 2025
  • August 2025
  • July 2025
  • June 2025
  • May 2025
  • April 2025
  • March 2025
  • February 2025
  • January 2025
  • December 2024
  • November 2024
  • October 2024
  • September 2024
  • August 2024
  • July 2024
  • June 2024
  • May 2024
  • April 2024
  • March 2024
  • February 2024
  • January 2024
  • December 2023
  • November 2023
  • October 2023
  • September 2023
  • August 2023
  • July 2023
  • June 2023
  • May 2023
  • April 2023
  • March 2023
  • February 2023
  • January 2023
  • December 2022
  • November 2022
  • October 2022
  • September 2022
  • August 2022
  • July 2022
  • June 2022
  • May 2022
  • April 2022
  • March 2022
  • February 2022
  • January 2022
  • December 2021
  • November 2021
  • October 2021
  • September 2021
  • August 2021
  • July 2021
  • June 2021
  • May 2021
  • April 2021
  • March 2021
  • February 2021
  • January 2021
  • December 2020
  • November 2020
  • October 2020
  • September 2020
  • August 2020
  • July 2020
  • May 2020
  • April 2020
  • March 2020
  • February 2020
  • January 2020
  • December 2019
  • November 2019
  • October 2019
  • September 2019
  • August 2019
  • July 2019
  • June 2019
  • May 2019
  • April 2019
  • March 2019
  • February 2019
  • January 2019
  • December 2018
  • November 2018
  • October 2018
  • September 2018
  • August 2018
  • July 2018
  • June 2018
  • May 2018
  • April 2018
  • March 2018
  • February 2018
  • January 2018
  • December 2017
  • November 2017
  • October 2017
  • September 2017
  • August 2017
  • July 2017
  • June 2017
  • May 2017
  • April 2017
  • March 2017
  • February 2017
  • January 2017
  • December 2016
  • November 2016
  • October 2016
  • September 2016
  • August 2016
  • June 2016
  • February 2016
  • January 2016
  • November 2015
  • May 2015
  • January 2015
  • December 2014
  • November 2014
  • October 2014

Categories

  • ethnicity
  • heritability
  • income
  • Oprah
  • Uncategorized

Meta

  • Create account
  • Log in
  • Entries feed
  • Comments feed
  • WordPress.com
  1. pumpkinperson's avatar
    pumpkinperson on Brain the size of a basketball?July 25, 2026

    Anything can adapt if the situation is simple enough. But my chemistry teacher's definition defines adapt as "take WHATEVER situation…

  2. James Peach's avatar
    James Peach on Brain the size of a basketball?July 24, 2026

    We also have to make the distinction between simple and complex mistakes. Kids make mistakes all the time but they…

  3. James Peach's avatar
    James Peach on Brain the size of a basketball?July 24, 2026

    Adaptation cannot fully express the true definition of intelligence. Anything can adapt if the situation is simple enough. In the…

  4. James Peach's avatar
    James Peach on Brain the size of a basketball?July 24, 2026

    The way reaction norms are presented. If you took plant seeds from everywhere on the planet and distributed them randomly…

  5. James Peach's avatar
    James Peach on Brain the size of a basketball?July 23, 2026

    There is a great amount of nutritional information that the general population does not have access to. In my life…

Blog at WordPress.com.

Privacy & Cookies: This site uses cookies. By continuing to use this website, you agree to their use.
To find out more, including how to control cookies, see here: Cookie Policy
  • Subscribe Subscribed
    • Pumpkin Person
    • Join 668 other subscribers
    • Already have a WordPress.com account? Log in now.
    • Pumpkin Person
    • Subscribe Subscribed
    • Sign up
    • Log in
    • Report this content
    • View site in Reader
    • Manage subscriptions
    • Collapse this bar
Loading Comments...
%d