On page 242 of his book Are We Getting Smarter?, James Flynn claims the original Wechsler Intelligence Scale (WISC) normed circa 1947.5 yields full-scale IQs 7.63 points higher than those of its revision (WISC-R) normed in 1972. Stats like that are known as the Flynn effect; the notion that IQ is going up at rate of 3 points per decade. Of course by definition the average U.S./U.K. IQ is always around 100, but tests must be constantly re-normed to keep it that way.
However I have long suspected (and largely proven) that the Flynn effect is exaggerated by a statistical artifact. For example, when comparing old and new versions of the Wechsler, half of the test subjects will take the old version first and the other half will take the new version first, so whatever practice effect from being tested twice affects both tests equally. However I had a hunch (as had A.S. Kaufman) that you get more of a practice effect from taking the WISC-R first than from taking the WISC first, thus WISC scores will be spuriously high when people take both tests.
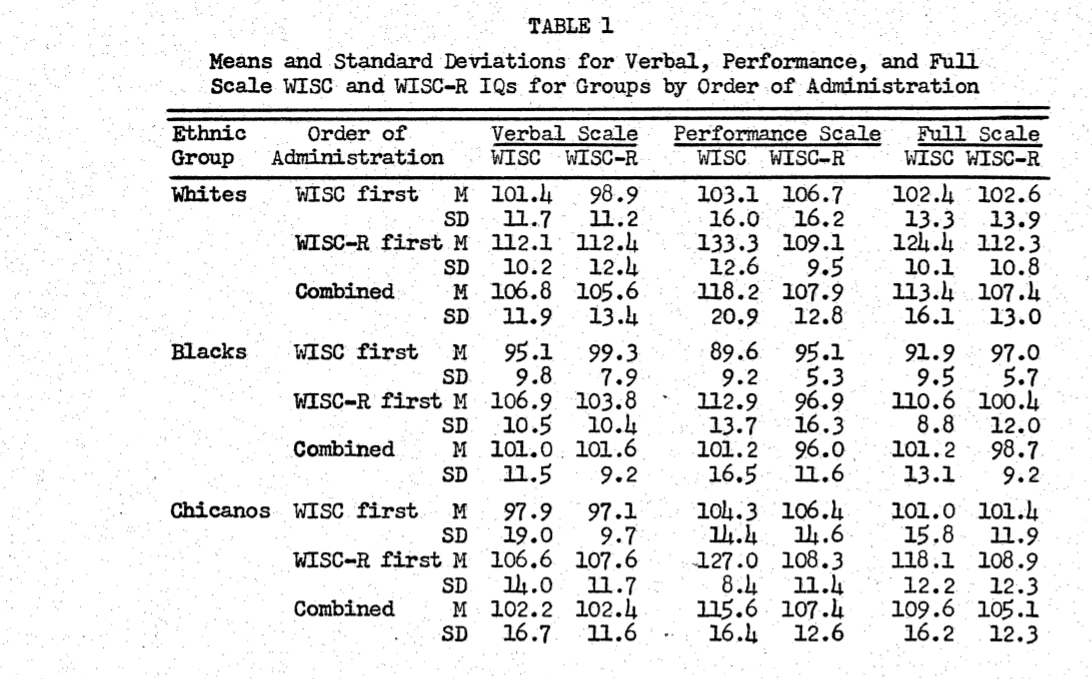
Finally I found some obscure old paper that proves this right. White kids who took the WISC-R first scored 12 points higher on the WISC than WISC-R, but white kids who took the WISC first scored virtually the same on both tests! When you combine the two groups together, the WISC appears 6 points easier than the WISC-R, but that difference is entirely driven by the subset of the sample that took the WISC-R first
A similar (though less extreme pattern) is found for non-whites.
The recent revelations that Bill Gates had some kind of mysterious relationship with Jeffrey Epstein has caused me stress. Gates has been a hero of mine since childhood. He represented everything that I admired (computer nerds, rich people, super high IQ) and he came of age at a time in America full of promise and wonder. Every Autumn, when the leaves changed colours, I would pick up Forbes annual list of the 400 richest Americans, and there he was, reliably in the #1 spot for decades. No one else could even come close.
As a teenager I used to wonder, “if intelligence is the ability to adapt, and if nerds are the smartest people, why isn’t the World run by nerds?” The answer seemed to be that nerds are interested in nerdy things which often don’t provide much money or status. But Gates was the ultimate exception. The one super high IQ nerd who decided to play the same game as everyone else, and in the words of one Promethean “look at the result”.
Reported to have an IQ of 170 (if you trust the SAT) Gates was literally more than 2 standard deviations smarter than the average U.S. president or billionaire who in turn were more than 2 standard deviations above the average American. And he totally lived up to it, becoming the World’s first centibillionaire more than 20 years before Jeff Bezos would become the second one. By the end of the 1990s his absurdly high wealth and IQ made him like some Revenge of the Nerds comic book villain that only the U.S. government could stop. Some say even today he is the World’s richest man if you look at real wealth, not stock value.
In the words of my sociology professor “Gates took the system, and beat the living shit out of it.”
And that’s why it so sad to see Gates so publicly linked to Jeffrey Epstein and even sadder to see him stumble when asked about it.
What was Gates doing with the hebephile fake billionaire? What were so many rich, famous, and important people doing with him?
According to Israeli-Canadian Ari Ben-Menashe, when Bill Clinton was elected President, people were very concerned he’d be another Jimmy Carter and have sympathy for the Palestinians, and so Epstein was hired to set honey traps that could be used to blackmail him. Epstein impersonated a billionaire investor and girlfriend Ghislaine Maxwell’s job was to use her connections to bring in celebs like Prince Andrew to give him credibility.
Armed with fake money AND status, Epstein could get people like Clinton to attend his parties and perhaps by plying him with alcohol poured by underage girls while hidden cameras filmed, they hoped they could get Clinton on tape behaving inappropriately.
Did Epstein try the same thing with Gates?
What really bothers me about all this is that Gates is supposed to be a super Genius who dominates other elites like Epstein. I would hate to think someone seemingly as brilliant as Gates (or Clinton for that matter) was dumb enough to fall for a honey trap and that it was used to control him. So far there’s no evidence of that but this is not a good look.
My coworkers and I just watched this movie on CRAVE and I was really impressed with it.
The plot: A 17-year-old girl (Autumn) and her same-age cousin (Skylar) take a bus to New York city because their working class white Rustbelt town doesn’t allow her to get an abortion without parental consent. After getting the abortion, they spend the night bowling and singing karaoke with a boy who gives them enough cash to buy a bus ticket back home.
The End.
That’s literally all that happens, and yet it’s one of the most powerful films I’ve ever seen. It just feels so real, like you’re watching a documentary. The actors all look like ordinary people, the scenes are all in everyday locations like grocery stores, buses, bowling alleys and medical clinics with fluorescent lighting, and minimal dialogue. Indeed the film’s protagonist hardly speaks and when asked questions, gives one word answers. The only time she comes alive is when she’s singing.
We never really learn who got her pregnant but it doesn’t matter. Every male in the film, from the bullies at their school, to their uncompassionate grocery store boss, to the old man customer at the grocery store, to her own father, comes across as a predator.
“Girl child isn’t safe in a World full of men,” Oprah once said.
Even after leaving their lower class town, it doesn’t stop. While on a bus in New York city a man in a business suit stands looking at them, and then unzips his pants to masturbate.
Finally they meet an innocent looking guy around their age who romantically sings Cherokee to Skylar.
Sadly, even he just wants to ply Skylar with alcohol and take sexual advantage.
By the end of the night he gets Skylar against a circular brick pillar and starts kissing her. What neither of them know is that behind the pillar is Autumn. In an especially poignant scene, Autumn reaches for Sylar’s hand and simply locks pinky fingers with her, as if to say “I’m here for you, and I feel your pain”.
And that was what they’ll remember of their big trip to New York city, as they take the long bus ride back to Pennsylvania…
In 1959, a comprehensive study of Jewish American intelligence was published by B.M. Levinson in the Journal of Clinical Psychology. The subjects were “candidates for admission to the kindergarten or first grade of day (Yeshiva) schools and ranged in age from four years six months to six years seven months.”
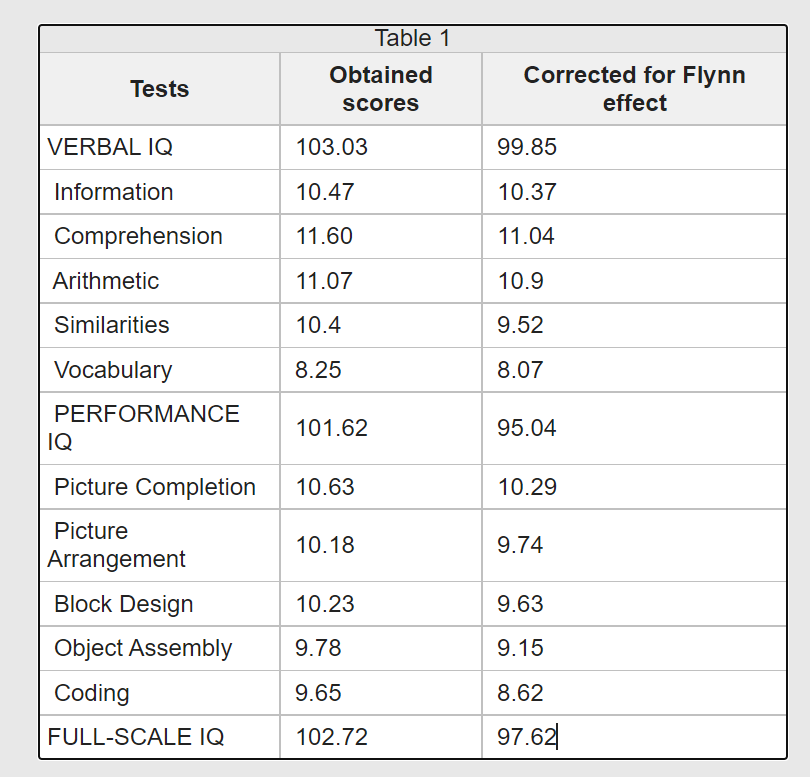
Below are the scores of the kids on the Wechsler Intelligence Scale for Children (WISC). Because the WISC was normed circa 1947.5 and this study was published in 1959, in the third column I adjusted the scores for norm inflation.
MONOLINGUAL KIDS
Flynn effect was adjusted for using page 241 of James Flynn’s Are We Getting Smarter? (2012). The yearly rate of increase was inferred from the gains made from 1947.5 (WISC) to 1972 (WISC-R) except in the case of Similarities where Flynn is suspected of overestimating gains (Kaufman, 2010). For this subtest, the rate from 1972 to 1989 was assumed instead.
BILINGUAL KIDS
After adjusting for the Flynn effect, the monolingual kids averaged a verbal IQ of 106 and the bilingual averaged 99, suggesting a verbal IQ of 103 for the combined sample.
For Performance IQ, the monolinguals averaged 101 and bilinguals averaged 95, for an overall average of 98.
On full-scale IQ the monolinguals averaged 104 and bilinguals averaged 98, for an overall group average of 101.
Although this study confirms the verbal > performance IQ pattern that Jewish intelligence is known for, the scores are not as high as usually reported. There are several reasons for this:
The original WISC excluded non-whites from their norming sample so an IQ of 100 represents the average score of just white America, not America as a whole. Their scores would have been a couple points higher using norms for the entire U.S. population.
Roughly half the sample was bilingual and these may have been unfairly penalized by language barriers (their lowest score was Vocabulary). They may also have been raised bilingual for religious reasons, suggesting low IQ heritage.
Finally, the subjects were young children. Daniel Seligman writes: “Some studies show rising verbal scores as the Jewish children pass through school but the reasons for this increase are unclear. Some scholars view it as a maturational change, that is, the group is genetically programmed to improve its already superior verbal skills with age.” (source: A Question of Intelligence by D. Seligman, pg 131)
Although the Raven Matrices is a visual test, thus making it potentially biased against Jewish verbal talent, it’s not an especially spatial test either, and seems to load on a higher level abstract thinking that transcends both domains. Indeed Jensen regarded the Raven as the purest measure of g (general intelligence).
One major Israeli study using the Raven was published by S Kaniel & S Fisherman in 1990. They compared 250 Ethiopian Jews, ages 14-15, on the Progressive Matrices Standard (PMS) test to1740 Israeli Jews, ages 9-15. They claimed “Most of the Israeli age groups functioned near the 50th percentile of Raven’s normative scale, whereas the performance of the Ethiopian Jews fell between the 5th and the 10th percentile”
However Richard Lynn was having none of it. In a 1994 commentary, Lynn noted that the that the actual percentiles of the Israeli Jews ranged from 20th to 37th and the Ethiopian Jews were at the 2nd percentile.
Source: Lynn, R. (1994). The intelligence of ethiopian immigrant and israeli adolescents: A comment on kaniel and fisherman. International Journal of Psychology, 29(1), 55–56. doi:10.1080/00207599408246531
Over the weekend Pumpkin Person verified that the Israeli Jews did indeed score from the 20th to 37th percentile on 1979 UK norms just as Lynn claimed (IQ 87 at age 10.5 to IQ 95 at age 14.5; averaging across all ages, IQ 92), however Ethiopian Jews actually scored in the 1st percentile (IQ 65) not the 2nd percentile as Lynn had claimed.
Although the British norms were 11-years old by the time the Israeli study was published, I decided not to adjust for the Flynn effect because “Anglo” kids tested in Iowa in 1986, scored no higher than the UK 1979 norming, suggesting the Flynn effect had plateaued during that period.
If Israeli Jews average IQ 92 on the Raven, it is interesting to ask what Ashkenazi Israeli Jews score. An analysis by Hanna David and Richard Lynn found that in Israel, European Jews score about 14 IQ points higher than Oriental Jews though the gap is bigger on verbal tests. For example on the Israeli WISC, the gap was 1.1 standard deviations (SD) (17 IQ points) on verbal IQ but only 0.93 SD on Performance IQ (14 IQ points).
So let’s say on the Raven, Ashkenazi Jews score 14 IQ points above non-Ashkenzi Jews in Israel, and are 32% of Israeli Jews. Since the average Israel Jews scores IQ 92 on the Raven (if the above study was representative), then simple arithmetic tells us that non-Ashkenazi IQ is 88 and Ashkenazi IQ is 102 (at least on the Raven) though looking at table I, there might be a small tendency for Jewish IQ to improve during childhood.
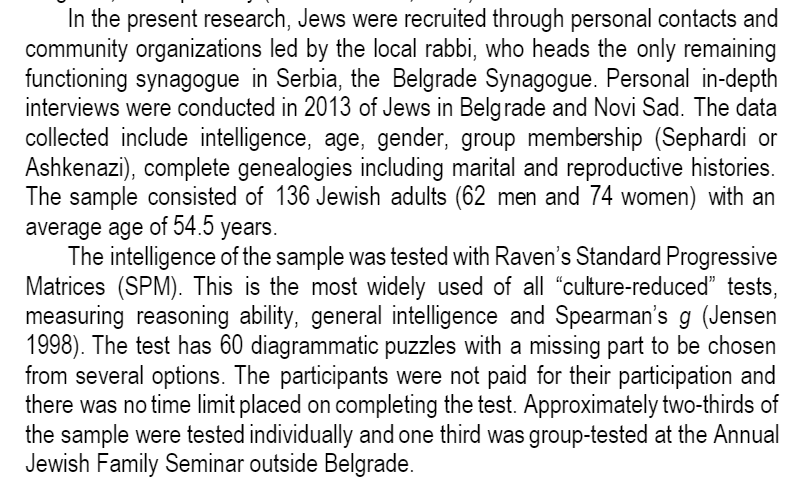
In 2015, the journal Mankind Quarterly published a study called The Intelligence of Ashkenazi and Sephardi Jews inSerbia by Richard Lynn and Jelena Čvorović.
The authors write:
They shouldn’t mix individually tested people with group-tested people since the latter score higher on the Raven.
They write:
An average IQ of 104 (white norms) is much lower than the 110 IQ Ashkenazim score in the United States, but considering Serbia has an average IQ of 90, it is quite high for that environment. And given how well integrated the Ashkenazim and Sephardim are in Serbia, even the self-identified Ashkenazim might be somewhat mixed.
In 1992 the journal Psychological Reports published an interesting paper called “JEWISH INMATES: AN ATYPICAL PRISON GROUP” by DONALD I. TEMPLER and PENNY A. JACKSON
The study design was as follows:
All inmates were in the Southern Desert Correctional Center, a medium security prison in whch most convicted felons in the southern half of Nevada are processed and incarcerated. The identities of the 13 Jewish inmates were obtained from prison records and word of mouth; it appears that these men constituted the total population of Jewish inmates. The quantitative part of this study focused upon two different sorts of information in the records of inmates. One was Raven’s Standard Progressive Matrices percentile based on norms in Table SPM 25 of the manual (Raven, Court, & Raven, 1986). Because Jews in general tend to score higher than non-Jews on tests of mental ability, it was hypothesized that Jewish inmates would have higher scores on the matrices thin non-Jewish inmates. It was also hypothesized that Jewish inmates would have fewer violent crimes.
The unstructured interviews were held with a Jewish custody staff Lieutenant, a Jewish Correctional Case Worker Supervisor, and 10 of the 13 Jewish inmates. In addition, a director of a half-way house for the Jewish exfelons in Los Angeles was interviewed by telephone.
Here are the results:
One of the Jewish inmates did not have a Raven’s score or percentile in his records. For the 12 Jewish men who did, nine (75%) were over the 80th percentile of the Matrices manual, but only 27% of the 1477 general population inmates were over the 80th percentile (x2 = 14.03, p< 0.001). Four (31%) of the 13 Jewish inmates and 578 (52%) of the 1477 general population inmates had one or more violent felony convictions (x2 = 2.35, p<0.20).
The 80th percentile is IQ 113 (white norms) so assuming a normal curve and a standard deviation of about 15 for both the Jewish and Gentile inmates, these results suggest the average Jewish prisoner scored IQ 123 and the average Gentile prisoner scored 104.
However the Raven norms were probably about 50 years too old, and it’s well known that Raven ability increased precipitously over the 20th century because of prenatal nutrition and/or schooling (the Flynn effect). It’s also well known that prisoners average IQs around 90. So let’s say the scores were inflated by about 14 IQ points. This would suggest Jewish prisoners have a mean IQ of 109 (19 points higher than their Gentile counterparts!).
Of course with only 12 Jews in the study, one shouldn’t overinterpret these results.
The study is also odd because the Jewish IQ advantage is seen on a non-verbal test where Jews typically have less of an advantage. On the other hand, the Raven aimed to measure higher level conceptual abstract ability that transcends the traditional verbal vs spatial dichotomy.
The authors noted that the Jewish prisoners did not strongly identify with Judaism and had middle class backgrounds. They also showed high achievement motivation.
The authors write:
The reason(s) the Jewish inmates scored higher on the Raven Matrices are not certain. Nevertheless, it should be pointed out that the test is a nonverbal and purported culture-fair test with content that appears less relevant to formal education than most standard tests of intelligence. Further, Jewish culture is heavily saturated with verbal learning and performance. A large number of Jews do not enter occupations dependent on spatial relations such as those of machinists, mechanics, draftsmen, and mechanical engineers. To ascribe automatically the high Raven scores entirely to education of high quality or ephemeral characteristics would be simplistic and is unwarranted at this time.
On the other hand, one of the reasons the Raven has been so sensitive to the Flynn effect is that scores likely can be propped up by education. This seems counter-intuitive because the test is so culturally reduced, but because there’s no time limit and the task is so abstract, educated people likely approach the test with much more confidence, interest, and persistence. By contrast gypsies, who have a subculture quite opposite from Jews when it comes to education, typically dropping out of school in 8th grade, have adult Raven IQs around 70 and complain that it gives them a headache. It would be most interesting to compare the IQs of Roma raised by Ashkenazim and vice versa.
I recently got an email from a very big brained (literally) PhD student who wanted to know his IQ. Based on your education, estimated brain size, and ethnic background, I estimated you would score 119 on an IQ test (or the equivalent on a college admission test).
However I didn’t need to estimate because you had already told me what your scores were. You “took the SAT twice in 2006 and scored 680V/660Q the first time and a 720V/630Q the second time.”
In the early 2000s, I estimate IQ = 23.835 + 0.081(SAT score), so these were the equivalent of scoring IQ132 and 133 respectively (U.S. norms).
You also say “I took the IQtest.dk, which is essentially a Raven’s progressive matrices test, in high school and got a 124.” The problem is I don’t know if IQtest.dk has valid norms.
You also state:
I’ve taken the GRE a few times and my score in 2010 was 630V/650Q. I took a practice test years later and scored 163V/155Q. After studying for a couple of months, I took the GRE two more times and was able to get a 170V/152Q/4A the first time and a 169V/161Q/4.5A the second.
So your combined (V + Q) scores on the new GRE (318 to 330) seem to equate to an IQ of 134 to 145! This is considerably higher than your IQ as derived from the SAT even though both tests measure similar skills (reading & math). I wonder if most people score higher on the GRE than the SAT because university is inflating their scores beyond their true ability.
You also state:
I took the online Wonderlic when I was in my early 20s and got a 31 on it. I took it again last year and got a 30.
This fits with my suggestion that thirty-somethings deserve a 1 point age bonus on the Wonderlic. A score of 31 = IQ 118 (remarkably close to what I estimated from your education and brain size, but now I’m just data mining)
You also write:
I’ve also recently taken the Open-psychometrics IQ test and scored a 137 Verbal/134 Spatial/121 Memory with a calculated 127 Full-scale IQ. The designers claim the norming is based on scores from proctored IQ tests and admissions test scores of users. I also took Antjuan Finch’s SAT/IQ test and I scored a 30/30 on the verbal section and, I believe, a 26/30 on the Quantitative.
I don’t recall Antjuan having a quantitative test (maybe you mean his non-verbal test).
Conclusion:
Assuming full disclosure, your test scores range from 118 (wonderlic) to about 140 (the mid-point of your GREs). Assuming these two tests correlate about 0.8 if the general U.S. population took both, this suggests a composite IQ of 131. This is 11 points higher than expected for a black American PhD with an assumed 1534 cc brain size.
But then your background is far more elite than the average black American’s. You write:
My parents are black African immigrants. My dad doesn’t have a formal college education but learned about computers on his own/on the job as they were becoming more important for business infrastructure and joined the IT revolution at the ground floor. When he retired, he was a director of IT at a cybersecurity company.
My mother has a community college degree in nursing but decided to focus on being a stay-at-home mother rather than having a job. When my brother and I were old enough to watch ourselves, she began to take on new jobs which she excelled at. Her jobs have included being a computer lab instructor for my school (not computer science, just teaching proper operation and security for them), a small business owner (though the 2008 financial crisis hit us hard), and an interior designer/event planner. She also manages our family’s finances. You’ll probably get a kick out of this: people have actually talked about getting a very Oprah-esque vibe from her.
I have been reading your blog off-and-on for the last 5-6 years and I’ve seen that you’ve started to estimate reader IQs from their histories and test scores and I was curious what you would estimate mine to be. I’ve written a history that I think contains the majority of the most pertinent information for your approximation. I’m sorry if I wrote too much but I wanted to give as much information as possible.
Biography: I am black male in my early 30s who is currently in his 4th year of a PhD program in psychology (my program is not elite at all and is roughly #100 in the US grad school ranking for my field) after getting my BA in the same from a top 60 college. I grew up upper-middle class and have lived in multiple countries but am mono-lingual and have spent most of my life in the US. I could read the bible at the age of 5 and I was able to read at a college level by the time I was in middle school. My math ability has lagged behind notably, however. I was better than most of my peers at math but I was not truly exceptional by any means. My family is religious but I have been an atheist since I was 14.
About 520,000 black Americans become old enough to get a PhD every year, but of these, only 2,512, did so in 2019. This puts the median black PhD in the top 1,256, or one in 414 level (+2.8 SD level). Assuming a 0.68 correlation between IQ and years of education, we’d expect your IQ to be 0.68(+2.8 SD) = +1.9 SD above the black mean.
Given that U.S. blacks have a mean WAIS-IV IQ of 87.7 with an SD 14.4 (U.S. norms), +1.9 SD = IQ 115.
According to page 374 of Charles Murray’s Coming Apart, blacks with PhDs or professional degrees average IQ 112.2 (U.S. norms)
You also write:
Physical characteristics and health: I am 5’10 and my head circumference is around 60.5cm. I think this should be taken with a grain of salt though since my head is very long and fairly narrow which should deflate actual brain volume. I was very overweight until I was around 20 years old at which point, I lost a lot of weight and have vacillated between 160-185 since and am roughly 180lbs right now. I have a history of depression and anxiety and have diagnosed epilepsy.
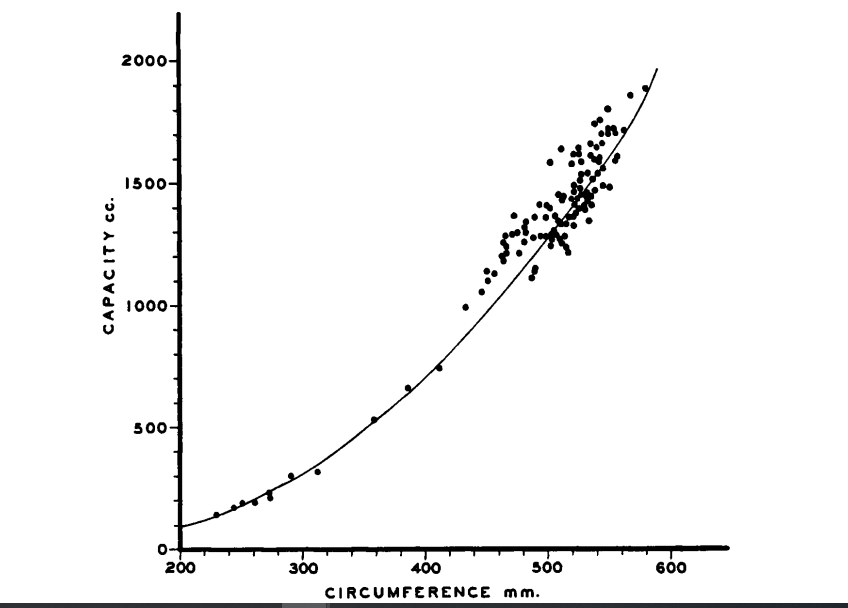
605 mm circumference implies a 192.5 mm cranial diameter, however because your circumference was measured in-vivo, I subtract 11 mm for fat and skin around the skull. This reduces it to 181.5 mm which implies a true circumference of 570.2 mm. Below is the curve predicting brain size from head circumference:
Source: Figue 3 in Jørgensen, J. B., & Quaade, F. (1956). External cranial volume as an estimate of cranial capacity. American Journal of Physical Anthropology, 14(4), 661–664.
The above curve predicts you’d have a cranial capacity of about 1676 cc according to an equation I created from said curve:
However because of ethnic and gender differences in head shape, I would multiply this figure by 0.915, reducing it to 1534 cc. This is still over 227 cc above the mean for young black men circa 1980 and probably about 174 cc above young black men today, putting you in the 97 percentile (+1.91 SD). Such a large brain may help explain your epilepsy because of the enhanced electrical activity.
Assuming a 0.4 correlation between IQ and within-sex brain size, this predicts an IQ of 0.4(+1.9) = +0.76 SD above the black mean, or IQ 99.
Conclusion:
Estimated IQ of black American PhD: 115
Estimated IQ of black American with very large (1534 cc) brain size: 99
Estimated IQ of black American with both: 119
So 119 would be what I’d expect based on your two most salient biodemographic IQ correlates, but in part 2 we’ll discuss your actual test scores and see how close this prediction comes.
In his book The g Factor (pg 169), Arthur Jensen wrote:
The broad heritability of IQ is about 0.40 to 0.50 when measured in children, about 0.60 to 0.70 in adolescents and young adults, and approaches 0.80 in later maturity.
…the default hypothesis, is that genetic and cultural factors carry the exact same weight in causing the mean Black–White difference in IQ as they do in causing individual differences in IQ, about 80% genetic–20% environmental by adulthood.
Elsewhere they write:
Jensen (1998) demonstrated that Black-White IQ differences typically increase with age (because genetic influences become stronger over the life span). He used Shuey’s (1966) compendium to document that the average Black-White difference was 0.70 standard deviations in early childhood, 1.00 standard deviations in middle childhood, and 1.20 standard deviations in early adulthood…
…Until the results of several such studies allow reassessment of the situation, the best estimate of Black-White convergence over the past 100 years is between 0 and 3.44 IQ points—a maximum effect size of 0.23—well within the predictions of our estimated heritability of .80 for the Black-White g difference in the United States.
Rushton & Jensen seem to be saying that because IQ is only 20% environmental (among U.S. whites), the 15 to 18 IQ point black-white U.S. IQ gap could at most, only be expected to close by 20% (3 to 3.6 points), thus reducing the gap to only 12 to 14.4 points .
One problem with this theory is that 80% means the proportion of IQ variance explained by genes so you need to take the square root to get the regression line predicting genetic IQ from phenotypic IQ which means differences would actually be 90% genetic, allowing only a 10% decline in the black-white IQ gap, assuming you believe a) heritability is 80%, and b) the default hypothesis is true.