• About

Pumpkin Person

~ The psychology of horror

Pumpkin Person

Tag Archives: education

Harvard Law > Harvard undergrad IQ gap in the 1980s/90s

08 Tuesday Oct 2024

Posted by pumpkinperson in Uncategorized

≈ 190 Comments

Tags

education, Harvard, law, law-school

I’ve blogged about this before but I wanted to revisit it now that I have better data.

Harvard undergrads 1991: SAT IQ 147; expected WAIS IQ 129

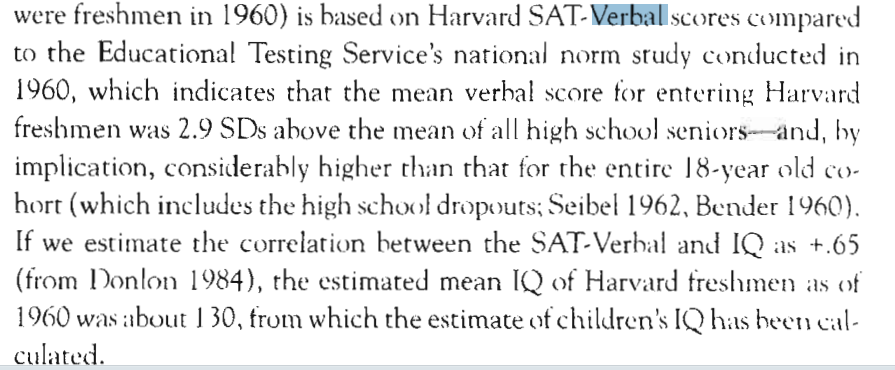
Harvard undergrads from the class of 1995 (and thus took their SATs around 1991, had a mean SAT score of 1390. National norm studies suggest that if all American 17-year-olds, not just the college-bound elite, had taken the SAT in this era, the mean would have been 787 with a standard deviation (SD) of 193. Thus by general population standards, 1390 was +3.12 or IQ 147 (U.S. norms); 147 (white norms).

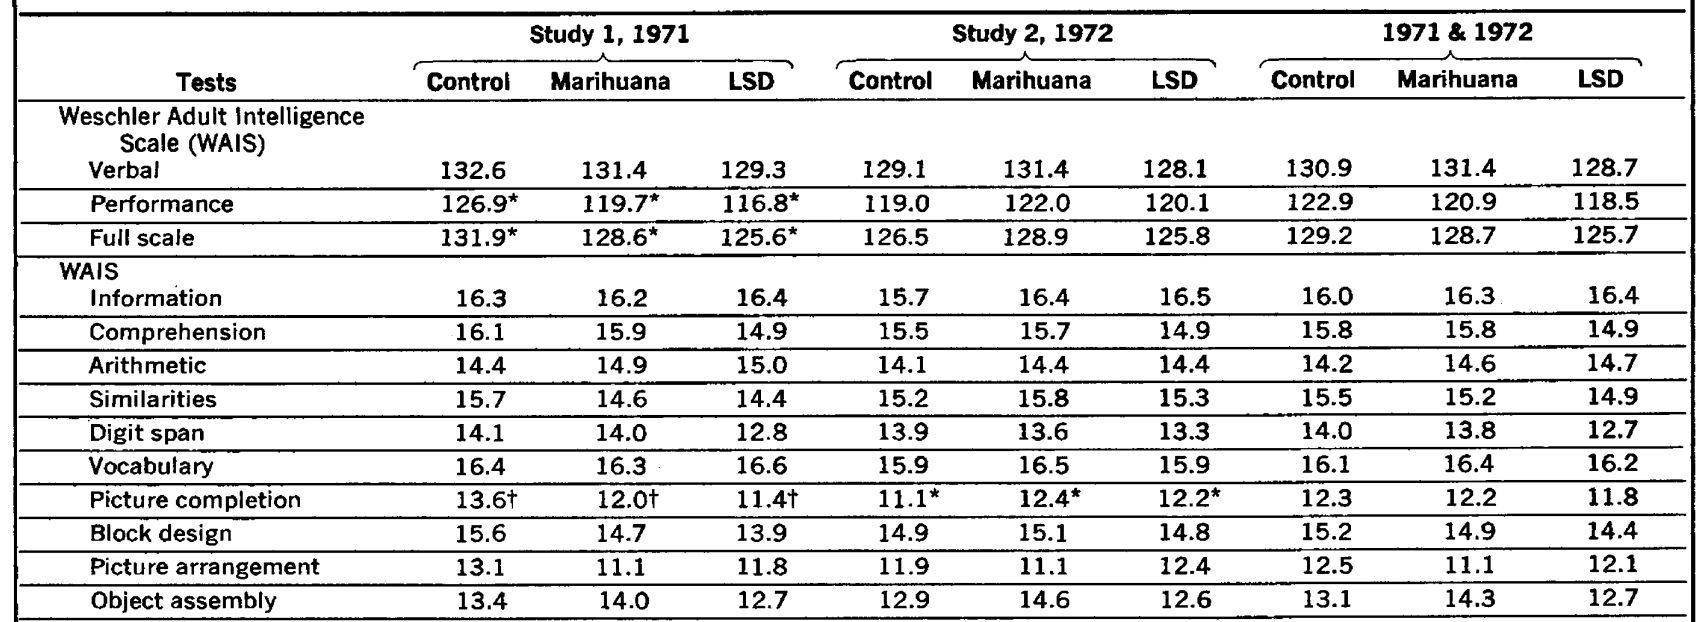
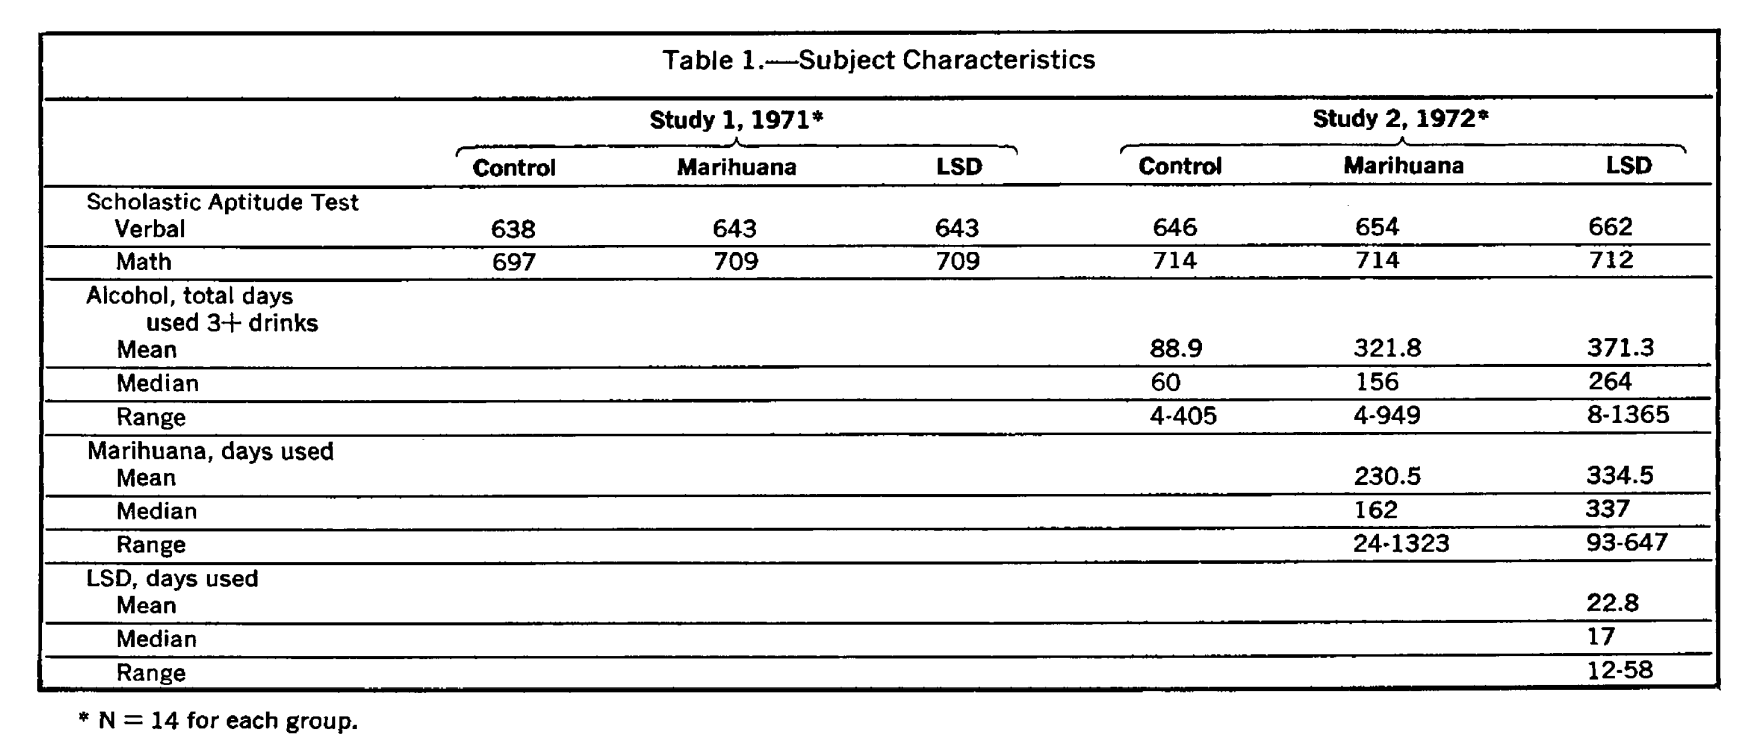
However because Harvard students were selected by SAT scores, they were selected in part for SAT overperformance. We saw this with Dartmouth students who scored only about 61% as well on the WAIS IQ test as they did on the SAT. Assuming the same would have happened to Harvard students circa 1991, instead of scoring 47 points above the U.S. mean, on the WAIS they’d score 47(0.61) = 29, so IQ 129 (U.S. norms); IQ 128 (white norms). Indeed a study by Harvard scholar Shelley H Carson found that in the early 21st century, Harvard students averaged around 130 IQ on the abbreviated WAIS-R and that was BEFORE deductions for inflated norms.

Harvard Law students 1980s: LSAT IQ 152; Expected WAIS IQ 137

I could not find the mean LSAT scores of Harvard Law students from the same era, but I did find a source (see table 7 of this paper) that the top 19 law schools in the 1980s had mean LSAT scores of 40 to 45 out of 48. It is likely that Harvard Law was the law school with a 45 point mean. My own preliminary research suggests that a 45 out of 48 on the 1980s LSAT equated to an IQ of 152 (U.S. norms); IQ 152 (white norms).

They too would regress to the mean except instead of regressing to the general U.S. mean of 100, LSAT takers are pre-selected by university so they would have regressed to the much higher mean of LSAT takers which would have been 116.

  • Average Harvard Law student WAIS IQ = (LSAT IQ – 116)(0.61) + 116
  • Average Harvard Law student WAIS IQ = (152 – 116)(0.61) + 116
  • Average Harvard Law student WAIS IQ = (36)(0.61) + 116
  • Average Harvard Law student WAIS IQ = 138 (U.S. noms); 137 (white norms)

Some readers might argue that if the WAIS-SAT correlation is 0.61, the WAIS-LSAT correlation should be lower, given it’s a more restricted sample, however surprisingly, people who take graduate school admission tests appear to be at least as variable as the general population.

Some readers may wonder why I regress Harvard Law students to the LSAT population when I don’t regress Harvard undergrads to the SAT population but rather the general population. The reason is, above about the top 1%, all members of the general population took the SAT, so regressing them to the SAT population would have been redundant.

Conclusion

Even though the Harvard Law > Harvard undergrad IQ gap was only 5 points when measured by the tests used to select them respectively (LSAT IQ 152 vs SAT IQ 147); the gap should nearly double if they were given a test independent of the admission process (WAIS IQ 137 vs WAIS IQ 128). This is a reminder that we should never measure the IQ of a group by the test used to select them and consistent with the general rule that law students are about 10 IQ points smarter than undergrads, though unlike Harvard, at a typical university circa 1990, the respective scores would have been around 120 vs 110.

Share this:

  • Click to share on X (Opens in new window) X
  • Click to share on Facebook (Opens in new window) Facebook
Like Loading...

The correlation between the Old SAT & WAIS IQ

27 Saturday Jul 2024

Posted by pumpkinperson in Uncategorized

≈ 300 Comments

Tags

college, college-admissions, education, SAT, testing

Long ago a person in the comment section told me about an excellent study in which several groups of Dartmouth seniors were administered the WAIS (Culver & King, 1974).

What made the study especially useful is their SAT scores (probably taken when they were around 17) were provided:

I decided to focus on the control groups because their IQs were least likely to be impaired by the substance abuse effects the study investigated. The 1971 Dartmouth control group averaged a combined SAT of 1335 and the 1972 control group averaged a combined SAT of 1360. Averaging these together gives 1348. Since the students were 20 to 25 when they took the WAIS in 1970 to 1972, they probably took the SAT from 1965 to 1969. Based on national norm studies I estimate that if virtually all American 17-year-olds took the SAT in 1960 and 1974, the mean and standard deviation (SD) would have been 784/210 and 770/204 respectively.

Since the WAIS was normed so that a representative sample of U.S. adults in each age group would have a mean IQ and SD of 100 and 15 respectively (see WAIS manual, chapter 2), I equated the national means and SDs of the SAT to 100 and 15 also. By this measure a 1360 on the SAT equated to an IQ of 141 or 143 depending on whether I used the 1960 or 1974 norms. Let’s split the difference and say 142. Meanwhile the full-scale WAIS IQ of the Dartmouth control group students was 129.

Now because they were tested circa 1971 and the WAIS was normed circa 1953.5, their scores are inflated by a 17.5 year Flynn effect. According to the brilliant and influential James Flynn (RIP), the Wechsler Flynn effect was 3 points per decade but according to my own independent research, it was more like 1 point a decade. Flynn (who was always kind enough to respond to emails) told me my research was not accurate because I was using a pre-war Wechsler scale and IQ tests did not become accurate until after WWII. I countered that his own research may be compromised by test order effects. (Davis 1977, Kaufman 2010)

Using Flynn’s estimate, their IQs need to be reduced to 124 but using mine they need to be reduced to 127. Either way, they scored substantially lower on the WAIS than they did on the SAT. This is to be expected because Dartmouth students were largely selected by SAT scores and given the imperfect correlation between standardized tests, people who are selected using one test should regress to the mean on another and assuming a bivariate normal distribution, the slope of the standardized regression is a function of the correlation between the tests.

So given an SAT that was 42 points above the U.S. mean defined as 100, the expected correlation (r) between the WAIS and the SAT is:

r = (number of IQ points above 100 on the WAIS/number of IQ points above 100 on the SAT)

r = (24 or 27/42)

r = 0.57 or 0.64

Let’s split the difference and say 0.61.

Because Herrnstein & Murray (1994) popularized the myth that Ivy League students have IQs in the stratosphere (and Jordan Peterson believed it, even though studies he co-wrote show otherwise) I was surprised to learn that at least one of The Bell Curve’s authors knew the truth, though this was relegated to the footnotes (see page 688):

[Update July 28, 2024: an earlier version of this article suggested the correlation between the SAT and the WAIS be adjusted for the time difference between the two administrations however it’s unclear if such a an adjustment is valid]

Share this:

  • Click to share on X (Opens in new window) X
  • Click to share on Facebook (Opens in new window) Facebook
Like Loading...

Robert Mugabe’s IQ

02 Wednesday Oct 2019

Posted by pumpkinperson in Uncategorized

≈ 78 Comments

Tags

Africa, education, IQ, Robert Mugabe

photo taken July 1, 1984. ALEXANDER JOE/AFP/Getty Images

Several people have asked me to estimate the IQ of late Zimbabwean leader Robert Mugabe.

According to the latest research by Richard Lynn and David Becker, the average IQ of sub-Saharan Africa is 69 however I would argue that if the data is limited to the most culture reduced tests (and I don’t mean the Raven, which is deceptively culturally loaded), it would be about 80 (UK norms/white norms). It’s important to use the most culturally reduced tests when comparing populations separated by time or space, otherwise you get ridiculous results like average IQ increasing by 7 points a decade as happened in Holland on the Raven test.

80 is 20 points the white mean of 100. If black Africans average 20 points below white populations on truly culture reduced tests, then perhaps their leaders average 20 points below the white leaders of mostly white countries.

Publicly available data suggests U.S. presidents have an average IQ of 130 (with an SD of only 12 compared to the national white SD set at 15), so let’s say black African leaders have an average IQ of 110 (SD also 12).

However Mugabe was not just any black African leader. He was exceptionally well educated, even by the standards of World leaders.

To compare Mugabe’s education to other African leaders of his generation, I found a list of the oldest presidents in Africa and tried to determine how many degrees each had. Excluding non-black leaders, the 8 oldest held the following number of degrees:

Paul Biya 4, Manuel Pinto da Costa 0?, Alpha Condé 2?, Arthur Peter Mutharika 2, Hage Geingob 3, Teodoro Obiang Nguema Mbasogo 0?, Emmerson Dambudzo Mnangagwa 2?, Alassane Ouattara 3.

The mean is 2 with a standard deviation of 1.41

So with an astonishing seven university degrees Mugabe is 3.55 SD more educated than even a group as elite as African presidents

In sub-Saharan Africa, the correlation between culture-reduced IQ and education appears to be 0.52, but in a group as homogeneous as African presidents, it would likely be lower. What is needed is the IQ vs education correlation among a specific occupation (African Presidents).

On page 345 of his book Bias in Mental Testing, Arthur Jensen shows the partial correlation between IQ and education, that is the correlation holding occupation constant. This correlation is listed as 0.27 to 0.42 (see below). Let’s split the difference and say 0.35 and assume the same correlation in Africa..

Assuming Mugabe is 3.55 SD more educated than the average African president, the partial correlation predicts his IQ would be 0.35(3.55 SD) = 1.24 SD higher than the average African presidents.

Assuming African presidents have a mean IQ of 110 with an SD of 12 (see above), this would put his expected IQ at 125 (higher than 95% of white America).

All we can say with 95% certainty is that his IQ would be anywhere from 103 to 147. One reason for thinking he’s in the upper end of this range is that he was a Marxist, and left-wing politics are positively correlated with IQ (at least if you control for race and income).

Whatever his IQ, it would have likely been substantially higher had he been born and raised in the United States, where First World nutrition would have allowed his brain size to reach its genomic potential.

One caveat to the above analysis: usually education is measured by highest degree obtained, not number of degrees. How this might affect the correlation with IQ is unclear.

Share this:

  • Click to share on X (Opens in new window) X
  • Click to share on Facebook (Opens in new window) Facebook
Like Loading...

contact pumpkinperson at easiestquestion@hotmail.ca

Recent Comments

RaceRealist's avatarRaceRealist on Which better predicts populati…
austin slater's avataraustin slater on Which better predicts populati…
RaceRealist's avatarRaceRealist on Which better predicts populati…
God's Word's avatarGod's Word on Which better predicts populati…
pumpkinperson's avatarpumpkinperson on Which better predicts populati…
RaceRealist's avatarRaceRealist on Which better predicts populati…
Anime's avatarAnime on Which better predicts populati…

Archives

  • December 2025
  • November 2025
  • October 2025
  • September 2025
  • August 2025
  • July 2025
  • June 2025
  • May 2025
  • April 2025
  • March 2025
  • February 2025
  • January 2025
  • December 2024
  • November 2024
  • October 2024
  • September 2024
  • August 2024
  • July 2024
  • June 2024
  • May 2024
  • April 2024
  • March 2024
  • February 2024
  • January 2024
  • December 2023
  • November 2023
  • October 2023
  • September 2023
  • August 2023
  • July 2023
  • June 2023
  • May 2023
  • April 2023
  • March 2023
  • February 2023
  • January 2023
  • December 2022
  • November 2022
  • October 2022
  • September 2022
  • August 2022
  • July 2022
  • June 2022
  • May 2022
  • April 2022
  • March 2022
  • February 2022
  • January 2022
  • December 2021
  • November 2021
  • October 2021
  • September 2021
  • August 2021
  • July 2021
  • June 2021
  • May 2021
  • April 2021
  • March 2021
  • February 2021
  • January 2021
  • December 2020
  • November 2020
  • October 2020
  • September 2020
  • August 2020
  • July 2020
  • May 2020
  • April 2020
  • March 2020
  • February 2020
  • January 2020
  • December 2019
  • November 2019
  • October 2019
  • September 2019
  • August 2019
  • July 2019
  • June 2019
  • May 2019
  • April 2019
  • March 2019
  • February 2019
  • January 2019
  • December 2018
  • November 2018
  • October 2018
  • September 2018
  • August 2018
  • July 2018
  • June 2018
  • May 2018
  • April 2018
  • March 2018
  • February 2018
  • January 2018
  • December 2017
  • November 2017
  • October 2017
  • September 2017
  • August 2017
  • July 2017
  • June 2017
  • May 2017
  • April 2017
  • March 2017
  • February 2017
  • January 2017
  • December 2016
  • November 2016
  • October 2016
  • September 2016
  • August 2016
  • June 2016
  • February 2016
  • January 2016
  • November 2015
  • May 2015
  • January 2015
  • December 2014
  • November 2014
  • October 2014

Categories

  • ethnicity
  • heritability
  • income
  • Oprah
  • Uncategorized

Meta

  • Create account
  • Log in
  • Entries feed
  • Comments feed
  • WordPress.com

Create a free website or blog at WordPress.com.

Privacy & Cookies: This site uses cookies. By continuing to use this website, you agree to their use.
To find out more, including how to control cookies, see here: Cookie Policy
  • Subscribe Subscribed
    • Pumpkin Person
    • Join 686 other subscribers
    • Already have a WordPress.com account? Log in now.
    • Pumpkin Person
    • Subscribe Subscribed
    • Sign up
    • Log in
    • Report this content
    • View site in Reader
    • Manage subscriptions
    • Collapse this bar
 

Loading Comments...
 

    %d