Open thread week april 15 to april 21

Please post all off-topic comments for the week in this thread.  They will not be posted in the main articles.

A few random thoughts:

Where’s the bartender?

The other night I walked into a bar and there was no bartender in site to serve me.  Then a slightly overweight blond young woman stood up to go to the ladies room.

“I thought you were the bartender,” I told her, “cause you stood up just as I entered, I thought you were gona get me a drink”

“And I’m blonde too” she added with a laugh.

At the time I thought she meant blonds are sexy and thus more likely to get hired as bartender, so was flattered that I thought she was the bartender.

Then the actual bartender appeared: She was a 300 lb blond woman…

Friday the 13th

So Friday was Friday the 13th so naturally I went out to celebrate.  But sadly a lot of men seem to get off on being very abusive to women.  I saw a drunk white guy being abusive towards an arctic woman.  He had told her she had no choice but to stay at his apartment because no one else wanted her and then took her iphone and through it in the snow.

A bunch of us were watching from the window inside the bar, debating what to do, when finally I said “I’ll go talk to him.”

“No don’t do that” warned a co-worker. “He’s psycho”

“I smiled,” and like Mrs Voorhees from the original Friday the 13th, I replied, “I’m not afraid.”

pam2

When I went out there, I asked the arctic woman, “Is he bothering you?”

When she said “yes” I decided to pull the Dr. Huxtable father-figure shtick, even though he was only about five years younger than me (that’s how drunk I was).

“Son, I think you have a problem,” I told him gently, not wanting to anger someone so aggressive.  “And you need to talk someone about it.  Maybe talk to a friend or councillor of some kind.  And if none of them that works, you can always come here,” I said, referring to the bar.

cosby


Another Jordan Peterson video

Talks about how there are no jobs for people below 85 IQ and claims even a lot of lawyers will be out of work soon.

Most interesting thing he says is that people below IQ 80 take tens of hours to learn how to do a job most of his psychology students could learn in 10 minutes.  This is consistent with the theory once proposed by a member of Prometheus that complex learning/problem solving speed doubles every 5 or 10 IQ points.

On the other hand, why does research show that total vocabulary is normally distributed?  High verbal IQ people don’t have vocabs orders of magnitude greater than low verbal IQ people.  Maybe there just aren’t enough common words for such a pattern to emerge?

IQ stability vs neuroplasticity: Is intelligence like height or like muscle?

[Please post all off-topic comments in the most recent open thread.  They will not be posted here]

For years scientists in psychology and neurology have been pushing two rather contradictory ideas:

Psychologists:  Intelligence is like height.  Very stable and genetic, especially after puberty.  Aside from pathological cases like organic dementia or brain damage, the IQ you have in youth, you pretty much die with.  Even when low IQ kids are given the most extreme cultural enrichment imaginable, their real world intelligence doesn’t improve. See comments in below videos from Jordan Peterson:

Neurologists: Intelligence is like a muscle.  The more you exercise it, the stronger it becomes.  The brain is marvellously plastic.  Every time you learn a new skill you alter the chemical and physical structure of the brain.  It’s even possible to largely recover from brain damage.  See video below with Lara Boyd:

How can both be these views be true?

I think overall intelligence (what IQ tests try to measure) is almost as hard to change as height, but all the specific parts of intelligence (mental arithmetic, sense of direction, understanding irony) are like muscles that can be exercised.

Every time you exercise a part of your brain, that region gets bigger, just like every time you exercise a muscle, that muscle gets bigger.  One difference is, muscles are outside the skeleton, so they have room to expand indefinitely, but the brain is inside the skeleton, so its expansion is limited by cranial capacity.

Thus, the only way to make a part of the brain bigger is to make another part smaller.  So while you’re exercising your arithmetic IQ, your sense of direction IQ is slowly atrophying.  Start exercising your sense of direction IQ and your arithmetic IQ decays.

So while very specific parts of intelligence can be greatly improved, overall intelligence is limited by the size of the cranium and many other very finite resources.  So when you get a university degree, learn a new instrument, or acquire a new language, you haven’t actually made yourself much smarter overall, you’ve just reallocated cognitive resources from one ability to another.

So when low IQ children are adopted into extremely enriched environments, their IQs do shoot up but it doesn’t much translate into real world intelligent behavior, because all they have done is invested all their brain power in abilities measured by the test, but they haven’t actually increased the amount of brain power, so when new learning challenges inevitably show up,  they’re right back to where they were before the intervention.

Arthur Jensen referred to such IQ gains as “hollow with respect to g”, the general factor of intelligence.  He found for example that adoption into the upper class would improve the IQs of children from lower class homes, but the degree of improvement was uncorrelated with the g loadings of the specific tests.  It was hollow with respect to g, and he predicted that high IQ upper class adopted kids would not do as well in later life as their equally high IQ non-adopted siblings, because the former high IQ was hollow, while the latter was flowing with genetic g.

On the other hand, James Flynn argued g was irrelevant, citing the example of fetal alcohol syndrome (FAS) where IQ is obviously impaired with real world effects, but the degree of impairment is unrelated to g.  However I’d argue FAS is a pathological case, and thus not relevant to normal biological functioning.


Open thread week April 8 to April 14

please place all off-topic comments for the week here.  They will not be posted in the main articles.

Black national merit finalist GondwanaMan mentioned a study correlating pupil size with IQ but since it was too off-topic to in the previous thread, I thought I’d mention it here.


Blacks, Italians & interracial dating

[Please place all off-topic comments in the most recent open thread. They will not be posted in this thread]

Black national merit finalist GondwanaMan writes:

From what I understand from friends who live there, there was a time in Boston that no black person dare go into certain Italian and Irish neighborhoods. Bill Russell called it the most racist city in the country.

Director Spike Lee did an interesting job depicting black-Italian relations in his films Do the Right Thing and Jungle Fever.  This scene from the latter film depicts the fury of an Italian father discovering his daughter is dating a black guy:

Of course this is fictional and folks were more racist in the 1990s, so who knows how many Italian fathers would really act like that today.  And would he have gone so ballistic if his daughter were dating a Jew, an Arab, an East Asian, a South Asian? I don’t think so.  Blacks were in a separate category from other non-whites, at least back then, and perhaps through most of history.

Below is scene from a show commenter RR and I both like, The Sopranos. Tony’s daughter brings home an African American, and even though he’s very white looking and highly educated, Tony is having none of it:

Of course I don’t want to give the impression that only Italians are guilty of this.  Sadly, many Arabs, South Asians, Jews and East Asians also go ballistic when their daughters or sisters date blacks, and in rare cases Muslim girls can be murdered by their fathers for doing so.

Upper-class WASPs were often more subtle.  Instead of getting violent, they would often just pay the black boy to stay away from their daughter.


What is Roseanne’s IQ?

[PLEASE PLACE ALL OFF-TOPIC COMMENTS IN THE MOST RECENT OPEN THREAD.  THEY WILL NOT BE POSTED IN THIS THREAD]

roseanne

Last week the rebooted Roseanne show drew 18 million U.S. viewers; an incredible achievement in our fragmented media age.  I’m not surprised as the original show ended while it was still good, and so many people are nostalgic for the 20th century (before the internet, fear of terrorism and neocon wars dominated American life)

The original Roseanne show ran from 1988 to 1997.  One of the reasons the show worked was the chemistry between Roseanne Barr (her character is Roseanne Conner) and her TV husband Dan Conner (played by John Goodman).  They made a great couple because even though Roseanne was a big woman, Goodman was such a big guy he made her look small.

roseanne2

John Goodman and Roseanne on the original Roseanne show

It was hard for Roseanne to land a sitcom because TV execs didn’t think anyone wanted to watch a fat woman on TV, but then someone must have noticed that the then overweight Oprah was setting record ratings on daytime TV, and decided to take a chance on Roseanne.

The show became a huge hit, because seeing a working class family on TV was a novel concept and unlike other sitcoms where everyone was perfect, the Conners were overweight, blue collar, and had kids who dropped out of high school (as did the real Roseanne and her real life kids) .

As two plus sized women from working class backgrounds, both of whom suffered sexual abuse,  it was only natural that Roseanne became one of Oprah’s most frequent guests, but the first time they met Oprah thought “Who is this WHACKED woman?”

But then the second time Roseanne appeared on Oprah she was promoting her book, My Life as a Woman, and Oprah was blown away by the insights.

“You are so smart,” Oprah would later tell her circa 1998  “And have been empowering women in ways that we don’t consciously recognize, but all those years when we would not miss one single Roseanne show, what you were really saying is no matter who you are, what your circumstances: YOUR LIFE MATTERS!”

But shortly after that exchange, Roseanne who had for decades loved Oprah, suddenly became hostile.  It started when the two women arm wrestled on TV and Roseanne bizarrely thought Oprah cheated.

Things got worse as Oprah started doing shows about new age spirituality, which Roseanne felt had no relevance to working people.

But what really set Roseanne off was when Oprah endorsed Hillary over Obama in the 2007 Democratic primary.  Roseanne felt Hillary was better and smarter than Obama and felt Oprah should be supporting an intelligent woman over a flashy man.

And then when Obama bailed out wall street bankers who had looted the U.S. treasury, Roseanne went absolutely ballistic on her blog, calling Obama a black man owned by white bankers, and stating: “NOW I WANT TO SEE THAT DAMN BIRTH CERTIFICATE!!!!!!!!!!!”

During Oprah’s final season in 2011, she invited Roseanne back on her show to clear the air:


When Roseanne later visited Oprah’s cable network OWN she remarked “I like that everyone here’s a woman.  That way you don’t have to deal with any ASSHOLES!”

In the years since, Roseanne’s politics have changed a lot: she went from loving Hillary to hating her, from hating Israel to loving it, and she’s become a huge Trump supporter, even making her TV character Roseanne Conner a hard-core Trump supporter too (much to the horror of her many liberal fans).  Naturally Trump called to congratulate her on the show’s success.

There are entire working class towns where you have to drive miles before finding a single person who didn’t vote Trump, so it makes sense that Roseanne Conner, as the iconic working class white, would be a Trump supporter too.

It must have been sad for Hillary to not only have lost the presidency to Trump, but to have a working class feminist hero like Roseanne celebrate Trump’s win on the highest rated sitcom in years.

But so many working class white women would scream “LOCK HER UP! LOCK HER UP!” whenever Trump mentioned Hillary at his rallies.  Perhaps on the rebooted Roseanne sitcom they will have an episode where the Conners are watching TV and Hillary comes on, and Roseanne and Dan chant “LOCK HER UP! LOCK HER UP!”

While such a scene would add dark realism, it would ailienate Hillary fans, and many are already angry enough about Roseanne’s Trump support.

Early Years

As a working class Jewish girl surrounded by Mormons in Salt Lake City, Utah, Roseanne Barr felt like an outsider growing up.  She also claimed she was abused at home:

My mother abused me from the time I was an infant until I was six or seven years old… She did lots of lurid things. She hurt me psychologically and physically…My father molested me until I left home at age 17.  He constantly put his hands all over me. He forced me to sit on his lap, to cuddle with him, to play with his penis in the bathtub. He did grotesque and disgusting things: He used to chase me with his excrement and try to put it on my head. He’d lie on the floor playing with himself. It was the most disgusting thing you can ever imagine.

At 16, she was hit by a car and suffered traumatic brain injury.  Her behavior changed so drastically she spent time in a mental hospital.

But it was while working as a waitress that Roseanne finally found her calling.  Customers were amused by her witty comebacks and as her fan base grew, she was encouraged to try stand up comedy, which eventually led to a sitcom.

So what is her IQ?

I’m not aware of Roseanne ever taking an IQ test, and little is known about how she did in school.  Her speaking style doesn’t sound very intelligent but that could reflect her working class roots or be feigned to fit her working class persona.

I find it interesting that she’s a Jewish high school dropout, because Jews appear to be about 0.66 standard deviations more educated than non-Jewish Americans.  So while a high school dropout in Roseanne’s day was about -0.66 SD less educated than the average American (normalizing the education distribution), a Jewish high school dropout was 1.32 standard deviations less educated.

If there were a perfect correlation between IQ and education among U.S. Jews, you’d expect Roseanne’s IQ to be about 20 points below the Jewish mean of 110, but since the correlation is 0.57, we’d expect it to be around 0.57(20) = 11 points below 110, so 99.

On the other hand, Roseanne is rumoured to be worth around $80 million thanks to the success of her sitcom.  That puts her lifetime earnings way above the 99.9 percentile for her generation (self-made low decamillionaire), but way below the 99.99993 percentile (self-made billionaire).  Normalizing the distribution of self-made money, she’s somewhere between +3.1 SD and +4.8 SD.  Splitting the difference, let’s say +3.95 SD.  However because the typical U.S. Jew is about +0.73 SD on a normalized income curve, we might subtract 0.73 SD to very crudely guess how Roseanne compares to U.S. Jews.  She’s perhaps about +3.22 SD.

If there were a perfect correlation between IQ and lifetime earnings, we’d expect Roseanne to be 48 IQ points above the average IQ 110 U.S. Jew, but since the correlation is about 0.48, we’d expect her to be 0.48(48) = 23 points higher, predicting a 133 IQ.

So who is the true Roseanne?  The average woman implied by her education, or the genius implied by her income.  One can only guess, but a brilliant Promethean long ago told me that when using two or more variables to predict a third, I should use multiple regression.  Since education and income correlate 0.57 and 0.48 with IQ respectively, and about 0.44 with each other, the predictive power of education and income (independent of each other) are 0.42 and 0.3 respectively.  Thus:

Roseanne’s IQ = 0.42(education) + 0.3(life time income)

Roseanne’s IQ =0.42(-0.66 SD from the Jewish mean) + 0.3(+3.2 SD from the Jewish mean)

Roseanne’s IQ = -0.28 SD + 0.96 SD from the Jewish mean

Roseanne’s IQ = +0.68 SD from the Jewish mean

On a scale where white Americans average 100 with an SD of 15, Jews average about 110 and probably also have an SD of 15, and so if Roseanne is +0.68 SD, that would put her at:

0.68(15) + 110 = 120

Of course this doesn’t tell us Roseanne’s IQ.  At best it tells us the average IQ of Jewish high school dropouts who amassed an $80 million fortune.  However even within such a narrowly defined demographic, there’s enormous variation (or would be if the demographic were large).

Notes:

According to a 2016 Pew poll, 44% of U.S. Jewish households earned $100 K+ a year, compared to 19% for the general U.S. population.  Normalizing the income distribution, that’s a difference of 0.73 standard deviations.
Only 2% of Jews are high school dropouts, compared to 10% of all U.S. adults.  Normalizing the education distribution, that implies Jews are 0.66 SD more educated than the average American, however dropping out was more common in all demographics during Roseanne’s youth

Open thread April 1 to April 7, 2018

Please place all off-topic comments for week April 1 to April 7 here.

Meanwhile here’s a lecture by Jordan Peterson on Marxism:

I don’t think high IQ Mrs Garrett from the Facts of Life would have liked this lecture

Now that the weather is warming up, I am rocking me a tight fluorescent green Facts of Life T-shirt, with blue jeans, cowboy boots and a cowboy hat.  I was so scared I’d be the laughing stock of the local honky tonk if I put the FOL shirt on, but instead I was invited to sit with a table full of drunk bridesmaids, who all thought it was so adorable they bought me shots:

garet2


HBD finally being accepted by mainstream science

[PLEASE PLACE ALL OFF-TOPIC COMMENTS IN THE MOST RECENT OPEN THREAD.  THEY WILL NOT BE POSTED IN THIS THREAD]

HBD chick recently tweeted about a New York Times article on race by Harvard geneticist David Reich.  The theme of the article is that it’s finally time to admit HBD is true. This is a very big deal coming from a scientist at the World’s top university and published in the World’s most influential news source.  Here are some selected quotes from Reich with the HBD acceptance bolded by me:

…when a teacher looks around a classroom of students of diverse “races,” she or he shouldn’t see them as members of fundamentally different groups of people. “Race” has trivial predictive power about an individual person’s biological capabilities. Even if there are slight average differences among groups of humans, individuals from any group are capable of excelling in any realm….

….It is likely that a few stereotypes will be validated by findings from genetics — even if it is also certain that a great majority will be disproved…

…The key point is that whatever science finds should not affect the way we behave toward one another. Whatever small average differences across groups might exist (and genetic studies have already made it clear that average differences across populations are much less than those between individuals), we are members of a single species, all of whom must be given every opportunity to flourish in every realm…

…There are clear genetic contributors to many traits, including behavior.

… Present-day human populations, which often but not always are correlated to today’s “race” categories, have in a number of instances been largely isolated from one another for tens of thousands of years. These long separations have provided adequate opportunity for the frequencies of genetic variations to change.

… Genetic variations are likely to affect behavior and cognition just as they affect other traits, even though we know that the average genetic influences on behavior and cognition are strongly affected by upbringing and are likely to be more modest than genetic influences on bodily traits or disease…

…Given that all genetically determined traits differ somewhat among populations, we should expect that there will be differences in the average effects, including in traits like behavior…

To insist that no meaningful average differences among human populations are possible is harmful. It is perceived as misleading, even patronizing, by the general public. And it encourages people not to trust the honesty of scholars and instead to embrace theories that are not scientifically grounded and often racist.

In short, I think everyone can understand that very modest differences across human population in the genetic influences on behavior and cognition are to be expected. And I think everyone can understand that even if we do not yet have any idea about what the difference are, we do not need to be worried about what we will find because we can already be sure that any differences will be small (far smaller than those among individuals)…

IQ of professional comedians

[PLEASE PLACE ALL OFF-TOPIC COMMENTS IN THE MOST RECENT OPEN THREAD.  THEY WILL NOT BE POSTED IN THIS THREAD]

A famous 1975 study by Samuel S. Janus  published in THE AMERICAN JOURNAL OF PSYCHOANALYSIS claimed professional comedians have an incredibly high average IQ of 138 (U.S. norms).  Critics argue that IQ tests just measure narrow upper class book smarts, but if that’s true, we shouldn’t expect creative socially brilliant people from mostly working class backgrounds to average higher scores than 99.5% of America.  But it is it true?  In the section below, Janus explains how the participants were selected:

comic2

In the next section Janus describes the test results:

comic

So something doesn’t add up here.  Janus claims the comics ranged form IQ 115 to 160+ but then states “the vocabulary subtest was utilized” and doesn’t mention any other subtests anywhere in the paper.  So were the IQs based entirely on the Vocab test?  But the vocab test doesn’t give an IQ, it gives a scaled score.  Scaled scores are like IQs except instead of having a mean of 100 and an SD of 15, they’re scaled to have a mean of 10 and an SD of 3.  Of course you can convert scaled scores to IQ equivalents by multiplying by 5 and adding 50, but the highest scaled scores you can get on the WAIS vocabulary subtest was 19, which equates to IQ 145, so how the hell did any comic in the sample score 160+ if only that subtest was used?

Sadly, I think what might have happened is that instead of converting the scaled score to an IQ equivalent, Janus prorated, which you should never do from just one subtest.  In other words since he gave only one subtest, he multiplied the score on that one subtest by 11, to estimate what the comics would have scored if all 11 WAIS subtests had been given and then converted this estimated sum of scaled scores to Full-scale IQ using the table in the manual.

But scoring perfect on all 11 subtests is much more rare than scoring perfect on just one, and thus equates to a much higher IQ, so by assuming the Vocabulary subtest could represent all 11 subtests, it looks like he wildly overestimated the IQs of the brightest comics.  My guess is that if he had followed the correct procedure (converting Vocab scaled score to IQ equivalent) he would have obtained an average IQ of maybe 127 or so (I’d need the 1955 WAIS manual to know for sure) and that’s before we deduct points for the Flynn effect; though research showing a Flynn effect for Vocabulary is inconsistent.

Bottom line: professional nationally famous U.S. comedians probably average IQs no higher than the mid 120s, which while very high, is nowhere near the genius level this study led us to believe.

This is not surprising, because there are two types of funny people.  Some people are funny because they’re smart.  And some people are funny because they’re NOT smart, and being the class clown is a way of compensating for the fact that they’re dumb.  By acting like school is one big joke, they shield themselves from the humiliation of bad grades:

Old (pre-recentered) SAT converted to IQ: revised & expanded

[PLEASE PLACE ALL OFF-TOPIC COMMENTS IN THE MOST RECENT OPEN THREAD.  THEY WILL NOT BE POSTED IN THIS THREAD]

[WARNING:  THIS ARTICLE IS NOT AN ENDORSEMENT OF THE OLD SAT AS AN IQ TEST, IT SIMPLY EXPLAINS WHAT YOUR IQ ON THE OLD SAT WOULD BE IF THE SAT WERE AN IQ TEST.  THE LINE BETWEEN IQ AND ACHIEVEMENT TESTS IS PARTLY SEMANTIC]

Many high IQ societies accept specific scores from the pre-1995 SAT for admission, as if all SATs taken before the infamous recentering in April 1995 had the same meaning.  And yet Mensa, which only accepts the smartest 2% of Americans on a given “intelligence test” makes a curious distinction.  Prior to 9/30/1974, you needed an SAT score of 1300 to get into Mensa, yet from 9/30/1974 to 1/31/1994, you needed a score of 1250.

Well, that’s odd I thought, since all SAT scores from the early 1940s to 1994 are supposedly scaled to reflect the same level of skill, why did it suddenly become 50 SAT points easier to be in the top 2% in 1974?  And if such an abrupt change can occur in 1974, why assume stability every year before and since?  It didn’t make any sense.

And I wasn’t the only one who was wondering.  Rodrigo de la Jara, owner of iqcomparisonsite.com, writes:

If someone knows why they have 1300 for scores before 1974, please send an email to enlighten me.


The mean verbal and math SAT scores, if ALL U.S. 17-year-olds had taken the old SAT

To determine how the old SAT maps to IQ I realized I couldn’t rely on high IQ society cut-offs.  I need to look at the primary data.  Now the first place to look was at a series of secret studies the college board did in the 1960s, 1970s, and 1980s.  These studies gave an abbreviated version of the SAT to a nationally representative sample of high school juniors.  Because very few Americans drop out of high school before their junior year, a sample of juniors came close to representing ALL American teens, and then scores were statistically adjusted to show how virtually ALL American teens would average had they taken the SAT at 17. The results were as follows (note, these scores are a lot lower than the actual mean SAT scores of people who take the SAT, because they also include all the American teens who usually don’t):
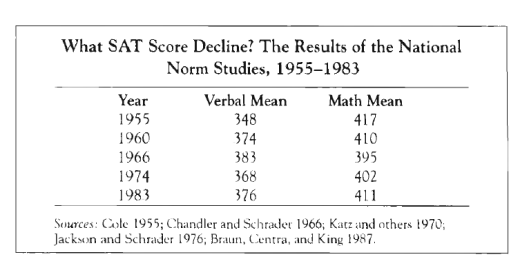
nationalnorm

Table I


The verbal and math standard deviations if ALL U.S. 17-year-olds had taken the old SAT

 Once I knew the mean SAT scores if ALL American teens had taken the SAT at 17 in each of the above years, I needed to know the standard deviations.   Although I knew the actual SDs for 1974, I don’t know them for other years, so for consistency, I decided to use estimated SDs.

According to the book The Bell Curve, since the 1960s, virtually every single American teen who would have scored 700+ on either section of the SAT, actually did take the SAT (and as Ron Hoeflin has argued, whatever shortfall there’d be would be roughly balanced by brilliant foreign test takers).  This makes sense because academic ability is correlated with taking the SAT, so the higher the academic ability, the higher the odds of taking the SAT, until at some point, the odds likely approach 100%.

Thus if 1% of all American 17-year-olds both took the SAT and scored 700+ on one of the subscales, then we know that even if 100% of all U.S. 17-year-olds had taken the SAT, still only 1% would have scored 700+ on that sub-scale.  By using this logic, it was possible to construct a graph showing what percentage of ALL U.S. 17-year-olds were capable of scoring 700+ on each sub-scale, each year:
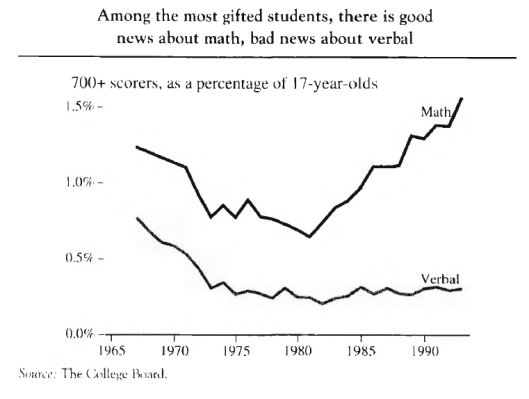
 

sevenhundred

Figure I


What the above graph seems to show is that in 1966, a verbal score of 700+ put you in about the top 0.75% of all U.S. 17-year-olds, in 1974 it put you around the top 0.28%, in 1983 about the top 0.28% and in 1994 about the top 0.31%.

Similarly, scoring 700+ on math put you around the top 1.25% in 1966, the top 0.82% in 1974, the top 0.94% in 1983, and the top 1.52% in 1994.

Using the above percentages for each year, I determined how many SDs above the U.S. verbal or math SAT mean (for ALL 17-year-olds) a 700 score would be on a normal curve, and then divided the difference between 700 and each year’s mean (table I) by that number of SDs, to obtain the estimated SD. Because table I did not have a mean national score for 1994, I assumed the same means as 1983 for both verbal and math.  This gave the following stats:

sds

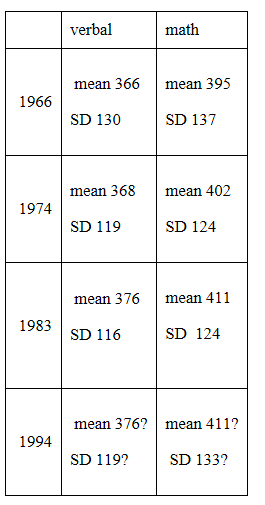
Table II: Estimated means and SD for the pre-re-centered SAT by year, if all U.S. 17-year-olds had taken the SAT, not just the college bound elite.  NOTE: these are not ACTUAL SDs.  These are the SDs you’d expect if the distribution were normal, given the mean score & the top 1% score.


Calculating verbal and math IQ equivalents from the old SAT

Armed with the stats in chart III, it’s very easy for people who took the pre-recentered SAT to convert their subscale scores into IQ equivalents.  Simply locate the means and SDs from the year closest to when you took the PRE-RECENTERED SAT, and apply the following formulas:

Formula I

Verbal IQ equivalent (U.S. norms)  = (verbal SAT – mean verbal SAT/verbal SD)(15) + 100

Formula II

Math IQ equivalent (U.S. norms) =  (math SAT – mean math SAT/math SD)(15) + 100


Calculating the mean and SD of the COMBINED SAT if all U.S. 17-year-olds had taken the test

Now how do we convert combined pre-recentered SATs (verbal + math) into IQ equivalents.  Well it’s easy enough to estimate the theoretical mean pre-recentered SAT for each year by adding the verbal mean to the math mean.  But estimating the standard deviation for each year is trickier because we don’t know the frequency for very high combined scores for each year, like we do for sub-scale scores (see Chart II).  However we do know it for the mid 1980s. In 1984,  23,141 people scored 1330+ on the combined SAT.  Of course most American teens never write the SAT, so we’ll never know precisely how many could have scored 1330+, but Hoeflin argued that virtually 100% of teens capable of scoring extremely high on the SAT did so, and whatever shortfall there might be was negated by bright foreign test-takers.

Thus, a score of 1330+ is not merely the 23,141 best among nearly one million SAT takers that year, but the best among ALL 3,521,000 Americans who were 17 in 1984.  In other words, 1330 put you in the top 0.66% of all U.S. 17-year-olds which on the normal curve, is +2.47 SD.  We know from adding the mean verbal and math for 1983 in Chart I, that if all American 17-year-olds had taken the SAT in 1983, the mean COMBINED score would have been 787, and if 1330 is +2.47 SD if all 17-year-olds had taken it, then the SD would have been:

(1330 – 787)/2.47 = 220

But how do we determine the SD for the combined old SAT for other years?  Well since we know the estimated means and SD of the subscales, then Formula III is useful for calculating the composite SD (from page 779 of the book The Bell Curve by Herrnstein and Murray):

Formula III

formula

r is the correlation between the two tests that make up the composite and σ is the standard deviation of the two tests.

Formula III requires you to know the correlation between the two subscales.  Herrnstein and Murray claim that for the entire SAT population, the correlation between SAT verbal and SAT math is 0.67 however we’re interested in the correlation if ALL American young adults had taken the old SAT, not just the SAT population.

However since we just estimated that the SD of the combined SAT if all 17-year-olds took the SAT in 1983 would have been 220, and since we know from Chart III that the 1983 verbal and math SDs if all 17-year-olds had taken the SAT would have been 116 and 124 respectively, then we can deduce what value of r would cause Formula III to equal the known combined SD of 220.  That value is 0.68 (virtually the same as in the SAT population)*

Now that we know the correlation between the verbal and math SAT if all U.S. 17-year-olds had taken the SAT would have been 0.68 in 1983, and if we assume that correlation held from the 1960s to the 1990s, using the sub-scale SDs in chart III, we can apply Formula III to determine the combined SDs for each year, and of course the combined mean for each year is just  the sum of the verbal and math means in chart III.

satold2

Table III: Mean and estimated SD if all U.S. 17-year-olds had taken the SAT, not just the college bound elite.  NOTE these are not real SDs, but derived from the reverse engineered SDs in table I


Calculating full-scale IQ equivalents from the old SAT

Armed with the stats in Chart IV, it’s very easy for people who took the pre-recenetered SAT to convert their COMBINED scores into IQ equivalents.  Simply locate the means and SDs from the year closest to when you took the PRE-RECENTERED SAT, and apply the following formula:

Formula IV

Full-scale IQ equivalent (U.S. norms)  = (combined SAT – mean combined SAT/combined SD)(15) + 100

*Note: the IQ equivalent of SAT scores above 1550 or so will be underestimated by this formula because of ceiling bumping.  See below for how to convert stratospheric scores.

Was Mensa wrong?

Based on chart IV, it seems Mensa is too conservative when it insists on SAT scores of 1300 prior to 9/30/1974 and scores of 1250 for those who took it from 9/30/1974 to 1/31/1994.  Instead it seems that the Mensa level (top 2% or + 2 SD above the U.S. mean) is likely achieved by scores of 1250 for those who took the SAT close to 1966, and 1216 for those who took it closer to 1974.  For those who took the pre-recentered SAT closer to 1983 or 1994, it seems Mensa level was achieved by scores of 1227 and 1249 respectively.

Of course all of my numbers assume a normal distribution which is never perfectly the case, and it’s also possible that the 0.68 correlation between verbal and math I found if all 17-year-olds took the SAT in 1983 could not be generalized to other years, so perhaps I’m wrong and Mensa is right.

And in Mensa’s defense, they were probably erring on the conservative side (better to turn away some Mensa level scores, than accept non-Mensa level scores).  But it would be nice to know how they arrived at their numbers because it’s obviously way too simplistic to have only two Mensa cut-offs (one before and one after 9/30/74) for all the decades the pre-re centered SAT was used, given the fluctuations that occurred from the 1960s to the 1990s.

Extreme SAT scores in the mid 1980s

The above conversions were based on the assumption that the SAT would have a roughly normal distribution in the general U.S. population, which is likely true for 99% of Americans but likely false at the extremes.

Below is incredibly rare data of the total number of people in 1984 who scored high on the combined SAT.
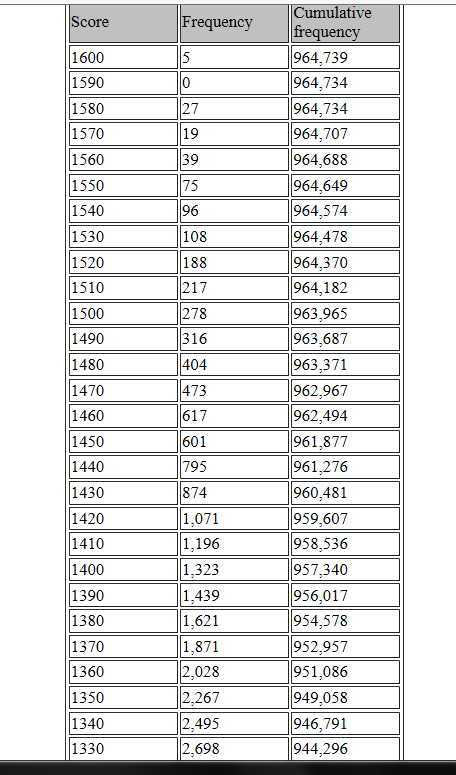
 

sat1984

Table IV


We see that of the 3,521,000 Americans born in 1967, roughly 964,739 would grow up to take the SAT at age 17 in 1984.  And of those who did, only 20,443 scored above 1330.  If one assumes, as the great Ron Hoeflin does, that virtually all the top SAT talent took the SAT in 1984 (and whatever shortfall was madeup for by foreign students), then those 20,443 were not just the best of the 964,739 who actually took the SAT, but the best of all 3,521,000 Americans their age.  This equates to the one in 172 level or IQ 138+ (U.S. norms).

Meanwhile, only five of the 3,521,000 U.S. babies born in 1967 would grow up to score 1590+ on the SAT, so 1590+ is one in 704,200 level, or IQ 170+.  However above I claimed that in the mid 1980s, the combined SAT had a mean of 787 and an estimated SD of 220, which means 1590 is “only” +3.65 SD or IQ 155.  Clearly the SAT is not normally distributed at the high extreme, so Z scores start to dramatically underestimate normalized Z scores, and modern IQ scales only care about the latter.

Thus, for extremely high SAT scores obtained in the mid 1980s, please use table V and not formula IV:

Table V:


1984 sat iq equivalent(u.s. norms) based on normalized Z scores

(sd 15)

1600 170+
1590 170
1580 164
1570 163
1560 161
1550 159
1540 157
1530 156
1520 154
1510 153
1500 152
1490 150
1480 150
1470 148
1460 147
1450 146
1440 146
1430 145
1420 144
1410 143
1400 142
1390 141
1380 141
1370 140
1360 139
1350 139
1340 138
1330 137

What if you scored extremely high on the old SAT in the 1990s, 1970s, or 1960s?

No precise solution is possible for these people until I get more data, but my tentative advice is to map your scores to the mid 1980s distribution and then use table V.  For example, Bill Gates took the SAT circa 1973 and reportedly scored 1590.  According to table III, 1590 was +3.68 SD in the mid 1970s, since the mean and estimated SD were 770 and 223 respectively .  But in the mid 1980s, the mean and estimated SD were 787 and 220 respectively, so +3.68 SD would be 1597 which converts to an IQ of 170+ according to table V.

By contrast Chuck Schumer reportedly scored a perfect 1600 in the mid-1960s (though Steve Sailer is skeptical) which would put him at +3.43 SD according to table III.  +3.43 equals 1542 in the mid 1980s according to table III, and that equates to IQ 157 in table V.

I am not suggesting that a 1600 in the mid-1960s reflects the same level of academic skill as 1542 in the mid-1980s, (the college board worked very hard to keep old SAT scores equal over the decades) but they may reflect the same percentile, relative to the general U.S. population of 17-year-olds, assuming the shape of the distribution stayed roughly constant, and the correlation between verbal and math did too.  Because IQ is never an absolute measure of intelligence, only a measure of where one ranks compared to his age mates in a specific population (typically the general population of the U.S. or U.K. or just the white populations thereof)

*in a previous article I estimated a 0.36 general population correlation between verbal and math by estimating the combined SD from a freakishly high point on the curve, but now that I have more data,  I prefer to do the calculations from a less extreme percentile given the ceiling bumping that distorts the SAT distribution at the extremes.

Open thread week March 25 to March 31, 2018

Please place all off-topic comments for the week here.

Some random thoughts:

Black national merit scholar G-man mentioned some claims by Jordan Peterson (why is everyone suddenly talking about him?) about the uselessness of people below 83 IQ (below 80 is what he means, since that’s about the 10th percentile below which you can’t qualify for the military).

The fact that the armed forces, despite its desperate need for recruits, would turn away the bottom 10% of the IQ distribution is a testament to the incredible validity of IQ.  If IQ were merely measuring social class, why would a low score make you completely useless during times of war?

The man interviewing Peterson suggests that with enough education and training, low IQ people could eventually become adaptable creative problem solvers, but Peterson is having none of it, saying the research is crystal clear.

I also saw this interesting discussion about slavery:


As a little kid I believed whites just walked into Africa and started catching blacks in traps, much like humans do to animals.  Believing blacks were dehumanized in this way, makes it easy for people to believe in HBD.

However as I got older I read that in most cases blacks were sold into slavery.  Many blacks deny this because it makes them culpable in their own victimization, however other blacks prefer to believe they were sold by their own people, than to believe their people were dominated by white people.  Because it’s such a sensitive issue, it’s hard to know who to believe.

It would be interesting to also look at the Arab slave trade.  J.P. Rushton constantly cited hyper-influential Bernard Lewis as the central authority on Arab-black relations in antiquity, however Lewis is very pro-Israel so I don’t know how objective he can be about Arabs, given how emotional both sides get.

I also saw this interesting video by Jesse Lee Peterson about Hillary’s recent visit to India. Not only did she make controversial comments there, but according to Peterson, she kept losing her physical balance.  I hope she’s okay.

It’s easy to say she should just retire and enjoy her grandkids, but when you’re entire identity (FOR DECADES) has been people claiming you’ll be the first woman president, and then to come so close to achieving that dream twice (only to have it snatched away both times) is traumatic.  The moral of the story is NEVER allow yourself to get too psychologically invested in events you can’t control.  It will ruin your life: