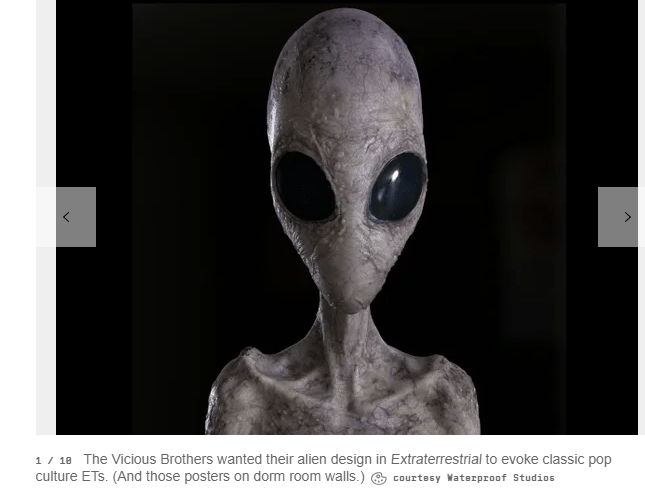
Take the Pumpkin Adult Test of Math Ability (PATMA)

Math ability is one of the best proxies for IQ so I decided to create a little math test for anyone who’s interested. It’s completely anonymous. There are only 10 questions ranging from extremely easy to extremely difficult. The easiest question can probably be answered by over 99% of the general U.S. adult population while the hardest can probably be answered by less than 0.1%. To enhance the g loading, I picked questions that emphasized mathematical intuition and conceptual understanding as opposed to brute number crunching.

There’s no time limit, but try to take the test in one sitting without use of calculator, pen, paper or other aids, though I doubt they would help much. Take the anonymous poll to let us know how you scored.

Why the high reliability of IQ tests is misleading

Tags

, , ,

Anyone who’s taken multiple intelligence tests knows dramatically the scores can vary. For example, we have commenters on this blog who claim as much as 2 standard deviation gaps (2 SD) between their SAT scores and their Wechsler scores. Imagine if two different stadiometers gave a 2 SD difference in height (that’s over 5 inches!) . Why is a level of imprecision that would never be tolerated in the hard sciences handwaved away in psychometrics, and what do we do to fix it?

At first glance IQ tests seem incredibly reliable as evidenced by the 0.98 reliability (standard error (SE) of 2 points) reported for the WAIS-IV. But how was this number arrived at? For most subtests, reliability was measured by randomly dividing the subtest in half (odd vs even items), taking the correlation between both halves, and then correcting the correlation for the full length of the subtest. Once they have the reliabilities for all the individual subtests, they then combine them into a composite reliability for the entire scale.

But if the subtest level reliability is calculated by randomly dividing the subtests items into odd or even numbered items, why not calculate the full-scale IQ reliability by dividing the subtests into odd or even numbered subtests? The WAIS-IV might be an extremely reliable measure of how smart you are on the abilities measured by the WAIS-IV, but are the abilities measured by the WAIS-IV a representative sample of all cognitive abilities?

Unlike the WAIS-IV, the original WAIS was arguably a pretty representative sample of human cognition. Although there was some selection bias for subtests that correlated well with other subtests, for the most part Wechsler just wanted a very diverse group of subtests that were easy to administer, fun to take, and provided clinical insights into how people think.

A psychotic mental defective obtained the following scores on the original WAIS (keep in mind that subtest scores have a mean of 10 and an SD of 3, unlike the verbal, performance and full-scale IQ’s that have a mean of 100 and an SD of 15)

Information4
Comprehension5
Arithmetic3
Similarities3
Digit Span9
Vocabulary4
Digit Symbol0
Picture Completion8
Block Design4
Picture Arrangement4
Object Assembly7
Verbal IQ71
Performance IQ66
Full Scale IQ67

So using my favorite standard deviation calculator, we find this person has a mean subtest score of 4.64 with an SD of 2.54. Now because there are 11 subtests, we divide this SD by the square root of 11, which gives a standard error (SE) of 0.77. What that means is that assuming the 11 WAIS subtests are equivalent to a random sample of all cognitive abilities, then this person’s true average level of functioning has about a 2/3rd chance of falling anywhere from a scaled score of 3.87 and a scaled score of 5.41 (+/- 1 SE). For his age (17) on the original WAIS, this equates to a true IQ range of 61 to 72, implying an SE of 5.5! (more than twice as high as the SE claimed by the WAIS-IV based on a misleading definition of reliability)

We can arguably say with 95% certainty that if the WAIS included every cognitive ability possessed by the human brain, his full-scale IQ would be anywhere from 56 to 78 (+/- 1.96 SE). But that’s a bit like saying his height is anywhere from 5’2″ to 5’6″. Unless this person has an abnormal amount of subtest scatter, it may take an IQ test with over 60 subtests for IQ to have a meaningful reliability as high as height’s.

New data on Trump’s cognitive score

Tags

, , , , ,

Trump’s test scores have been in the news a lot lately. It started over a year ago when Trump’s former lawyer Michael Cohen told congress that he threatened Trump’s university Fordham not to release his SAT scores (which is illegal anyway). An official from Fordham confirmed this.

More recently, Trump’s niece Mary Trump has said that when Trump transferred to the University of Pennsylvania he hired a boy named Joe Shapiro to take his SATs for him. The White House denies this.

More recently still, Trump has been bragging about acing the Montreal Cognitive Assment (MOCA) during a screening for dementia.

Trump may sound like an idiot to most liberals but remember that IQ is scored on an age based curve and many people in their 70s can barely string together a sentence, so the mere fact that he can argue with the press in a fast and entertaining way should put him comfortably above IQ 100 (the population mean). But how much much above 100?

Trump claims to have scored 30 out of 30 on the MOCA but given Trump’s history of exaggerating personal accomplishments (net worth, TV ratings, etc) that’s highly suspect. His doctor confirmed that, but when it comes to presidential politics, even medical reports can’t be trusted.

But assuming he’s being truthful, I emailed Dr. Ziad Nasreddine (the test’s creator) to ask what percentage of non-demented elderly people score perfect on this test. He replied “10% of normals score 30/30”.

Of course the MOCA does not call itself an IQ test, but aside from the brief administration time, incredibly low ceiling and bias towards memory items, it’s content is virtually indistinguishable from one. It includes general knowledge “What’s today’s date?”, picture vocabulary “identify pictures of common animals”, spatial reasoning “draw a cube”, arithmetic “count backwards from a 100 in multiples of 7”, short-term memory “repeat words”, and verbal abstract reasoning “state how common objects are alike”.

Still, I wouldn’t recommend using this as an IQ test in above average populations. A Nobel Prize winning theoretical physicist could have a verbal and mathematical IQ in the stratosphere, but because they lack the spatial IQ to draw a clock at a given time, they’d end up with a score lower than Trump’s.

On the WAIS-IV, if an elderly person scores in the top 10% of the “healthy population”, they’re assigned an IQ of 119, however by excluding the demented from the norms, I’ve long felt the WAIS-IV underestimates elderly IQs. IQ is supposed to reflect your cognitive rank within the range of cognitively normal variation so it makes sense to exclude people with gross chromosomal abnormalities (i.e. Downs syndrome) from the norms, but dementia is arguably just the low end of normal elderly cognitive variation.

Research suggests 13.9% of Americans aged 71+ have dementia, so about 86.1% do not. So if Trump scored in the top 10% of the non-demented, that puts him in the top 8.6% of the general population which equates to an IQ of 120 but obviously since that’s the test’s ceiling, he could be much higher.

BREAKING NEWS: Trump sends well-wishes to Ghislaine Maxwell

Tags

, ,

At a press conference about an hour ago Trump was asked about Ghislaine Maxwell and whether she would expose powerful men, and he responded by saying that he wishes her well. Social media reacted with disgust but the MSM predictably buried the story (not to protect Trump who they despise, but to limit interest in the Epstein case).

Why would Trump speak positively of a woman as vilified as Maxwell? One possibility is she has dirt on him and he’s sending her a message “be nice to me and I’ll pardon you”. Another possibility is that Maxwell used her high social IQ to complement Trump in the past (“my oh my you are rich!”) and this appeal to Trump’s ego overwhelmed any disgust he has with her alleged behavior.

Either way, this will create enormous cognitive dissonance for the QAnon morons who will likely dismiss it as more 5-D chess on Trump’s part.

How life saving advice from Oprah took down Jeffrey Epstein

Tags

, , , ,

Back in 1991, Oprah had on a guest named Sanford Strong who gave STRONG advice to women being physically attacked:

NEVER LET THEM TAKE YOU TO THE SECOND LOCATION!

This advice resonated deeply with Oprah and she knew it would have the same effect on her viewers.

Over the years Oprah’s intuition was confirmed as she got letters from viewers about how this advice saved their lives.

But I bet not even Oprah is aware that none other than Maria Farmer (the alleged victim who brought down Epstein) heard this advice. When a thug was allegedly sent to kill her she remembered the advice she heard on Oprah:

NEVER LET THEM TAKE YOU TO THE SECOND LOCATION

So Farmer began clinging to house and did everything in her power not to leave. She would survive to report everything to the authorities and that’s what brought down Epstein.

Converting the post-2016 SAT to IQ

Tags

, , , ,

Commenter blubbalubba writes:

When will you do another study on the post 2016 SAT? There was a 60 points inflation. It would be great if you looked into this recent change.

For years I’ve complained that the SAT is normed on college bound students, but in order to convert it to IQ equivalents, we need to know how the general U.S. population would score. Well perhaps someone from the college board was reading because their website has now started publishing two types of norms:

Nationally Representative Sample Percentiles are derived
from a research study of U.S. students in grades 11 and
12 and are weighted to represent all U.S. students in those
grades, regardless of whether they typically take the SAT.


SAT User Percentiles are based on the actual scores of
students in the past three graduating classes who took
the current SAT during high school. These user percentiles
are reported on tests completed in August 2019 through
June 2020.

So for example, a combined score (verbal + math) of 1055, which makes you dead average (50th percentile) among the college bound elite who takes the SAT, would make you slightly above average (59th percentile) among the nationally representative sample.

One problem is even the nationally representative sample is a bit elite because many of the dullest Americans don’t make it to grade 11, let alone grade 12. so how do we adjust for this?

It turns out we don’t have to because only 6% of U.S. high school students now dropout, and even assuming none of this 6% would score high, the percentiles would only change by a fraction of a percent. For example, if you score in the top 1 out of 100 high school seniors, including the high school dropouts would only move you to 1 out of 106. A trivial difference (at least at the high end)

Verbal SAT (Evidence-based reading & writing)

On this section the median high school senior scores 510 so let this = verbal IQ 100. The 98th percentile is 720 so let this = verbal IQ 130. Thus:

Verbal IQ = 27 + 0.14(verbal SAT)

Math SAT

On this section the median high school senior scores 505 and the top 2% score 740, so let these scores equate to math IQs of 100 and 130 respectively. Thus:

Math IQ = 36 + 0.13(math SAT)

Combined SAT (verbal + math)

Overall the median high school senior scores 1055 and the top 2% score 1480, so let these scores equate to composite IQs of 100 and 130 respectively. Thus:

IQ = 26 + 0.07(Combined SAT)

Is the SAT an IQ test?

I have never found a study correlating the SAT with Wechsler IQ in the general U.S. population but I did find such a study correlating the WIAT (which also measures reading and math knowledge) with IQ in a very representative sample of U.S. 16-19 year-olds (n = 142). Reading comprehension and math reasoning correlated 0.71 and 0.82 with Wechsler full-scale IQ respectively (WAIS-III WMS-III Technical Manual page 85-86).

However there are several reasons for thinking the SAT may correlate somewhat less: 1) the enormous importance of the test for some creates huge differences in motivation, test-prep and cheating, and 2) people diagnosed with learning disabilities can take the test without time limits, 3) my research on the Wechsler IQs of Ivy Leagues students suggest they regress at least a third of the way to the mean from their SAT scores, suggesting a correlation no higher than 0.66.

Mapping the brain

I stumbled upon this nice discussion about the human brain with UChicago neuroscientist Bobby Kasthuri. People like commenter RR have argued that the human mind is too miraculous to be explained by biology but it’s more likely that the biology is just incredibly complex. For example, let’s say the average human brain has 86 billion neurons, and each neuron might be connected to 10,000 other neurons. That’s 860000000000000 connections! The reason brain size is moderately correlated with IQ is perhaps because the bigger the brain, the more room there is for more neurons and more connections. In addition, smart brains have more fatty substance surrounding the connections to make them transmit information faster which also takes up space.

But the larger point is if we could map all these 860000000000000 connections we could capture not only your intelligence, but your hopes, dreams, memories, fears, anxieties, passions, sexual fantasies…your very soul, and maybe one day we could upload your consciousness, your “soul” on a computer. An interesting philosophical question is whether we’re uploading you; in my opinion it would not be you because in theory, this could even be done while you’re still alive without you knowing it, which makes it a separate entity.

Anyway, the interview doesn’t go into all that sci-fi stuff but it does discuss the practical problems of mapping brains. You can listen here.

So different, yet so alike

Tags

, ,

100,000 years from now, scientists might discover the bones of today’s Dutch and today’s African pygmies and say:

There’s a height difference of 4.3 standard deviations. This is much greater than the height difference between Homo Sapiens and Neanderthals; the Dutch and the Pygmies must be two different species!

But then another scientist will come along and say:

Height is only one trait. Look how similar their skulls are. Both have nice round skulls compared to the football shaped Neanderthal skulls. Look how flat their faces are compared to the prognathous Neanderthals. So while the height difference might be 4.3 SD, the differences in facial angle and cranial sphericity is so little, so on average, the phenotypic gap between them is much smaller than the gap between either of them and Neanderthals. So these are different races within Homo Sapeins, not different species.

I find it fascinating that despite all the enormous physical variation among different human ethnic groups, we all have the shared phenotype of round cranium, flat face tucked under the brain case, small jaw, and light bones that separate us from Neanderthals.

One of these in not like the other five:

Modified image found here using

Terrifying discussion about the Epstein case

Among the claims made in the below video:

  • Epstein and Maxwell were allegedly ethnic supremacists, eugenecists and anti-black racists. This would explain why there were no blacks in Epstein’s social circle, other than perfect physical specimen Naomi Campbell. Not sure why Epstein and Maxwell were such alleged genetic supremacists since they were pretty ugly themselves. Maybe because they knew they had high IQs.
  • Even their blond blue eyed victim says she was allegedly treated like trash and told she was a nobody because she was the wrong ethnic group and this prevented her from attending certain country clubs.
  • When allegedly recruiting young girls to be with Epstein, they asked about school grades. Probably because Epstein wanted high IQ babies and believed IQ has a huge genomic component.

The importance of species

Scientists group living organisms into categories known as species. There is no universally agreed upon definition of species but a popular idea is that species are groups of organisms that can successfully interbreed. So because a Human can’t get a Chimpanzee pregnant, we can clearly state they’re different species.

This concept becomes problematic when we talk about ring species. That’s when one animal can’t interbreed with another, but a third animal can interbreed with both. What species does the third animal belong to?

But ring species are rare, so most of the time, reproductive isolation works well for neatly classifying animals into nice discrete categories with strong genetic walls between them.

The problem begins when we want to speak of species across time. For example, wikipedia claims Homo Erectus lived from 2 to 0.1 million years ago (mya) before evolving into our species about 0.35 mya. In order for these numbers to fit the reproductive definition of species, we’d have to believe that all Erectus from 2 to 0.1 mya could interbreed with each other and yet none of them could interbreed with even the first Homo Sapiens.

But if evolution is gradual, we’d expect the last Erectus to be more similar (and thus more reproductively compatible) with the earliest Sapiens than with the earliest Erectus and thus the boundary between the two is wholly arbitrary.

Of course even if we reject reproductive compatibility as our criterion and instead go with morphological similarity, the same problem ensues. One species blends into another.

Richard Dawkins makes the point:

But what if evolution isn’t gradual? According to Punctuated Equilibrium theory by Niles Eldridge and Stephen Jay Gould, the bulk of evolution occurs in relatively rapid jumps, followed by long periods of stasis.

Image found here

As we can see from the above pictures, if evolution is gradual, where we draw the line between species 1, 2 and 3 is subjective because we’re artificially imposing discrete categories on a continuous process, but if evolution is punctuated, then the new categories occur naturally, whenever evolution plateaus.

Of course not all plateaus signify a new species. Some might merely indicate a new race or ethnic group. Others might indicate an entirely new kingdom of life (i.e. plants vs animals). It should all depend how big the morphological jump is before the plateau. For example we might say a 10% jump in overall phenotype indicates a new race while a 40% jump indicates a new species etc. A population might have to become a new race four times before it qualifies as a new species.

You might be asking what does it matter when one species stops and another one starts. It matters a lot when deciding what species has survived the longest, conquered the most environments, or has the greatest biomass. None of those accomplishments are meaningful if the very identification of species is arbitrary.

So how old is our own species? From about 1997 to 2017, the consensus was that our species was about 0.2 mya since that was the approximate age of both the Mitochondrial Eve and the oldest anatomically modern human skulls (found in Ethiopia). A more recent find in Morocco threatens to push the date back to over 0.3 mya, however Richard Klein argues that it’s a proto-modern human, not a modern one. So perhaps the Moroccan skull does not belong to any species. It might be from a period of rapid evolution predating evolutionary stasis.