
Evidence continues to debunk the popular idea that IQ is largely irrelevant to success above 120, and my less successful readers are going absolutely ballistic. The reason this idea is so popular (and its debunking so threatening) is that the internet is crawling with people who are either only moderately intelligent or only moderately successful; and they take comfort in believing they achieved their modest success by being way smarter than the homeless guy on the street, but hysteria ensues if you suggest that some gazillionaire pizza mogul is richer than they are because of brains. Thus, these self-serving elitist snobs want IQ and money to be correlated, but only up to either their level of money or their level of IQ (whichever comes first). This allows them to feel intellectually superior to the poor who they view as too dumb to meet basic needs, while also feeling morally superior to the rich who they view as greedy and ruthless.
This is reminiscent of the white supremacists of old who believed that IQ and brain size were only correlated at the low end, because tropical people had small brains, but irrelevant at the high end, since Mongoloid races had the biggest brains. Stephen Jay Gould mocked this as an unbeatable argument: “Deny it at one end where the conclusions are uncongenial; affirm it by the same criteria at the other.”
Unfortunately for the hypocrites, statistics seldom work that way.
The median income (in 2014 dollars) of seven different IQ levels:
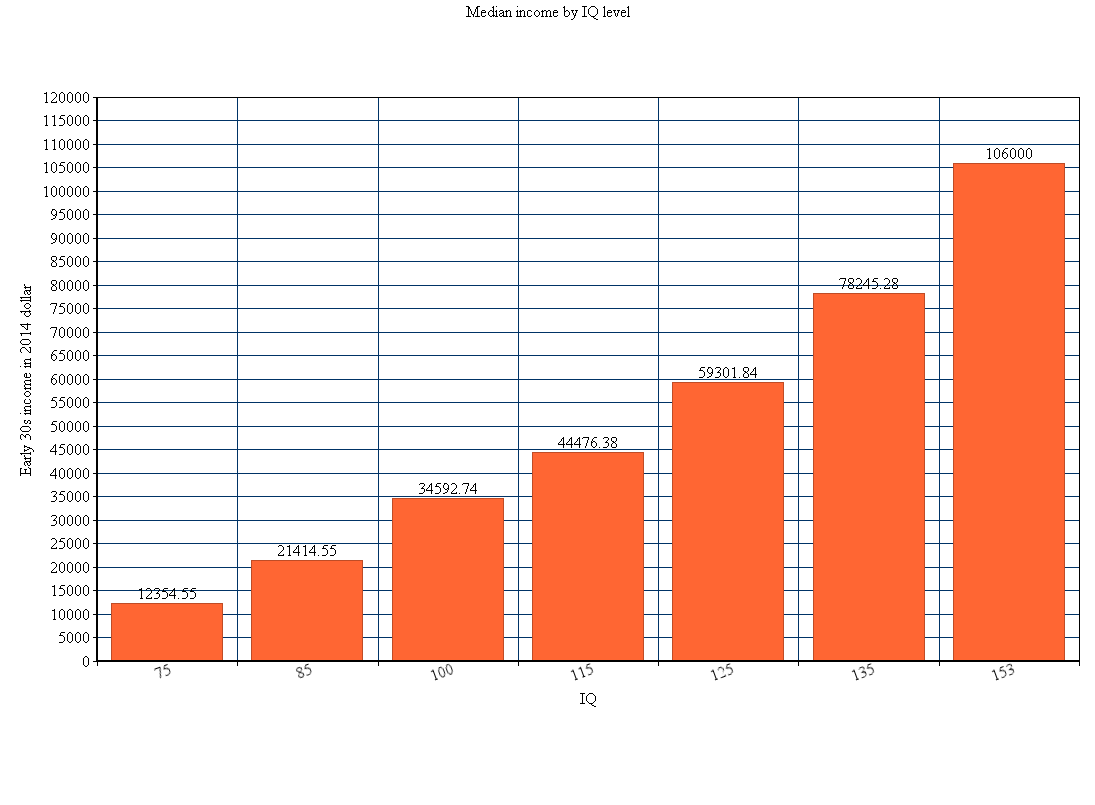
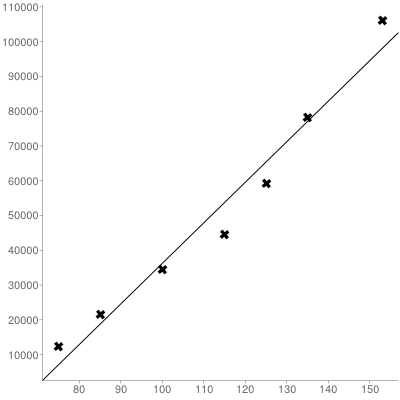
In the above chart, the income for IQ 153 people was documented here. The incomes for all the other IQ levels was documented here, but because those were in 1993 dollars, I converted them to 2014 dollars using this calculator. The below scatter plot shows how linear the relationship is, well above IQ 120:
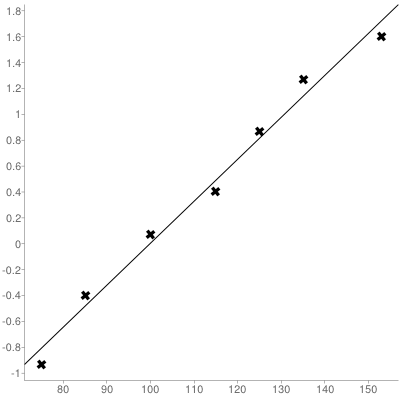
Because income can be quite skewed at the extremes, it also makes sense to convert raw dollars into normalized Z scores. This was accomplished in the below chart by converting the above dollar values into income percentiles for Americans in their early 30s using this calculator. The incomes are then assigned Z scores based on the Gaussian distribution. When this is done, the correlation between IQ and income continues to be beautifully linear well above IQ 120:

actually peapea that chart looks perfectly sensible to me.
dunno who these “hypocrites” are.
but I also dunno why you think 106k is a lot.
as lion has said the middle income range is much more meritocratic than the extreme high end.
lion thinks he’s an underachiever for his IQ.
he is in Manhattan, but in the US at large he’s pretty close to his IQ percentile in income.
He probably feels like an underachiever because as you’ve implied, those who are richer, are so much richer, while those who are smarter, are only
a bit smarter. The IQ distribution is much more equitable than the income distribution causing the Lion to believe in value transference .
But that’s probably largely illusory since there are massive gaps in learning speed among people with even very similar IQs
the popular idea that IQ is largely irrelevant to success above 120
not irrelevant just less and less relevant. 120 is a threshold. below it you’ve got no chance of winning a Nobel in natsci, above it you do.
…learning speed…
that’s way too abstract. it depends on what the subject matter is one is asked to learn. but even so, this is then a factor OTHER THAN IQ.
again why was Langan making 6k in his 40s?
The point is it’s a lot more than IQ 120s make, both in absolute dollars & normalized Z scores
it appears to be from your figurin’.
but the GSS and Shoe’s chart contradict this.
so you’re right and they’re wrong?
if you suggest that some gazillionaire pizza mogul is richer than they are because of brains.
there are ways of making a fortune which are despicable, and these tend to be the ways that stupid people make fortunes.
Put the z score of IQ on bottom and you will see how the returns diminish.
Lol every chart you put up shows the same thing. -.8 to 0 from 80-100. 0 to .4ish from 100-120.
Before getting into ANYTHING else…
Without questioning any assumption….
~-1.6 iq z to 0 iq z = 1.6z income jump. (Your z for income 12k is wrong; it’s under the 5th percentile)
From 0 iqz to 1.6iqz = .85z in income.
Diminishing returns on the face of the data.
*~1.64z income jump.
And noteworthy also is that the next big iq jump is NOT 1.6z (which still shows <.85 jump in income z even if we pretend it is). The jump is something like 1.9z and it still shows less of an increase…..
All right there in your very own presented data.
so pp made it look linear by overestimating the percentiles at low income.
No I was lazy. It’s still diminishing but the z is -.9
And the IQ 100 is z ~ .08….so ~1z there total not 1.6.
Pretty incredible considering this is what it is when we accept EVERYTHING
If you put in a comma in the prompt of that other page I think it treats it as a decimal.
Swanknasty,
You are cherry picking. If the relationship wasn’t more or less linear from at least IQ 75 to IQ 153, the data would not so closely fit the line of best fit.
It’s so simple.
I’m not cherry-picking. I’m using your own data points…..
The returns are clearly less. .98 from 75-100. .85 from 100-125. and <.85 from 125 to 150 (and 153!).
The returns are clearly less. .98 from 75-100. .85 from 100-125. and <.85 from 125 to 150 (and 153!).
The diminishment in returns you’re claiming is very small. Too small to be noticeable to anyone looking casually at the graph & perhaps not statistically significant.
But if you insist on splitting hairs, it’s interesting that strongest threshold for diminishing returns seem to be around IQ 100, not IQ 113 (college grad level ) or IQ 120 (the usual threshold people cite).
The country is designed for IQ 100s (the typical IQ) so if you’re going to argue a critical threshold, it would make sense to argue that one.
Okay, first we agree that there ARE diminishing returns. So you stating otherwise is simply incorrect. Now we can talk about the fact that, despite your best efforts to show otherwise, diminishing returns remain. First of all, a 20,000 jump from 12k to 34k is different than the 25k jump from 34k to 59k. And so on, and so on. You are treating all amounts of income at all levels as equally indicative of “wealth.” This is incorrect. You should separate the data into three separate classes — poor, middle class, and “rich.” Income gains should be assessed by their class/lifestyle impact — because you are using income, again, as a proxy for “wealth.” If we viewed the data in this way, we would find that those returns are even more diminished.
and I’ve said several times that the jump from dumb to average is the greatest gain and that ALL returns diminish from there.
‘The diminishment in returns you’re claiming is very small. Too small to be noticeable to anyone looking casually at the graph & perhaps not statistically significant.’
K. Dumb to average is a percentile difference of 35. average to pretty smart difference of 27. pretty smart to ridiculously smart difference of 14. Income, after the poverty line, is a relative measure. Seems statistically significant to me — a drop off of ~10 percentile movement with each large increase in IQ.
You drew a huge line on the graph and your last datapoint is spaced differently than your other datapoints. IMO your graph is a little misleading and so it’s unsurprising that someone wouldn’t notice the diminishing returns.
Okay, first we agree that there ARE diminishing returns. So you stating otherwise is simply incorrect.
Not incorrect in any meaningful sense. The diminishing returns you claim are trivially small. Practically insignificant and possibly statistically insignificant. What is possibly substantially incorrect was your original statement in an earlier thread that launched this whole debate:
So, these income facts just seem to make the general case that’s already floating around in the blogosphere: if you’re an idiot you’ll probably be poor, if you’re smart you are about as likely to get rich as a “normal.”
The data seems to strongly contradict that
First of all, a 20,000 jump from 12k to 34k is different than the 25k jump from 34k to 59k. And so on, and so on. You are treating all amounts of income at all levels as equally indicative of “wealth.” This is incorrect. You should separate the data into three separate classes — poor, middle class, and “rich.” Income gains should be assessed by their class/lifestyle impact — because you are using income, again, as a proxy for “wealth.” If we viewed the data in this way, we would find that those returns are even more diminished.
This all sounds very subjective and arbitrary. Income can be objectively measured and normalized. Whatever you’re defining as “wealth” is much more vague.
‘The data seems to strongly contradict that’
No they do not. 106k is nowhere near “rich,” and that is one of the many problems here. Rich is a relative state of income. The fact that that the percentile increase rapidly drops off with each HUGE jump in IQ tells us all we need to know.
‘This all sounds very subjective and arbitrary. Income can be objectively measured and normalized. Whatever you’re defining as “wealth” is much more vague.’
Regardless of whatever it “sounds” like to you, the fact that both academics and laypeople talk about a “middle class” versus an “upper class” versus a “lower class” should indicate that these metrics are useful ways of viewing income. And again, you are using income as a proxy for wealth. Wealth in and of itself is much more subjective and arbitrary than poverty. It is a relative measure. Ergo, it simply is not good enough to treat all income jumps — in dollars — as equal indicators of wealth.
K. Dumb to average is a percentile difference of 35. average to pretty smart difference of 27. pretty smart to ridiculously smart difference of 14. Income
Even if these percentiles are accurate, percentiles are very misleading measures of differences. For example, an IQ of 115 is around the 84 percentile, an IQ of 130 is at the 98 percentile and an IQ of 145 is around the 99.9 percentile. The gap between all these IQs is 15 points but notice the diminishing gap in percentiles. Percentiles compress differences at the extremes which is why Z scores are used.
Yes, I am familiar with percentiles. IQ is symmetrical — -25 to + 25 IQ = ~-/+1.6z. Here, we have one jump representing .98 z, and another jump representing ~.78z, and the next showing less. The z scores show the same diminishing return. You”re quick to dismiss the diminishing return as “insignificant” but it’s 25% less in the first jump and ~50% less in the second instance. So looking at how those jumps materialize in percentiles is useful. With re: to income, a 10 percentile leap is significant.
The next main problem is that the qualifier “rich” applies to income z 3 (at a lower bound).
I’m surprised that you didn’t just point to the study of billionaires that asserted 45% of them have an IQ of ~135+.
also, I didn’t notice before but now I do. Your key data points come from you personally manipulating other information. For example, the precocious youth study, you “regressed” the IQs lower (favorable for your position), and the same goes for the 1 in 10,000 group — you “regressed” the IQs lower here as well.
Without this regression and accepting the IQ data as given, the diminished returns would be more pronounced.
Without this regression and accepting the IQ data as given, the diminished returns would be more pronounced.
But you really have to regress the SMPY data because those kids had two opportunities to qualify for the study: verbal SAT or math SAT. When people get two scores and are only judged by the higher score, this creates an upward bias in the scores that must be corrected.
I don’t think you need to perform such a regression esp in the context of income at all. Whatever IQ is highest is likely the IQ they would use to make money or develop, and indeed, the asymmetry in score probably reflects different interests more than raw ability (unless the differences are large…which is rare anyway)
I don’t think you need to perform such a regression esp in the context of income at all.
Yes you do because all the income data from non-gifted people was from people who got ONE score. You can’t compare people who got ONE score to people who got TWO scores and were assigned the highest one because the latter had twice the chance to score high and thus have an unfair advantage. Failing two adjust for this exaggerates the IQ differences.
the group was already selected for overall IQ beforehand on the Iowa tests. 128 overall IQ is the bottom of the group, 97th tile. 135 just seems too low for the group. You just made up the 142 average math IQ number by adding half the range to 128. THEN you regressed this number. I’d say leave well enough alone and stick to that average…
Swanknasty, the group that scored above the one in 10,000 level on one section of the SAT regressed to the mean on the other section of the SAT, which means their overall SAT was below the one in 10,000 level. This was implied in the paper. I may do a revision if I can find more exact numbers.
I agree the high figures are a bit imprecise, but not doing any adjustments is a bad idea because their highest score overestimates their IQ.
I’m not saying that there wasn’t any regression….but you have a likely floor of 128 before any of them even touched the SAT. Then you have a mathematical floor IQ of 138. To regress that back to an overall 128 IQ seems wonky — some of the initial students no doubt failed to make the other cut-off.
I agree that the IQ 135 is the most uncertain in my charts. I could have just left it out and had the graph jump from IQ 125 to IQ 153
IIRC you also regressed the 153 IQ as well, though.
The kids scored about IQ 158 on one section of the SAT. Since each section correlates about 0.91 with the composite, their composite score would have been only 91% as extreme; hence IQ 153
Welll…..
That seems too low as well. A composite score that gives 153 is 1490.
You can’t just .91 one section to IQ based on the correlation between sections, doing this assumes a pretty wide split between sections. In this instance a math score of 780 and verbal score of 710 is required.
According to this, gaps favoring V are 13 points on average. On the old test.
http://en.m.wikipedia.org/wiki/Math–verbal_achievement_gap
Sooooo……your regression seems too steep idk.
You can’t just .91 one section to IQ based on the correlation between sections,
I’m not doing it based on the correlation between sections, 0.91 would be roughly the correlation between one section and the COMBINED score.
doing this assumes a pretty wide split between sections. In this instance a math score of 780 and verbal score of 710 is required.
No, what I mean is that if you have a Z score of +3.87 on one section, then you’d have a Z score of 0.91(+3.87) on the COMBINED score (verbal + math). And you can’t just multiply scores by correlations; what gets multiplied is the DIFFERENCE between scores and the mean, and such differences are most conveniently expressed as Z scores.
According to this, gaps favoring V are 13 points on average. On the old test.
No, they mean the AVERAGE score on one section was 13 points higher than the AVERAGE score on the other. That’s quite different from the average GAP between scores, and such gaps would increase the higher you score on one section or the other because there’d be greater regression to the mean.
Yes I know they are discussing the average difference in that context. However that’s a useful fact to consider when you are talking about the implications of your regression.
It still produces a wide ability split. The unreliability we’re talking about with high scores makes more sense with tests taken at significantly different times rather than half of a test taken at the roughly same time.
a lot of engineers and scientists are stuck just north of 100k, which is the ceiling for non-managers or commissioned salesmen in most American businesses.
stats from the US are basically MEANINGLESS for this reason. the gap between managers and managed in the US is obscene compared to other developed countries.
For 150 IQ to only get an individual to about 100k proves the point. I don’t know much clearer it can be.
and even that is dubious.
it must be taken into account that real wages over the last 30+ years for various percentiles have diverged.
that is the conservatard mantra “a rising tide lifts all boats” or “trickle down economics” is an EMPIRICAL failure.
Bush 41 was right. it’s “voodoo economics”.
and btw pp I voted for Dole and for Bush 43 the first time.
but times have changed. the rhetoric of the GOP was always a lie, but now it’s just INSANE.
It’s dubious but it’s rare that an argument fails even after you accept all the assumptions lol
“but times have changed. the rhetoric of the GOP was always a lie, but now it’s just INSANE.”
It wasn’t a lie then and it’s not a lie now. But it doesn’t apply under all circumstances. It didn’t apply for the Soviet Union, Communist China, East Germany, North Korea or Cuba. And it applies less and less in the US for the same reasons. The last 2 min are golden.
For 150 IQ to only get an individual to about 100k proves the point
The only point it proves is that the IQ income correlation is not very high. I never claimed it was high; I only claim it is moderate, and more or less linear through virtually the full range of both IQs and incomes (though extreme incomes need to be normalized)
Yes. That lone data point only indicates a weak correation. BUT, the 75 IQ and 100 IQ datapoints together with the 153 IQ datapoint already show diminishing returns…
was Ford ever regarded as a robber baron?
robber baron and rich person aren’t the same thing.
a robber baron in the late 19th c was someone whose fortune didn’t come from value creation, but from business practices which are today illegal.
anyway, the facts are simply contrary to MF’s theories over the last 50 years.
the last two minutes are just more retarded bullshit and lies.
so libertariantards have an excuse for not being super rich.
da guhberment.
as fran liebowitz said,
whoever thinks the richest are the smartes has either never met a rich person or never met a smart person.
I remember Simon Winchester met the American who’d bought Henderson Island. he’d made his fortune in the coal fields of western Virginia (not West Virginia).
he told Winchester he’d bought the island to escape the “socialists” and that he’d never read a book since hs.
TYPICAL.
@Robert Gabriel Mugabe It’s not irrational to buy an island to escape socialists. It’s a pretty good plan actually. Reading a book doesn’t make you smart, not reading one doesn’t make you dumb. What does make you dumb is using anecdotal evidence where the anecdote doesn’t conclusively confirm to your thesis.
pp works with people I supposedly wouldn’t look in the eye.
reminds of the Ramstein vid for Ich Will where Paul Landers makes the security guard peee himself.
i’m Paul Landers in that vid.
Is committing more and opening flanks in all directions to be attacked.
Come on, you’re saying that the ” IQ ” alone, is the only significant predictor that can increase income or that relates to high income.
However, as we are not robots, we also have personality. The most important factor in explaining the high income individual is the type of interaction that occurs between personality and intelligence.
If you are very intelligent (iq, eidetic memory, talent, great character, whatever) and is psychotic, the interaction between your personality type and your intelligence will tend to work against their contextual success in modern society.
If you have an interaction between high intelligence, especially the technical type, with an ambitious and focused personality, so chances for financial success are very high.
You’re just ignoring all the rest to the silliness of the ultra-determinism iq.
It is not just IQ. If it was just iq, the vast majority of people with very high IQ would be rich, would be billionaires.
Most billionaires ” has ” very high IQ, but most people ”with” very high IQ, are not (bi) millionaires.
The research is showing that you seems to be focusing on income and not on IQ.
The relationship between psychopathic features and high income is also very high. Please, I’m not saying that Bill Gates is a psychopath, equal to Hannibal Lecter. But there is no doubt that to reach the highest levels of society, there needs to be ” slightly ” psychopath. The world is not this Care Bears, you’re thinking.
Come on, you’re saying that the ” IQ ” alone, is the only significant predictor that can increase income or that relates to high income.
No, all I’m saying is be consistent. If you’re going to say low IQ causes poverty, then also say high IQ causes wealth.
The relationship between psychopathic features and high income is also very high. Please, I’m not saying that Bill Gates is a psychopath, equal to Hannibal Lecter. But there is no doubt that to reach the highest levels of society, there needs to be ” slightly ” psychopath. The world is not this Care Bears, you’re thinking.
I agree that being evil also helps one make money, but again, be consistent. If billionaires are more evil than the average American, then you should also say that the average American is more evil than the poor.
Maybe yes, maybe not.
Psychopathy is the rule in nature. Are derived from nature, acts of psychopathy practice every day, for example, when we kill an insect by sadism.
If the poor were in a position of power, it tends to be worse than the rich with high IQ, because he would not have discernment to cook a frog. Poor tends to be impulsive.
Psychosis is much higher in the upper class as the low. Where is psychotic, psychopath has the criminal and genius, which are derivations of psychosis.
The distribution of traits that accompany extreme and very low intelligence is not linear. Middle class is a social species, elite and proles are other kind of socio-two species of parasites.
Poverty is defined differently than wealth. That is your main problem here. Poverty is an inability to meet basic needs. Wealth is more arbitrary…
Below about 100k, no one disagrees with you that IQ significantly predicts income.
Below about 100k, no one disagrees with you that IQ significantly predicts income.
Well the highest IQ level we have data on (150s) makes $106 K but if we had data on IQ 160s and IQ 170s it’s unclear how much more (if at all) median income would rise. It’s possible that at such extremes it may even decline (Chris Langan )
However if you want to reverse it & predict median IQ from income levels, I have no doubt that 6 figure earners are dumber than 7 figure earners who are dumber than 8 figure earners etc
Even among billionaires on the Forbes 400, those at the top of the list (bill gates) seem smarter than those that only narrowly qualify for the Forbes 400, but the evidence here is admittedly indirect
Hence the qualifier “about 100k.”
And maybe you’d find that in the different groups of high income earners. However, that would probably come from the education that each group has received. You have to find a way to separate IQ from education attainment.
Where is the evidence that pyschopathic features helps you make money? Pyschopaths are bad at maintaining relationships, which is vital for most ways to make money. PYschopaths are good at short term manipulation, but that’s not enough to become rich. In fact it undermines the motive to make the sort of long term effort that results in getting rich.
”No, all I’m saying is be consistent. If you’re going to say low IQ causes poverty, then also say high IQ causes wealth.”
Contextually speaking, yes.
http://majorityrights.com/weblog/comments/intelligence_or_control_of_the_money_supply
yes it is clear that their IQ advantage does not explain the wealth, power, influence, overrepresentation, etc. of the Jews. what does explain it?
Nisbett recognized this in his Intelligence and How to Get It.
“The average income difference between a person with an IQ score in the normal range (100) and someone in the top 2 percent of society (130) is currently between $6,000 and $18,500 a year.”
http://researchnews.osu.edu/archive/intlwlth.htm
” But this higher yearly income did not translate into higher wealth. In fact, people with slightly above average intelligence (105 IQ score) had an average net worth higher than those just a bit smarter (110 IQ).”
http://www.scientificamerican.com/article/wealth-of-smarts-does-not-guarantee-actual-wealth/
.
As I’ve explained, at that low level, net worth has a lot to do with spending habits.
okay the explain the average income gap between normies and top 2 percent as well?
Why believe that ALL mean will be perfectly Gaussian stylish?
Gaussian distributions are more statistically convenient, so when distributions are not Gaussian, it’s sometimes useful to transform the data into a Gaussian distribution
For what??
I am not claiming that the distribution pattern within this correlation is not linear and typical, but I think we should examine it more closely.
In all, we all know that earning more money is a sign of intelligence. But human intelligence is not just to make more money, have a doctorate or score high on IQ tests. The correlation between income and pure cognitive components exist as statistical and demographic property.
But in the real world, there are environmental factors that are decisive for the high income of a small minority.
It’s like when you initially fixed their gaze on a small part of a big picture of painting and then expands its focus to watching the rest.
In the world of entertainment, ”clevereness” (psychopathic abilities) and personal contacts is critical to success.
The academic world is the closest correlation between pure intellect and income that we may, without ”environmental pollution”. Still, it’s not a perfect correlation, whereas the intellect that promotes by ”education”, is only one in many other cognitive types of higher intelligence.
When you reduce the diversity and richness of the data distribution statistics found by a standardized distribution, you’re just throwing in the trash all this wealth.
Then it is assumed to be manipulating data to fit perfectly with the model you are proposing and not what was found.
I repeat, I am not claiming anything, but I think it’s very important to have stability and calm, because as I said before to you, the world is more complex and unfair than you think.
Their belief in the relationship, direct, causal and meritocratic between income and IQ, that you believe represent the entire intelligence is so great, I wonder if you will be able to earn your first million Canadian dollars to its 30 years of age.
And I’m not wearing any liberal rhetoric, tearful, to ”justice for blacks”.
This graph shows that verifiable super geniuses are only about twice as likely as a random individual to be in the top 5 percent for income. I remember you saying that you thought this only measured income as relative to the gifted subjects, but adding up the proportions in the quintiles is inconsistent with that.
And top 5 percent isn’t even rich…
Swanknasty we know from table 1 of this study that the MEDIAN highly gifted were making $80 K a year at age 33 circa 2002.
Click to access Kell-Lubinski-Benbow-20131.pdf
That;s equivalent to $106 K today which is around the 95 percentile for 33 year olds today. In other words, adjusted for inflation, 50% are above roughly the 95 percentile for their age, not 10%.
I realize that inflation adjustments can be misleading, but not THAT misleading. Everyone is misunderstanding that chart you post.
And if you average the four quartiles, the average percent in the top 5% is 5%. As I correctly inferred long ago, those percentiles are relative to other kids in the study, not the general population. the point was to show that the super gifted were richer than the mildly gifted, not to show that the gifted were richer than the general population (that’s a given)
How did you arrive to that conclusion? When I looked at the graph and added up the numbers, they came out > 5. Granted, that’s just looking at the graph so….
to me it looks like 3 percent, 6 percent, ~6.5 percent, and ~10 percent. multiply those percentages by 25 and .75 + 1.5 + 1.625 + 2.5 > 5 is what I got.
which to me indicates it’s not relative to just the other kids in the study
The quartiles likely vary in how man people…so you shouldn’t expect to get exactly 5
why not? it’s all expressed in percentages. regardless of how many individuals are in each quartile, the proportions of each quartile as a percentage should add up.
Swanknasty, averaging the percentages of each quartile only gives the percentage of the whole group if each quartile has the same number of people
For example lets say one quartile has 100% high income & the other three have 0%. The average of all four will be 25%.
But what if that quartile is only 5% of the sample? Then averaging overestimated the percentage of high income in the total sample five fold
Yeah but I thought the study just separated the population as was into quartiles. I don’t know why the populations would be different.
For sake of arg, assume 100 pop. Of that 100 we can just say 25 who did worst 25 best etc. and we will have arranged the pop into our quartiles.
And separately on income it would be the same.
It just seems like they would be equal pop for that reason. Is there any reason to assume otherwise here?
What I’m saying is that what you’re saying only seems to make sense if we’re talking about two different populations. But not if we are talking about the same underlying population
Well, even if all the quartiles have the same number of kids, your estimate for how many were in the 95 percentile of income was 3 percent, 6 percent, ~6.5 percent, and ~10. So on average 6% were in the top 5% of income. If your estimates were off by a smidgen or if they rounded a few numbers, 6% could easily be 5%. In other words, roughly 5% of the sample was in the top 5% of income. So either the gifted are no more prosperous than the general population OR those percentiles were with reference to only the gifted population; not the general population, which makes perfect sense since roughly 5% of the sample would be in the top 5% of their own distribution.
Also, the highly gifted were more likely to be in the top 5% than the mildly gifted, so extrapolating the correlation, why wouldn’t the entire gifted sample be more prosperous than normals? Unless you think the IQ income correlation only starts above IQ 128, it seems unlikely that those percentiles are in reference to the general population.
Further I cited you their actual median income which was way above the general population. If their median income was way higher than the general population, it makes no sense to believe so few of them earned more than 95% of the general population. Thus, all evidence points to that percentile being with reference to the gifted population, not the general population.
As I said above the most highly gifted were about twice as likely to be above 95th percentile as a random person, which is an increase but not a large one vs a normie.
And education is the primary reason the others wouldn’t be as prosperous…note the greater proportion of doctorates.
The chart doesn’t break down income percentile which explains how it may be consistent with your earlier figures when we take education into account. So I still disagree about the evidence being on your side
*income percentile by age
no, my guess is that a lot of these individuals have cashed in on their educations to receive positions with almost 0 advancement. The above chart doesn’t consider age group. So…my guess is that the young PhD does pretty well for himself at 30, but by 40 or so, his relative standing has fallen.
What I’m saying is that what you’re saying only seems to make sense if we’re talking about two different populations. But not if we are talking about the same underlying population
I am not a very frequent commentator on this blog, but your past couple of posts on IQ + wealth have been very low quality as evidenced by almost ever commentator disagreeing with you.
I have no need ro rehash old criticisms. The general consensus is that you can’t turn every function into a linear Gaussian one, But there is one major criticism that nobody has leveled.
The main reason why you can’t take median salary in the 1990’s of 50k and then inflate them to 85k or 100k today is because WAGES have not kept up with inflation. There are a million studies done on wage increases and inflation so there is no real need to post any charts or specific studies, it has become general knowledge that wages have not increased and that most of the inflation gains have been piling up to the 1%.
A better way to look at this is typical starting salaries for professions
A starting salary for a engineer would be 30k in the 1990’s and that is with absolutely no experience! Mid career engineer would be around 50k
But in 2014 new engineering grads are fighting tooth and nail for each other for 50k-60k positions in addition to having 1-2 years of experience being interns
Even worse hit are the masters and PHD’s
The median salary of a masters was 50k in 1990
And the median income of a masters in 2014 is 60k!
By your logic the median masters should be inflated to 100k
Median household income in 1990 was 46k! while in 2010 it was 50k!
This means that the super geniuses making 50k didn’t make much more than the average joe shmoe and if “time adjusted” on the assumption that they made that 50k on salary alone they would only be making 60k today.
So these high scoring SAT kids made around as much as a mid level engineer.
The average engineer is only around 120 IQ so that extra 30 IQ points doesn’t seem to have made any difference whatsoever!
————————————————
Throwing in some annecdotal evidence into the mix, the most intelligent people seem to go into getting a PHD in Engineering/math/Physics but these positions are know for awful pay and crippling debt with all the adjunct bullshit and putting in far more than 40 hours a week, these people are not driving around in luxury vehicles (vehicles over 40k+) they are driving around 10 year old honda civics (unless the science PHD had wealthy parents)
It is not true that every commentator disagrees with him. There is one guy who changes his nick many times and comments with many different names so many times…
Why should an average american earn the same money as an average Ivy league graduate?
if you go by a supply and demand model, then if that average american has a rarer quality than the ivy league graduate, he should make more money.
>Why should an average american earn the same money as an average Ivy league graduate?
Where did I make this claim?
The bottom line is that evidence shows that someone making 50k in a particular profession is probably only making 60-70k now in the same profession.
There’s no evidence that a 150iq person making 50k in the 1990s would be able to make an inflated 100k+
True, not everyone disagrees. This post practically went viral on twitter
But a lot of people disagree strongly. IQ & money is an extremely polarizing topic
that’s a fair point too. my only question then is wouldn’t this trend affect all the wage levels? so even though we may have to adjust some of the high numbers downward, we’d also have to adjust some of the lower numbers downward as well.
@swanknasty
No it wouldn’t since all salaries have not kept up with inflation except for the top percent of salaries in upper management.
The rest of the income gains come from assets.
And from the 50k average salary of these super geniuses in 1990 they never achieved anything other than making as much as middling corporate drones
…………………
Furthering my rant I don’t understand why pp continues to push this crap theory despite widespread knowledge that everybody knows that
it is who you know rather than what you know.
Meritocracy in the USA has been disbunked by a million studies. But pp still clings to that .4 correlation and ignoring how once both individuals have the same degree the correlation is no longer. 4 as in if you take only college grads in your sample and then doing iq vs income the correlation would be different than if you took both dropouts and college grads. Do work in any private company and it is instantly clear that the easiest way to become a employee is to know the hiring manager while in the fiction the meritocracy is based on flawed idiocy where they auto take the candidate with the most points so they would take a vet with a 4.0 from state u over some mit grad with a 3.0 because the system gives points to candidates based on GPA. So government agencies become filled with dumbass veterans graduating with 4.0s from community college, private industries filled with some people who get in by merit and some through nepotism.
Iq and salary correlation definitely exists but due to hiring idiocy it is nowhere as strong as Steve hsu and pp imply.
sorry…when i say ‘all’ wage levels I just mean wage levels < ~100k
i typically don't think of compensation past that (i.e. what managers et al receive) as a 'wage,' but that's just my own paradigm speaking.
re: meritocracy, I'm unsure. IQ isn't the only measure of worth. It's useful to have some, but it alone really is not that big a deal. Extraversion, risk-taking, etc. are all other very valuable qualities.
So I think meritocracy is still alive….you just have to wonder…the merit of what, exactly?
Meritocracy in the USA has been disbunked by a million studies. But pp still clings to that .4 correlation and ignoring how once both individuals have the same degree the correlation is no longer. 4 as in if you take only college grads in your sample and then doing iq vs income the correlation would be different than if you took both dropouts and college grads
All IQ correlations diminish when you look only at samples that have a restricted range of IQ.
>All IQ correlations diminish when you look only at samples that have a restricted range of IQ.
——————-
di·min·ish
dəˈminiSH/
verb
make or become less.
———————
This is statement is completely wrong since you are implying that the minute you remove datapoints of a certain range the correlation between X and Y always decreases!
Your critics are right when they say you don’t have a good understanding of mathematics.
Correlations merely measure the average distance between datapoints with the line of best fit so changing the range can increase or decrease the correlation it does not diminish at all.
In fact if you did the opposite of what I suggested
If you did IQ vs income for NO COLLEGE Diploma you would probably find a HIGHER correlation compared to the lower correlation if you did IQ vs income for college grads only.
Why?
Because simple observation shows that “smart people” who failed to get a college degree can easily get a cushy government job by acing civil service exams, get certifications, someone with a 110 IQ working at a Mcdonalds would quickly get promoted to a shift manager because he seems to be a genius compared to the other 85 IQ employees.
—>A clear pattern emerges that amongst people with no degrees intelligence does correlate strongly with income.
While for College grads, you have the government deliberately hiring idiots taking preference for vets + GPA without caring about where you got your degree from. You have rampant nepotism because most employees with liberal arts degrees are interchangable and being a genius won’t result in productivity gains. (A 150 IQ secretary probably would do the job as well as a 110 iQ one), for most jobs being smarter doesn’t result in productivity gains.
—>A clear pattern emerges that amongst people with college degrees the correlation is extremely weak.
Given that the correlation when both these groups taken together is .4
The correlation for no college degrees would most likely by >.4
While the correlation for college degrees would most likely be <.4 since the two groups combined have to be .4
Suddenly since the super genius group is almost all in the college degree group you are looking at a tiny correlation that would get thrown out by real scientists
This is statement is completely wrong since you are implying that the minute you remove datapoints of a certain range the correlation between X and Y always decreases!
Your critics are right when they say you don’t have a good understanding of mathematics.
No, my fans are right when they say I have an excellent understanding of mathematics; excellent enough to have heard of a little concept called restriction of range, and the need to correct for it:
http://pareonline.net/getvn.asp?v=14&n=5
But you do make a valid point when you say that in some cases correlations can actually increase when the range is restricted, but I’m not sure if that would happen if you looked only at non-college samples.
On pg 568 of The g Factor Jensen writes,:
Also, the IQ-income correlation itself increases at higher levels of education; the lower the level of education, the weaker is the relation of income to IQ
>No, my fans are right when they say I have an excellent understanding of mathematics
A completely irrelevant paper since it only describes methods to predict on samples that you have missed out on, nowhere does it support your claim that range restriction always decreases correlation.
You made a retarded statement and I called you out on it.
—————————————————————————————————————————-
>Also, the IQ-income correlation itself increases at higher levels of education; the lower the level of education, the weaker is the relation of income to IQ
Education = IQ now?
I claimed that most likely IQ at higher levels doesn’t correlate very strongly with high incomes, I never denied the Education correlation with IQ.
http://en.wikipedia.org/wiki/Moving_the_goalposts
How education relates to employment is that certain jobs require certain degrees and pay certain salaries. But the question is whether or not someone with a 150 IQ with say a Bachelors in English would make more than someone with a 120 IQ in English and would the correlation be strong enough to be considered significant.
From looking at the study that you based your argument on (the precocious youths that are all clearly 150+ IQ) this does not appear to be the case based on the $80k income in 2002. While 80k is a lot of money its not that much when you consider that the average college graduate with 110 IQ is pulling in 60k-70k with 12 years of experience.
You also need to separate MALE and FEMALE PAY, since most of the candidates in the precocious youth study are MALE
More experience does equal higher pay but for most careers salary stops growing
http://www.payscale.com/career-news/2011/03/pay-goes-nowhere-after-40
Chart here (Chart is 2010)

Throw in the fact that wages didn’t really increase and that 80k in 2002 is not very impressive compared to the median white/asian college grad with 13 years of experience.
And yes marketing majors with psychology degrees from crappy universities 110 IQ’s working as a marketing manager makes 120k median salary
https://www.google.com/#safe=off&q=marketing+manager+salary
A completely irrelevant paper since it only describes methods to predict on samples that you have missed out on, nowhere does it support your claim that range restriction always decreases correlation.
The point is the paper contains a formula for correcting for range restriction. So for example,if you took a bunch of people with a BA in English (to use your example) and found that their IQs only correlated 0.1 with income, you could correct the correlation for range restriction by noting the IQ SD of the English majors was only 10 (a restricted sample). The formula would tell you how high the correlation would be if the SD was 15 as it is in the general population. In other words, we want to know whether the IQ-income correlation is smaller among college grads because IQ actually matters less to income among this group, or if the correlation is less only because there’s less IQ variability for income to correlate with.
Education = IQ now?
I claimed that most likely IQ at higher levels doesn’t correlate very strongly with high incomes, I never denied the Education correlation with IQ.
You claimed that the IQ-income correlation is lower for college grads than for non-college grads. Jensen claims the opposite: the correlation is stronger the more educated you are.
However it’s possible Jensen is wrong as a lot of people on the internet would agree more with your claim.
But the question is whether or not someone with a 150 IQ with say a Bachelors in English would make more than someone with a 120 IQ in English and would the correlation be strong enough to be considered significant.
I agree that if you controlled exactly for education (exact same degree from the exact same university earned the exact same year) that the income difference between and IQ 150 and an IQ 120 would be a lot smaller. But when people with different IQs are matched in education, the dumber person probably has (1) greater conscientiousness and (2) higher SES parents, so the decreased correlation could be spurious.
Godslayer,
Good point about wages not keeping up with inflation but adjusting for inflation was the only way I could compare all seven IQ levels (since some data from 1993, other circa 2002) & estimate their respective percentiles
Think of it as just a very rough preliminary analysis; better method would be to determine their percentile rank for the actual year but that would take a lot of research
@swanknasty
No it wouldn’t since all salaries have not kept up with inflation except for the top percent of salaries in upper management.
The rest of the income gains come from assets.
And from the 50k average salary of these super geniuses in 1990 they never achieved anything other than making as much as middling corporate drones
…………………
Furthering my rant I don’t understand why pp continues to push this crap theory despite widespread knowledge that everybody knows that
it is who you know rather than what you know.
Meritocracy in the USA has been disbunked by a million studies. But pp still clings to that .4 correlation and ignoring how once both individuals have the same degree the correlation is no longer. 4 as in if you take only college grads in your sample and then doing iq vs income the correlation would be different than if you took both dropouts and college grads. Do work in any private company and it is instantly clear that the easiest way to become a employee is to know the hiring manager while in the fiction the meritocracy is based on flawed idiocy where they auto take the candidate with the most points so they would take a vet with a 4.0 from state u over some mit grad with a 3.0 because the system gives points to candidates based on GPA. So government agencies become filled with dumbass veterans graduating with 4.0s from community college, private industries filled with some people who get in by merit and some through nepotism.
Iq and salary correlation definitely exists but due to hiring idiocy it is nowhere as strong as Steve hsu and pp imply.
‘No it wouldn’t since all salaries have not kept up with inflation except for the top percent of salaries in upper management.’
As I stated earlier, < 100k salaries are the primary salaries that this phenomenon would affect. And nearly all of the salaries in the sample were in this range…thus, why would these relative rankings really change much?
No they wouldn’t
I wasn’t able to view many pages because I was on my phone before
But the 150+ IQ study shows that the median cohort made 80k at age 33 so roughly 12 years of experience.
https://pumpkinperson.com/2014/11/08/income-above-150-iq/
>So let’s adjust for inflation. $80,000 circa 2002 is like $106,000 today. In other words, adjusted for inflation, the median of this highly gifted group was more successful than 95% of American 33-year-olds today.
Making 80k per year wouldn’t put you in upper management level at all, If you were a software developer with 12 years of experience working
http://monster.salary.com/salarywizard/Software-Engineer-V-Job-Description.aspx
Requires a bachelor’s degree in area of specialty and at least 8-10 years of experience in the field or in a related area
http://monster.salary.com/SalaryWizard/Software-Engineer-V-Salary-Details.aspx
The average salary is 122k
Throw in the fact that wage growth HASN’T followed inflation for non management these super geniuses would probably have a 85k-90k median salary. Software engineer salaries have NOT kept up with inflation the way finance and upper management salaries have.
The floor for programmer is around 115 IQ so that extra 35 IQ points over the competition are not helping.
http://finance.yahoo.com/news/alibabas-jack-ma-being-richest-great-pain-112335446.html
“Yeah, it is good, but not the richest man in China. It’s a great pain because when you’re (the) richest person in the world, everybody (is) surrounding you for money,” Ma told CNBC.
Remember I told you about my cousin becoming wealthy? Once you become super-rich, you have to behave like those self-actualized people or top out of sight type; A heaven for introvert, hell for extravert.
Thus intravert is default personality for super-rich or TOOPS.
Extrovert is default personality of poor. Most people are in between.
Pingback: Are IQ and income correlated amonge people with identical degrees? | Pumpkin Person
Pingback: Does the average self-made decabillionaire have an IQ of 150? | Pumpkin Person
Pumpkin,
Are you a statistics major or graduate? Because I think your use of statistics is incorrect. I have to add a disclaimer since I took statistics 15 years ago so I might be wrong. (You also don’t label your x and y axis which adds to the confusion.) But, your methodology looks wrong.
You can’t just calculate the median income at each IQ point and then just plot it and say there is a strong linear relationship. That’s not correlation. If there is any correlation besides 0, there is always going to be a linear line when you plot the means. Correlation indicates how close the data points cluster to the line so you need to provide a graph that includes all the data points.
By just using the median, you are actually eliminating the distribution so of course, you’re going to get a clear line!
Are you a statistics major or graduate?
No.
You can’t just calculate the median income at each IQ point and then just plot it and say there is a strong linear relationship.
Yes you can
That’s not correlation.
Of course it is
If there is any correlation besides 0, there is always going to be a linear line when you plot the means
Not if, as many claim, the correlation stops above IQ 120. If that were the case, the median incomes would stop increasing above 120. It doesn’t which is the point of the post
Correlation indicates how close the data points cluster to the line so you need to provide a graph that includes all the data points.
No. It’s understood that the steeper the slope of the line, the more closely the data points cluster around it. Indeed when both X and Y are expressed in equal units (normslized Z scores), the slope of the line equals the correlation
> You can’t just calculate the median income at each IQ point and then just plot it and say there is a strong linear relationship.
> Yes you can
I don’t think so. You can say that there is a linear relationship but you can’t tell the strength of that relationship. By just plotting the mean, you are eliminating the volatility of the data. There could have been extreme deviation at each mean point but you just got rid of it by just plotting the mean.
> Not if, as many claim, the correlation stops above IQ 120. If that were the case, the median incomes would stop increasing above 120. It doesn’t which is the point of the post
If the correlation decreases after 120, that just means that data points spread out from the mean instead of staying within its restricted correlation range. It definitely doesn’t mean the slope changes.
> It’s understood that the steeper the slope of the line, the more closely the data points cluster around it. Indeed when both X and Y are expressed in equal units (normslized Z scores), the slope of the line equals the correlation.
Uh…I might be wrong but that doesn’t sound right. The slope of the line equals the correlation when you convert the plots into Z SCORES which doesn’t mean you make them equal units but you convert them into units of how far they are away from the mean. So slope becomes related to correlation because you’re now converting the slope data into variance data which is the same type of data that correlation is.
Were you multiplying the correlation with the change in X to predict expected value in your other blogs?
I don’t think so. You can say that there is a linear relationship but you can’t tell the strength of that relationship. By just plotting the mean, you are eliminating the volatility of the data. There could have been extreme deviation at each mean point but you just got rid of it by just plotting the mean.
When the two variables are normalized to the same distribution (see last graph), then the more the mean value of Y increases at different levels of X, the less deviation there is from the mean of Y at a given value of X. The deviation from the mean is directly predictable from the increase in mean. When normalized standard scores are used, you can’t have a precipitous increase in means without also having very limited deviation from said means, because in order for the mean Y to increase precipitously, almost all the low X values must be paired with low Y values, and almost all the high X values must be paired with high Y values. If you have massively deviant levels of Y at every level of X, then the high and low Ys just cancel each other out, and the line of means becomes relatively flat, signaling low or no correlation.
Thus, knowing the increase in means is strong is enough to infer strong correlation You don’t need to see the deviation from said means. It can be directly inferred.
If the correlation decreases after 120, that just means that data points spread out from the mean instead of staying within its restricted correlation range. It definitely doesn’t mean the slope changes.
No. When normalized data points spread out, slopes become smaller. Slope = Rise/Run and when there are just as many data points that sink as rise, the slope itself can’t rise, given that the distributions are standardized and normalized and thus there’s a limit on how high, the highest values of Y can rise..
.
Uh…I might be wrong but that doesn’t sound right. The slope of the line equals the correlation when you convert the plots into Z SCORES which doesn’t mean you make them equal units but you convert them into units of how far they are away from the mean.
By equal units I mean convert to the same scale
So slope becomes related to correlation because you’re now converting the slope data into variance data which is the same type of data that correlation is.
Were you multiplying the correlation with the change in X to predict expected value in your other blogs?
Yes
> Thus, knowing the increase in means is strong is enough to infer strong correlation You don’t need to see the deviation from said means. It can be directly inferred.
Here is a simply example where that doesn’t work. What if the scatter plots were everywhere but the resulting graph of just the means was a straight line? If the scatter plots were everywhere, that means the correlation was low. But, according to you, as long as the means were linear, then strong correlation can be inferred.
You need to plot all the data and see how the plots look as you increase IQ. It’s simple to do. Not sure why you would just use the means. Looks like pseudo statistics to me.
> No. When normalized data points spread out, slopes become smaller.
When the data points spread out at the tail end from the regression line, correlation breaks down. You need to graph it. Or calculate the correlation for the subgroups.
Here is a simply example where that doesn’t work. What if the scatter plots were everywhere but the resulting graph of just the means was a straight line? If the scatter plots were everywhere, that means the correlation was low. But, according to you, as long as the means were linear, then strong correlation can be inferred.
Huh? I said the correlation could be inferred from the slope of the line (when both variables are normalized on to the same scale), not its straightness, although the straightness implies the same trend continues indefinitely.
You need to plot all the data and see how the plots look as you increase IQ. It’s simple to do. Not sure why you would just use the means.
I don’t have all the data to plot. All I have are the means. And I just explained to you multiple times that the means are sufficient to show a correlation, but don’t take my word for it; I’m just some blogger with no formal math credentials. Experiment with some data on your own (doesn’t have to be related to IQ and income, you can use some other topic), and see for yourself if I’m right. Someone great once said, we only truly believe what we discover for ourselves. And that’s especially true when we don’t want to believe it.
HardToBeObjective, can you tell me a single example where the average level of Y consistently increases as X increases, yet X & Y are not positively correlated?
Think about it.
Pumpkin: I know you could infer and my point was that you can’t. I wasn’t asking for an explanation. And, I gave you an example of when your statement doesn’t hold true.
Movie: I never said that they weren’t positively correlated. I said that the correlation is low and I actually gave an example of it. he’s insisting that if the means are a straight line, then the correlation is near 1.
Pumpkin: I know you could infer and my point was that you can’t. I wasn’t asking for an explanation.
I gave you a very elaborate explanation. You clearly did not read it carefully enough.
Movie: I never said that they weren’t positively correlated. I said that the correlation is low and I actually gave an example of it. he’s insisting that if the means are a straight line, then the correlation is near 1.
Again, you’re not reading carefully enough. I never said the correlation was anywhere near perfect. What I said was that when x and y are both expressed on the same normalized scale (see the last chart in the post) then the slope of the line of best fit, equals the correlation.
Anyone who has passed grade nine math should know that the slope of the line and the straightness of the line are two very different things. A line can have a slope of 0 and still be perfectly straight. The point of the post is not that the correlation between IQ and money is especially high (steep slope), but that the slope is significantly positive and doesn’t appear to diminish within the range of available data.
Now it’s possible that if we had IQ data extending well beyond 150, or if we had better data (adult scores on official IQ tests instead of adolescent scores on proxy IQ tests), we would see the straight line start to bend or even reverse direction, but there’s no evidence of that in this data-set.
.
Pingback: Is Capitalism the only Reason to Care about Intelligence? (pt 3) | evolutionistx
Pingback: Inheritable Intelligence | THE GOYSPLANATION
I scored 170 on an IQ WAIS test getting every question right and am on disability check, and was on disability check while being assessed prior on a non IQ test to assess whether I had disability on paper, while the actual test was a labeled WAIS available for a limited time online, in which I received a score lower than perfect because of timing, despite finishing 35 minutes early. Racists have a lower IQ.
And mine was the IQ test that only goes up to 140, so my score was 132. I don’t boast, sexists have a lower IQ and many people have higher IQ scores roughly daily though I actually took a test.
This seems strange to me. My I Q is 129 on a bad day. My income has never been more than 30k. IF your conclusions are correct or even close, I can only assume that the environment I was raised in caused of my low income. Religiously intolerant schools and neighbors (The MORMONS), a physically abusive mother, and a society that was accepting of male saying anything bad about a woman especially a mother (could not report the abuse with out more abuse by the MORMONS).
Anecdote: My high school had very high standard for entry, and classes had very high average IQ. Our class of 20 people had 6 of the top 20 finishers in 33000 participant national mathematical competition, in which most people in our age group participated plus many other top 100 finishers, bunch of programming and chess enthusiasts and such. When we had our latest class reunion way more than half of the people were entrepreneurs, had important roles in startup businesses, were individual income earners (like me, being professional poker player) or were doing something non-ordinary in a corporation or research project. One of the 20 is decamillionaire, at least one other is millionaire and many had already had opportunities to earn millions so while some had perhaps more luck others have also not gotten lucky in right spots. Also at least 2 people have studied to be medical doctors, but neither of them does that for a living even though it is one of the highest paid normal work where I live. I don’t have any formal education finished, but I have found many ways of making at least to top 10th percentile income where I live, I am way above average at handling money and it seems almost inevitable to get wealthy. The ways gifted people get to better income are not as limited as it seems to normal people since most gifted people are not bound to normal jobs, which would be predictable by their formal education.
Pingback: America the Intellectual Capital of the World, or Why Smart People Deserve More | greyenlightenment.com