From 1981 to 1991, the LSAT was scored on a scale where 10 was the lowest possible score, and 48 was the highest. In the below chart, we see how various scores equated to percentile rank among those who took the LSAT (an elite sample):
| LSAT score | percentile among elite sample who takes the LSAT | Source | Z score assuming LSAT takers form a Gaussian distribution |
| 32 | 51 | year unspecified, note 79, Rothstein & Yoon 2008 | 0 |
| 35 | 65 | Circa 1990 distribution | +0.4 |
| 38 | 79 | 1990- 1991 distribution; note 53 Rothstein & Yoon 2008 | +0.8 |
| 41 | 89 | 1990-1991 distribution; note 53 Rothstein & Yoon 2008 | +1.2 |
| 41 | 90 | 1990-1991 distribution note 71 Rothstein & Yoon 2008 | +1.27 |
| 42 | 94 | 1987 to 1988 distribution | +1.53 |
| 45 | 98 | 1987 to 1988 distribution | +2.07 |
From the above data, our best estimate is LSAT takers had a mean score of 32.6 with an SD of 6.3.
In this article I once again try to convert these scores to IQ but this time using equipercentile equating, a technique in which I will map LSAT scores to IQ by equating both distributions in a sample that took both tests.
I am aware of only nine people with both reported LSAT scores on this scale, and reported scores on tests that can be converted to IQ. Some of these are from famous people (Barack Obama, Eliot Spitzer, Lion of the Blogospher) but most are from the Omni magazine sample used to norm Ron Hoeflin’s Mega Test, though only when there was no score from a more established test (SAT/GRE) with which which to pair the LSAT score, did I use the Mega Test score
| Person | LSAT score | Score on another test | IQ equivalent of other test (U.S. norms, sigma 15) | Source |
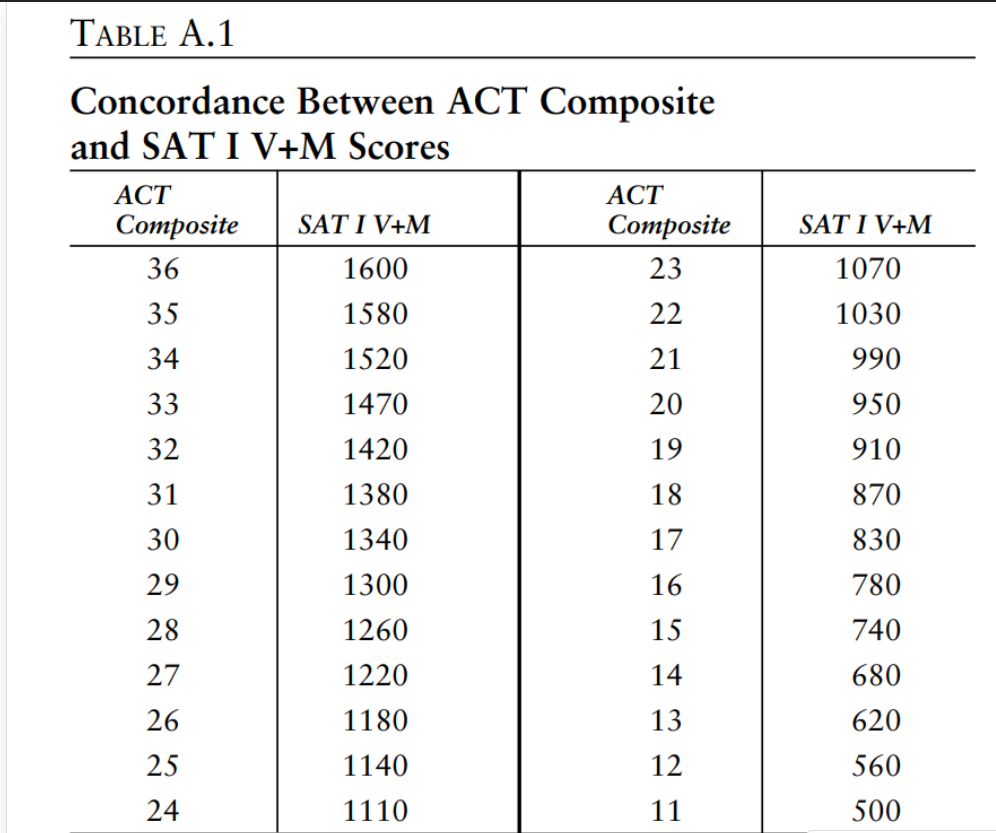
| Eliot Spitzer | 48 | 1590 on Old SAT | 170 | wikipedia (2024-09-24) |
| Lion of the Blogosphere | 46 | 1410 on Old SAT | 143 | Discussion on X.com (2024-06-02) |
| Barack Obama | 43.5 (42 to 45) | 128 on WISC (Wechsler Intelligence Scale for Children) | 124 after adjustment for suspected Flynn effect | Source for LSAT score Source for WISC score |
| Mega Test taker | 43 | 1400 old GRE | 141 | Omni sample |
| Mega Test taker | 42 | 1540 old SAT | 157 | Omni sample |
| Mega Test taker | 42 | 1360 old SAT | 139 | Omni sample |
| Mega Test taker | 41 | 1370 old SAT | 140 | Omni sample |
| Mega Test taker | 34 | 1290 old SAT | 139 | Omni sample |
| Mega Test taker | 34 | 6 on the Mega Test | 125 | Omni sample |
For these nine individuals, the correlation between the LSAT and another IQ test they took was about 0.53. Their average LSAT score is 41.5 (SD = 4.5) and their average IQ is 142 (SD = 13).
Thus the formula for converting LSATs from this era to IQ (U.S. norms):
IQ = [(LSAT – 41.5)/4.5](13) + 142
Recall from above that the mean LSAT scores of LSAT takers was 32.6 (SD = 6.3). Thus on a scale where Americans on the whole have an average IQ of 100 (SD = 15), the law school bound elite had averaged IQ 116 (SD 18.9). An average IQ of 116 sounds plausible given that this was just over the mean for college grads in the 1980s but the SD of 18.9 is surprisingly high and may be an artifact of some kind.