In psychology there is a long tradition of separating intelligence (cognitive abilities) from physical abilities and personality. But what exactly is the difference?
Jensen might have claimed that the difference between an IP (item performance) showing ability (physical or mental) vs one showing personality, is the former requires a standard of proficiency. From The g Factor, page 51.
If what DeYoung is saying is true, how then do we distinguish between personality and cognition, if both can be measured using mental tests using an objective standard of proficiency?
After thinking about it for a while, I’ve decided that what distinguishes a cognitive test from a personality test or even a physical test, is that a cognitive test requires you to correctly answer questions using only your fine motor abilities (i.e. talking, writing, manipulating small objects with your hand) or some equivalent. All cognitive tests, whether verbal or performance, require you to answer questions correctly, whether by defining common words, showing how two jig-saw puzzle pieces fit together with your hands, or telling the examiner from memory what number sequence she just read.
Athletic tests also require you to give the right answer to questions (show me how how to dance) but unlike cognitive tests, you answer using gross-motor abilities instead of fine motor abilities. Personality tests, like IQ tests, require you to answer questions using only fine-motor skills like speech or writing (would you rather go to a party or read a book?) but unlike cognitive tests, those questions have no right answer.
At the time I wrote that I had no idea Musk had taken the SAT (since it’s not required in Canada) but it turns out he did as revealed by the Walter Isaacson biography released this month:
If all American 17-year-olds had taken the SAT in the 1980s, it would have had an estimated a mean and standard deviation of 787 and 220 respectively, so Musk’s combined score of 1400 equated to +2.79 SD or IQ 142 (U.S. norms) or about 140 if you like round numbers.
140 makes sense. Smart enough to launch rockets and become the World’s richest man, but still dumb enough to get fleeced out of tens of billions of dollars when buying twitter.
Even though it’s generally a bad idea to try to guess someone’s IQ from their wealth alone, in Elon’s case it made perfect sense because my intuition told me he was smarter than half the Americans who reached his level of wealth (i.e. Sam Walton) but dumber than the other half (i.e. Bill Gates).
Commenter RR cited a paper by Richardson and Norgate (2015) arguing that IQ is not as predictive of job performance as once thought. In table 1 (see below) they summarize the research, showing newer studies find much lower predictive coefficients than older studies. They list both the corrected and uncorrected correlations between IQ (or some close proxy there of) and job performance. These correlations have to be corrected for range restriction because jobs sort people so efficiently by IQ that within a given job, IQ differences are too small to predict much. In addition, measures of job performance can be unreliable because one year you can make $1000 in commission and the next year you make $10,000 in commission, so correcting for good and bad luck can make the correlation more meaningful.
Now looking at the five older meta-analyses, the mean corrected correlation is about 0.5. The mean correlation correlation of the five newer meta-analyses is 0.2. No idea why there’s such a huge discrepancy between the old and new studies. Perhaps it could be that in an era of wokeness and snowflake culture, job performance is more about participation than about actually doing a good job, thus lowering its correlation with IQ. Or perhaps researchers have become more aware of the file drawer effect, and journals are demanding studies be pre-registered to avoid selective publication of only high correlations. Or maybe wokeness has caused a bias in favor of publishing low correlations.
I decided to look at studies that approached the question from a different angle. Instead of just calculating the corrected correlation between IQ and job performance among regular employees, one study asked what happens when a bunch of brilliant people are hired to do a job normally performed by average people.
Smart cops
From the book A Question of Intelligence by Daniel Seligman (a great read for anyone new to the IQ debate):
We begin with a cautionary tale from the files of New York City’s police department. The time is April 1939. The long depression is still very much in place, and good jobs are hard to get. Any jobs are hard to get. So there is a huge turnout when the department announces civil service exams that will result in the hiring of several hundred policemen. More than 29,000 men take the written exam, which is essentially just an intelligence test.
By normal police standards, a sizable number of the testees are absurdly “overqualified.” In the circumstances, the NYPD set its standards high. It announced that the physical exam for cops would be administered only to the top 3,700 scorers on the written test. After the physical tests, there was more winnowing: It resulted in a new list of the top 1,400 prospects (whose rankings reflected a 70 percent weighting for written scores and 30 percent for physical scores). Going down this list, the department next offered patrolmen’s jobs to 350 or so of the top candidates. In the end, 300 of them—roughly 1 per¬ cent of those who had been competing for the jobs—ended up in the class of 1940.
The 300 were plainly smart cops. If you assume that the initial 29,000 test takers were roughly representative of the country’s overall IQ distribution, then you could estimate that the average IQ of the 300 was something like 130.
Fifty years later, a group of Harvard psychologists— Prof. Richard J. Herrnstein and two graduate students, Terry Belke and James Taylor—went back to the NYPD records to see what had become of the brainy class of 1940. Questionnaires were sent to the 192 men then still alive, and more than three-quarters of them responded. Analysis of the survey data demonstrate yet again that high-IQ people do well in the world. The group had on average stayed with the police department for 24.7 years and rose high in the ranks: 43 percent reached the rank of lieutenant or captain, and 18 percent became inspectors of one kind or another. The class of 1940 also produced one police commissioner, four police chiefs, four deputy commissioners, one chief inspector, two chiefs of personnel, one director of the city’s Waterfront Commission, one chief assistant district attorney, one director of the New York State Identification and Intelligence System, and one director of the New York Regional Office of the Law Enforcement Assistance Administration.
At first I was really excited about this study but then I remembered that the NYPD is a huge testocracy, so of course people who did well on written tests got promoted, since you have to take another one every time you apply for promotion(at least below the captain level). Did Hernstein not know this, or was he hoping we wouldn’t know or was it less of a testocracy in the 1940s? I doubt it since that was the peak testing era.
Now it’s very likely these smart cops still would have done well even if tests were not used to promote them since life itself is an IQ test, but I’m pretty sure they were so this promotion rates are uninformative. It would be like hiring 300 black cops and then claiming many got promoted because melanin enhances productivity, without telling your readers there was an affirmative action policy to promote black cops. That study would never have past muster with Hernstein or Seligman so they should have applied their same skepticism here, though in fairness, I can’t find Hernstein’s original paper so maybe he had a rebuttal or maybe the study included other less circular data .
Project 100,000
Perhaps the single biggest experiment ever done on IQ and job performance was Project 100,000. Normally the U.S. military avoids recruiting anyone with AFQT score below the 30th percentile (IQ 92; U.S. norms) and is prohibited from recruiting anyone below the 10th percentile (IQ 81; U.S. norms) however the need for more men during the Vietnam war combined with President Johnson’s desire to lift the poor into the middle class resulted in over 300,000 New Standard Men (IQ 82 to 92) being recruited from October 1966 to December 1971.
Sadly, the New Standard Men (NSM) died in war at three times the rate of the regular recruits. Of the NSM entering basic training, 41.6% remained after 23 months vs 68.8% of regular recruits (see figure below from Gottfredson, 2005). By subtracting these numbers from 100%, we see that just keeping your job put you at only the 31.2 percentile for normal recruits, but it put you at the 58.4 percentile for NSM.
On the bell curve, the difference between these two percentiles is 0.66 standard deviations, suggesting that the job performance curve of the NSM was 0.66 SD to the left of regular recruits. Now assuming the regular recruits average IQ 108 (the approximate average IQ of Americans above IQ 92) and the NSM average IQ 88 (the approximate average IQ of Americans ranging from IQ 81 to 92), the IQ gap between them is 1.33 SD (20 IQ points).
This suggests that if all American young men had been recruited by the army, the line of best fit on a scatter plot predicting normalized productivity from normalized AFQT scores would have a slope of 0.66/1.33 = 0.50. Assuming a bivariate normal distribution, the slope of the standardized regression line equals the correlation.
And note 0.5 might even be an underestimate because the denominator is likely too high and the numerator is likely too low. The true IQ gap is slightly less than 20 points because (1) some NSM likely faked their low scores to try to evade military service making the true average IQ of NSM likely higher than 88, and (2) the true IQ of the regular recruits was likely lower than 108 because it did not include the disproportionately high IQ men who got academic deferments or had powerful parents pulling strings. There also would have been considerable pressure on the military to make the NSM succeed, thus deflating the numerator.
But taking the numbers at face value, and assuming the military is representative of U.S. jobs, at least as recently as the 1960s, the correlation between IQ and job performance was 0.5, consistent with the older studies in table 1. The fact that my novel and indirect calculations confirm the traditional calculations bodes well. When wildly different approaches using massive datasets converge on the same result, you know you’re on the right path.
Few mental tests have been more popular among psychometricians than Comprehension. They are part of the Binet scale, the Army Alpha, and of course the Wechsler series. One thing I like about them, is they are fairly g loaded (0.68 in one quality study) without being as loaded on culture or education as the Information and Vocabulary subtests. Like these subtests, it measures the ability to acquire verbal knowledge, but unlike them it can be easily translated into different languages for cross-cultural comparisons without losing much relevance.
The test is good at spotting high IQ people who lack common sense. I once knew a British woman who was utterly brilliant in her verbal and mathematical skills, yet somehow couldn’t hold a job. Despite her being a hyper-educated adult I had her take the Wechsler children’s intelligence scale which she found super easy (the only adult I ever knew to get the hardest vocabulary question on that test) except for the spatial subtests and Comprehension (where she revealed a tendency towards boorish behavior).
The test seems especially good at picking out people with bad judgement. I have noticed that regardless of overall IQ or g, those who make low scores tend to be the people who are wrong about everything. Whether it’s falling for absurd conspiracy theories, thinking the Earth is flat or simply denying HBD, people with bad judgement tend to make low scores, even when they are otherwise brilliant. For this reason I call it a test of wisdom.
And yet for all the rich clinical data the test provides, it is also among the most criticized. One famous Comprehension item asked “What should you do if you’re sent to the store to buy some bread and the store owner tells you there is no bread left?”
This is an absolutely beautiful item, but critics scoffed that the correct answer (go to another store) was unfair to kids in the ghetto and rural areas because there is often not another store within miles. Of course my own sister failed by answering “I would buy something else” and we grew up in the suburbs so no excuse. But my sharp as a tac mother and no-nonsense father both passed with ease.
The great David Wechsler was very protective of his Comprehension items, especially the ones he grew emotionally attached to. When told by his team that he had to drop the question “Why are women and children saved first during ship wreck?” from the Wechsler Intelligence Scale for Children (WISC) he allegedly screamed “Chivalry may be dying. Chivalry may be dead. BUT IT WILL NOT DIE ON THE WISC!!!!!!!!!!!!!!!!!!!“
After he died in 1981, psychologists had a field day purging such classics from his scale and replacing them with new items. In fairness, some of the items Wechsler had grown emotionally attached to may not have met modern statistical criteria for a valid reliable question. Comprehension was eventually relegated to an alternate subtest.
The Comprehension subtest on the PAIS differs from the type on the Wechsler and early Binet in that it’s multiple choice (except for the bonus questions which I have yet to norm). In this way it resembles the WWI Comprehension subtest. The advantage of this is it can be scored by computer and is much less prone to human error than the highly subjective scoring on the Wechsler. The disadvantage is it doesn’t require as much creativity and executive functioning when you only need to select the answer rather than thinking of it yourself, but it still requires the insight and judgement to know why some answers are better than others.
At least nine readers who took the PAIS Comprehension subtest also reported their SATs/verbal SATs/ACTs. The IQ equivalents of their self-reported college boards had a mean of 121 and an SD of 15 (U.S. norms). Their mean score on the 12 item Comprehension test was 7.6 (SD = 1.17).
Assuming a linear relationship between both tests and similar g loadings, we can make some crude IQ equivalences:
Comprehension score (out of 12):
12 = IQ 177 (U.S. norms)
11 = IQ 164
10 = IQ 152
9 = IQ 139
8 = IQ 126
7 = IQ 113
6 = IQ 101
5 = IQ 88
4 = IQ 75
3 = IQ 62
2 = IQ 50
1 = IQ 37
0 = IQ 24
These numbers should be taken with a huge grain of salt, especially at the extremes. For one thing we don’t know if the relationship with IQ is linear since unlike my crossword test, the questions were arbitrarily chosen and do not form a natural scale. Second, the standard deviation of my test respondents is suspiciously low. Although this is great for expanding the test’s ceiling and floor, it is a red flag because it suggests the items themselves intercorrelate poorly which suggests low reliability. At some point I will have to calculate a split-half reliability coefficient to test this hypothesis.
The Picture Arrangement test was first used by Decroly (1914) but gained major attention when it was included in the WWI army IQ tests. However the test never really caught on, but in the 1930s, David Wechsler decided to include it in his scales. Of the 7 items Wechsler originally picked, 3 were stolen from the army tests, and 4 were stolen from the “king” cartoon strips that appeared in The New Yorker.
…you get to look at several cards–at least three, sometimes as many as seven–each of which shows a drawing. The drawings look like panels in comic strips. You are asked to arrange the cards from left to right so that the drawings tell some kind of meaningful story; in some cases, more than one sequence is allowed to be meaningful. Picture Arrangement measures, among other things, your ability to anticipate and to engage in “social planning”…Possibly evidencing his weakness in social planning, the tape at this point records a frustrated sixty-four-year-old mumbling to himself in anguish and occasionally expressing delight at a solution. His final score was nothing to boast about.
There’s a stereotype that libertarians can be a bit autistic so it’s kind of funny that the brilliant libertarian Seligman would struggle on the most social of the Wechsler subtests. Libertarianism also caused more direct problems for Seligman on the other social subtest Comprehension, which straight up asked him to explain why a certain libertarian ideas needed prevention. The feisty Seiligman replied by saying the preventive laws were unneeded, forcing the psychologist to restate the question in a way that didn’t require Seligman to agree with the premise.
Shortly after the great Wechsler died, the Picture Arrangement subtest was dropped from the scale, probably because the test is time consuming, difficult to administer, and doesn’t cluster well with any of the major abilities measured by the WAIS.
Nonetheless I decided to include it in the PAIS (Pumpkin Adult Intelligence Scale) and the 12 items selected have proven to be extremely satisfactory.
Although the test is a pretty good measure of g, Wechsler noted that mental retardates sometimes did well, even when they failed other tests. Conversely, I have noticed that high IQ autistics often do poorly, even when they do well on every other test.
Wechsler claimed psychopaths often do well, but I haven’t seen any real data.
The test measures big picture thinking, the ability to get the idea, size up social situations, see the forest not the trees.
It may also measure sense of humor, and in the case of the Wechsler version, New York Jewish sense of humor.
When I tried the test on the regulars at a pool hall I frequent, their scores out of 12 were 9,8,8,5,5,2,1. The mean was 5.4 with an SD of 3.1. This is a good estimate for Canadians a whole since pool hall customers are a pretty random sample of the population but keep in mind that Canadians are about 3 IQ points brighter than Americans. If we assume the mean of 5.4 = IQ 100 + 3, and the SD of 3.1 = 15, we can perhaps crudely convert to IQ equivalencies (U.S. norms.
Not surprisingly, the mean for my largely brilliant readers was much higher: 8.2 (SD = 2.2).
Nine of my readers also supplied data on their SATs/ACTs. This subset was even brighter still, with a mean of 9.6 (SD = 1.88). Their SATS/ACTs equated to IQs with a mean of 126 (SD = 16) (U.S. norms). If we equate the means and SDs, we get a second method to convert to IQ equivalencies.
There’s a stereotype that IQ tests just measure book smarts and yet intelligence itself evolved because of it’s practical real World survival value. Thus I’m always fascinated when a bookish high IQ nerd decides to compete in a decidedly non-nerdy field like politics. Will their lack of charisma make them look like a dork, or will their intelligence allow them to adapt to even the most unlikely of situations.
Ramaswamy has a lot going against him. He is dark skinned, foreign named and Hindu in a party that is Evangelical Christian and anti-immigration. He’ll never be able to compete with Trump when it comes to charisma and ability to connect with working class whites, however by becoming Trump’s most vocal and articulate supporter and vowing to pardon Trump of everything if he ever becomes President, he is gradually emerging as the most popular non-Trump candidate and inoculating himself from attacks from Trump himself.
He also took the disadvantage of being a perceived foreigner in a nativist movement and cleverly turned it to his advantage by putting a brown face on Trump’s fan base thus making them feel less racist.
By skillfully and shamelessly sucking up to Trump and calling him the greatest President of the century, he was able to get the crowd screaming so hysterically on his side that anti-Trump Chris Christie was nearly booed off the stage.
But Governor Nikki Haley was having none of it. Before this arrogant young Brahman came along, she was the top Indian American in the GOP.
Just as Ramaswarmy had turned the crowd against Chris Christie for being anti-Trump, Haley turned the crowd against Ramaswarmy for being insufficiently pro-Israel, scolding him for thinking Israel needs America; arguing it’s America that needs Israel! The Israel loving crowd went wild.
So what is his IQ?
In 2016 Forbes ranked Ramaswarmy as one of the 40 richest U.S. entrepreneurs under 40. Virtually everyone on the list was born between 1977 and 1993 and all but two were men. Assuming there are 32 million American men born in those years, Ramaswarmy’s 24th place ranking puts his self-made wealth around the one in 1.3 million level for American men in his age range. If there were a perfect correlation between IQ and life-time earnings, this would equate to an IQ 72 points above the U.S. mean, but because the correlation between IQ and permanent income in men is 0.48, his expected IQ is 72(0.48) = 35 points above the U.S. mean or 135 (U.S. norms).
However even this is likely an underestimate because Ramaswarmy is much more educated than the average young gazillionaire. While about 15% of the young and self-made super rich attended Harvard, Ramaswarmy not only graduated, but did so in STEM, and then on top of that, got a JD from Yale Law giving him the most impressive credentials of anyone on the 40 person list (though one other guy went to Caltech).
If there were a perfect correlation between IQ and education, we’d expect the most educated person among the 40 under 40 to be 30 IQ points above the group mean, but since the correlation between IQ and education among same age peers is 0.7, and slips to 0.4 when we look at people of similar income levels, his expected IQ would be 30(0.4) = 12 points above the mean of a group which is already 35 points above the U.S. mean.
In other words the expected IQ of a U.S. under-40 near-billionaire with two Ivy League degrees is 147 (U.S. norms) or 146 (white norms) and until we get some actual psychometric data, this is a good guess for Ramaswarmy.
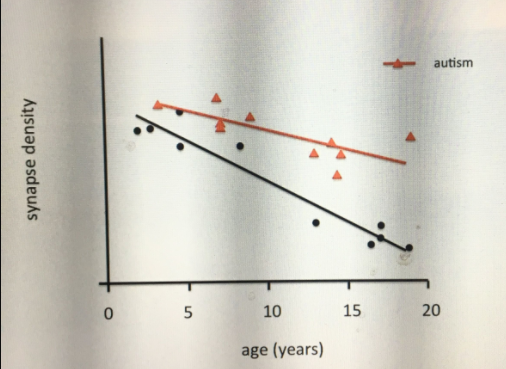
Look at this chart comparing the synaptic density of autistic and non-autistic young people.
Although the sample size is small (which is understandable given how few people not only die in childhood but also have their brains donated to science and also have an autism diagnosis on file) there is virtually no OVERLAP. Every single autistic person is above the regression line for neurotypicals and every single neurotypical is below the regression line for autistic people. What makes this so striking is you’d expect just from misdiagnosis, some people diagnosed with autism would actually be neurotypical and yet despite such error, we still get virtually no overlap, suggesting age controlled synaptic density is virtually a perfect predictor of autism.
So perhaps autism should simply be defined as which regression line you’re closer to in the above chart. The one for autistic people, or the one for neurotypicals. Just as Downs syndrome is diagnosed by an extra 21st chromosome, without need for questionnaires, autism too could have a nice neat medical definition.
On the other hand, I’ve long argued that brain size is a cause of intelligence and that intelligence is the ability to adapt, so how can I associate synaptic density (a proxy for brain size) with a maladaptive condition like autism?
My guess is there are two kinds of big brained people. Those who have big brains because they have a lot of neurons, and those who have big brains because they have a lot of redundant connections between those neurons. The former will tend to be gifted while the latter will tend to have autism, though many will tend to have both. If we limited our samples to nerotypicals, the correlation between brain size and IQ might jump from perhaps 0.4 (the current estimate) to 0.5 or even 0.6.
How exactly extra connections cause autism is not entirely clear. One idea I heard an Asian researcher suggest (sorry I forget his name) is that connections compete to form in a Darwinian struggle, so if you don’t prune the weak ones, you drag down the fitness of the brain.
But why is social intelligence especially impaired in autism? My guess is that since most brain pruning occurs in late childhood and adolescence, the very years where we acquire the most social skills, it is the social brain that especially fails to prune.
1) Is your head circumference at least 1 standard deviation higher than predicted from your IQ (controlling for age, ethnicity and sex)?
2) Is your normalized lifetime household income more than 1 standard deviation lower than predicted from your IQ?(controlling for age, ethnicity and sex)
3) Is your physical coordination more than 1 standard deviation lower than predicted from your IQ?(controlling for age, ethnicity and sex)
4) Is your Picture Arrangement score more than 1 standard deviation lower than predicted from your overall IQ?
5) Is your Comprehension score more than 1 standard deviation lower than predicted from your overall IQ?
If you correctly answered yes to at least 3 of the 5 questions, then in my humble opinion, you might have autism.
I now have data on nine people who have taken both my jig-saw and an undergraduate college admission test (SAT/ACT).
Because age has an acute effect on jig-saw, I converted all jig-saw scores to age adjusted jig-saw scores by deducting 0.33 points points for each year below 32 you are when you took the test (up to a maximum of seven years). I also added 0.33 points for each year above 32 (no maximum).
Thus if you only solved the red puzzle (six pieces) and thus got a score of 6, but you’re 60-years-old (28 years above 32) your age adjusted score becomes 6 + 0.33(28) = 15.
Then using equipercentile equating, I equated the nine age adjusted jig-saw scores with the IQ equivalents of the SAT/ACT scores in the same sample.
The result is the following formula for deriving spatial IQ (U.S. norms) from age adjusted iig-saw puzzle scores:
Spatial IQ = 2.01(age adjusted jig-saw score) + 71.16
To be clear, age adjusted score is simply the score you would have got if you too the test at 32. If you are 32, no need to age adjust.
I other words (at age 32):
Red 0 to 6 pieces: spatial IQ 71 to 83 (U.S. norms)
Yellow 8 pieces: spatial IQ 87
Green 10 pieces: spatial IQ 91
Blue 15 pieces: spatial IQ 101
Bronze 20 pieces: spatial IQ 111
Silver 24 pieces: spatial IQ 119
Gold 30 pieces: spatial IQ 131
If future research replicates these studies, the results have vocational implications. For example, in the past if you had a verbal IQ of 110 and a spatial IQ of 110, it would make just as much sense to pursue a verbal career as a spatial one, since you’re at the 75th percentile in both domains.
However because my jig-saw test like my crossword test before it, has arguably a true 0 point (no ability to join any pieces in 2 minutes), I can arguably say someone with both a verbal and spatial IQ of 110 is twice as verbally smart as the average person, but only 33% smarter spatially. Thus despite being equally ranked in both domains, they’ll be much more dominant verbally. This may help explain why people with high verbal IQs make more money on average than their spatially gifted counterparts.
I created a very special series of jig-saw puzzles. In order to try them you must register by giving a first and last name (email is optional) but you don’t have to use your real name or even the pseudo-name we know you by, but whatever name you choose, please write it down somewhere safe so you’ll remember it for next time I post one of these tests which will likely be very soon. If you already took the crossword test, try to use the same name you used to register for that.
By using the same name every time you take a test, not only can you build a diagnostically informative cognitive profile, but you allow me to calculate how well my tests intercorrelate.
So what makes this spatial test so special? Your score is simply the number of pieces in the hardest puzzle you can solve in 2 minutes. If you can’t solve any puzzle in 2 minutes, your score is simply the number of pieces you connect in 2 minutes on the easiest one.
Because your score is literally the number of pieces you can connect in 2 minutes, this test measures spatial ability on an absolute scale with a true zero point. So someone who can solve the 8 piece puzzle in 2 minutes can be roughly considered 33% more spatially intelligent than someone who can only solve the 6 piece puzzle in 2 minutes.
This is rare chance to study the true distribution of cognition on an absolute scale.