
Tags
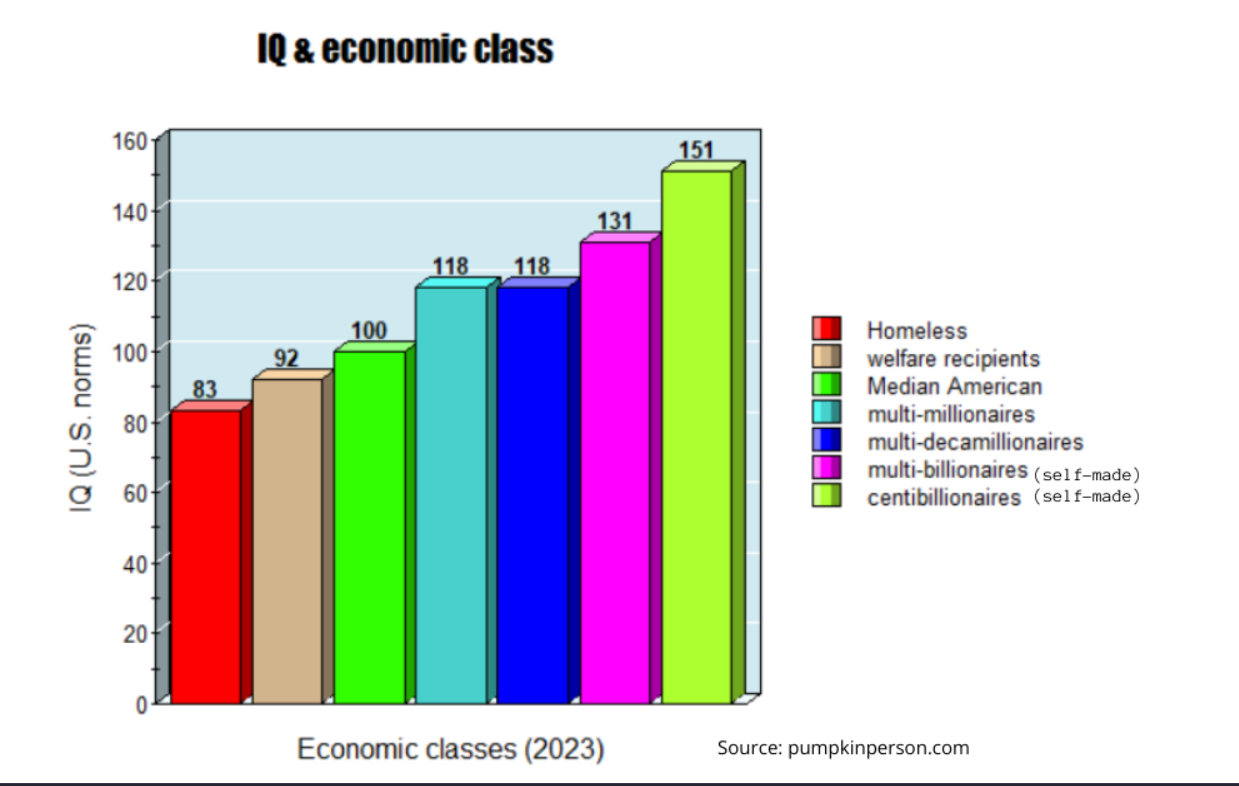
In this article I summarize all I have learned to date about seven economic classes in the United States: The poorest 0.27%, the poorest 10.5%, the median American, the richest 4% , the richest 0.27%, the richest self-made one in a million, and the richest self-made person in America (at any given time). The exact dollar value associated with these groups changes over time, especially at the high end, but in recent years, they can be roughly and respectively thought of as the homeless, welfare recipients, median Americans, multi-millionaires, multi-decamillionaires, self-made multi-billionaires, and self-made centibillionaires. These seven groups appear to have have mean IQs of 83, 92, 100, 118, 118, 131 and 151 respectively. By examining the slope of the regression line predicting the cognitive Z score of each class as a function of their normalized economic Z score, I find that the true correlation between IQ and income should approach 0.5, suggesting roughly half the differences in self-made money are associated with IQ.
The poorest 0.27% (the homeless); Average IQ 83
 |
| Sample: In 2010, there were 637,077 homeless Americans, out of about 235 million U.S. adults (0.27%). By 2020, there were 580,466 homeless Americans out of about 258 million U.S. adults (0.22%) so the poorest 0.27% can still be roughly thought of as the homeless. |
| Cognitive ability: A 2004 study found that 90 homeless men living in a large shelter in Milwaukee, Wisconsin, had a mean WASI full-scale IQ of 83.92 (standard deviation = 15.24). The WASI was published in 1999, and this study was published in 2004, so we should subtract 1.5 points for old norms which are thought to expire by as much as 0.3 points a year (the Flynn effect), so the homeless likely have a mean IQ of 82.5 (U.S. norms). One problem with this study is that 81% of the sample was black (much higher than the 45% among homeless Americans in general) and these tend to score lower on IQ tests, at least in the general U.S. population, however a UK sample of homeless obtained virtually identical scores on the WASI, despite being 96% white. In the UK study, the WASI full-scale IQ distribution of the homeless has a mean of 84.3. In this study, published in 2011, the WASI norms were by now even more outdated, so we should probably subtract as much 3.6 points for old norms, so this homeless sample had a mean IQ ariund 80.7 (U.S. norms) . Given the IQ of 80.7 (U.S. norms) among the the virtually all-white U.K. homeless sample, the IQ of 82.5 among the mostly blacks American sample is unlikely to be deflated by race, thus 83 is considered the best estimate of the American homeless. |
The poorest 10.5% (welfare recipients); Average IQ 92
 |
| Sample: One measure of poverty is the Supplemental Nutrition Assistance Program, or SNAP – commonly known as food stamps. In 1992, 10 million out of 95.67 million U.S. households were on food stamps (10.5 %). |
| Cognitive ability: It’s common knowledge in psychometric circles that reading comprehension tests are statistically equivalent to IQ tests, and a literacy study found that about 2/3 to 3/4 of adult welfare recipients (about 71%) have what’s classified as Level 1 or Level 2 literacy. By contrast, 1/2 of the general adult U.S. population are at these levels. Since by definition, 1/2 of Americans have IQs below 100, it can be deduced that 71% of welfare recipients have IQs below 100. In a normal distribution, the 71 percentile is 8 IQ points (0.53 sigma) above the mean, so if IQ 100 is the 71 percentile among welfare recipients, the average welfare recipient should have an IQ 8 points less. In other words, American welfare recipients average IQ 92 (U.S. norms). Some might object that my analysis falsely assumes welfare recipients have the same IQ variance as the general U.S. population, but the above cited studies of the homeless suggest that poor Americans do indeed have a similar variance to Americans on the whole. |
The median American; Average IQ 100
 |
| By definition, the median American is at the 50th percentile financially. |
| By definition, the median American is at the 50th percentile in IQ which equates to IQ 100 (U.S. norms). |
The richest 4% (multi-millionaires in 2023); Average IQ 118
 |
| Sample: According to the 2000 book The Millionaire Mind by Thomas J. Stanley, which reported on a national survey of 733 millionaires (defined here by household, not individual net-worth), which at the time the book was written, were 4% of U.S. households. The top 4% were largely self-made, with only 8% inheriting more than half their wealth. Of course a $1 million is no longer enough to rank in the top 4%; one now needs $4.7 million, thus the top 4% should now be thought of as all multi-millionaires, at least with respect to household net wealth. |
| Cognitive ability: The average self-reported SAT score of the richest 4% in Stanley survey was 1190. Since Stanley noted that the typical member of this class was 54 circa 1998 (when the book was being written), he likely took the SAT in 1961 (when he was 17) which at the time equated to an IQ of 126 according to my research. But Stanley suspected a self-reporting bias was inflating the numbers since “A students” were more likely to recall their score than “C students”. If we conservatively assume that the 39% of the sample who did not report scores either did not do as well or could not have done as well so didn’t take the test, then an IQ of 126 no longer reflects the average of the richest 4%, but instead just the average of the top 61% of this class, which in a normal curve, would be the 70th percentile. Assuming normal distribution and assuming the richest 4% have the same IQ variance as Americans as a whole just like the homeless did, the 70th percentile is 8 IQ points above the mean, so we should expect the average IQ of all the richest 4% to be 118 (U.S. norms). |
The richest 0.27% (multi-decamillionaires in 2023); Average IQ 118
 |
| Sample: Although one “only” needed a household net-wealth of at least $1 million USD to make Stanley’s sample, some in his sample were decamillionaires (net-wealth of at least $10 million) which at the time the book was written, were 0.27% of U.S. households (can be inferred from the data in this article). By 2023 one needed multi-decamillionaire status to make the top 0.27%. |
| Cognitive ability: Above I noted that the richest 4% had a mean SAT score equating to IQ 118 (U.S. norms). Because Stanley found virtually no correlation between net-worth and SAT among his sample, it might be assumed that the richest people in his sample also averaged IQ 118 (U.S. norms). Of course if the data was not normalized, the zero correlation might be misleading. |
The richest self-made one in a million (multi-billionaires in 2023); average IQ 131
 |
| Sample: In the Forbes 1993 ranking of the 400 richest Americans, 49.5% inherited their wealth (see table 1 of this study) which means the remaining 50.5% were the 202 richest self-made Americans out of about 158 million Americans aged 25+ in the early 1990s (0.0001%, ) or roughly the richest self-made one in a million. In the early 1990s it took just over $300 million USD to rank among the richest self-made one in a million but by 2023 it would take over $3 billion, so being one in a million now requires multi-billionaire status. |
| Cognitive ability: In 1997 Daniel Seligman discussed the IQ of the Forbes 400: “It seems marvelously symbolic that William H. Gates III, the guy listed as number one on The Four Hundred, has an obviously breathtaking IQ. The figure 170 keeps getting into print, which would make him almost certainly the highest on this list or any other list you’re likely to be looking at soon. To be sure, one occasionally sees conjectures that Steven Ballmer, Microsoft’s executive vice president, worldwide sales and support, is in the same IQ league as Bill himself. Ballmer is number six among The Four Hundred.” The 170 seems to be an estimate from his childhood school teacher, however it’s nonetheless corroborated by a claim that he scored 1590 on the pre-1995 SAT which Gates himself seemed to confirm to David Rubenstein during a Q & A at the launch of the Harvard campaign on Sept 21, 2013. Fellow Microsoft leaders Steven Balmer and Paul Allen each scored a perfect 1600 on the SAT according to the Harvard Crimson and the New York Times respectively though neither publication provided a source. At the very least we can assume at least one of these three men scored 1590+ which equated to an IQ of 170+ on the pre-1995 SAT (see chart at the bottom of this article). At the other extreme, Bill Cosby, who with a then net worth of $340 million, made the botttom of the Forbes 400 in the early 1990s, told David Letterman he had a combined SAT score of 500. Very little is known about how the SAT mapped to IQ in the 1950s when Cosby would have taken the test, but data from 1966 suggests an IQ equivalent of 84. However prior to the 1980s, African American teenagers underperformed their IQs on scholastic tests by 8 points, so adjusting for this, his IQ equivalent becomes 92. In Cosby’s case this is likely a colossal underestimate, however for every person who is underestimated by the SAT, there’s someone else who was overestimated, so the SAT distribution should mirror the IQ distribution, even if it’s sometimes quite wrong in individual cases. If we assume that in the early 1990s, the IQs of the self-made members of the 400 richest Americans ranged from 92 (Cosby) to 170 (Gates, Ballmer &/or Allen), then the mid-point of the range is 131 which is a reasonable estimate for the richest 0.0001% (self-made).  |
The richest self-made person in America at any given time (centibillionaires in 2023); average IQ 151
 |
| Sample: Ever since Forbes began annually publishing the names of the “400 richest Americans” in 1982, only eight people have ever topped the list: shipping magnate Daniel Ludwig (1982), oil tycoon Gordon Getty (1983-1984), Walmart founder Sam Walton (1985-1988), media mogul John Kluge (1989-1991), Microsoft cofounder Bill Gates (1992, 1994-2017), investor Warren Buffett (1993), Amazon founder Jeff Bezos (2018-2021), and Tesla and SpaceX CEO Elon Musk (2022-2023). Of these, only five are alive today, and of those only four are self-made (Gates, Buffet, Bezos and Musk) out of 143 million Americans from generation X or older (anyone younger has not had enough time to amass such wealth). Thus becoming the richest self-made American is about a one in 36 million level achievement. |
| Cognitive ability: For the first time ever, we just happen to have publicly known IQ data on every single living self-made person who was ever ranked as the richest American. As mentioned above, Bill Gates reportedly scored 1590 on the pre-1995 SAT, equating to an IQ of 170 (see chart at bottom of this article). Jeff Bezos told The Washington Post he scored 1450, which equated to an IQ of 146. According to biographer Walter Isaacson, Elon Musk scored 1400 on the pre-recentered SAT, equating to an IQ of 142. According to his sister Doris, a woman administered an IQ test to Buffet at age 10 and he scored a couple points above 150. However back in 1940, most IQs were still calculated using the age ratio method meaning a 10-year-old who performed as well as the average 15.2-year-old, was developing at 152% his chronological age and thus assigned an IQ of 152. Although this method (normed entirely on whites) formed a Gaussian curve from IQ 50 to 150, the mean and SD were 101.8 and 16.4 respectively, a little higher than on most modern scales where the mean is set at 100 and the SD at 15. Converting to the modern scales gives Buffet an IQ of 146 (U.S. white norms; also 146 on U.S. norms). Amazingly, all four living members of the “richest self-made person” in America club have IQs of at least 142 (99.7th percentile) and the mean is a spectacular 151 (99.97th percentile)! To quote the late Daniel Seligman “people who are the top in American life, are probably there because they’re more intelligent than the rest of us.”  |
Summary of data
| Economic class | Median economic level (derived by cutting the percentage in each class in half) | Median economic Z score | Median IQ (U.S. norms) | Median cognitive level | Median cognitive Z score |
| Poorest 0.27% (homeless) | Poorest 0.14% of America | -3 | 83 | Dullest 13% of America | -1.13 |
| Poorest 10.5% (welfare recipients) | Poorest 5.25% | -1.6 | 92 | Dullest 30% | -0.53 |
| Median American | Median income | 0 | 100 | Median intelligence | 0 |
| Richest 4% (multi-millionaires in 2023) | Richest 1% (self-made) | +2.07 | 118 | Brightest 11% | +1.53 |
| Richest 0.27%(multi-decamillionaires in 2023) | Richest 0.14% (self-made) | +3 | 118 | Brightest 11% | +1.53 |
| Richest self-made one in a million (multi-billionaires in 2023) | Richest self-made one in 2 million | +4.93 | 131 | Brightest 1.9% | +2.07 |
| Richest self-made person in America at any given time (centibillionaires in 2023) | Richest self-made one in 72 million level (self-made) | +5.53 | 151 | Brightest 0.03% | +3.4 |
To make them easier to compare, I have converted both the median economic level and and median IQ of each economic class into normalized Z scores. This was accomplished by equating the percentile rank of both variables with the number of standard deviations from the mean they’d be if both variables fit a perfectly normal curve.

Discussion


As the above graph shows, when both variables are normalized, the IQ-income correlation is strikingly linear throughout the full economic range, from extreme poverty all the way up to centibillionaire status. Indeed the value of the Pearson's r coefficient is a near-perfect +0.9739.

Of course this is the correlation among entire economic classes and thus is more than double what the individual level correlation would be because non-cognitive factors that affect income (luck, hard work, greed, health, appearance, connections etc) cancel each other out at the group level. Known in the literature as ecological correlations, group level correlations are commonly used in epidemiological studies.

To estimate what the correlation would be at the individual level, we take the slope of the line of best fit which is equal to said correlation when both variables are normalized Z scores.  This slope is 0.47 so roughly half of the normalized differences in economic class is associated with IQ.

The 0.47 figure is much higher than the IQ-income correlation usually reported in the literature and that's because it reflects the correlation of one's IQ with their (self-made) economic class and economic class (homeless, multimillionaire) is a much more stable and reliable indicator of financial success than a single year's income which in the case of stay-at-home wives, can dramatically underestimate their financial earnings since these typically come in the form of domestically negotiated life style, not official salary. In the case of panhandlers, welfare recipients and the disabled, income can overestimate self-made economic class because income is subsidized by government or the charity of strangers.

Indeed other research has found that when you exclude women and focus on permanent income, the IQ income correlation does indeed approach 0.5.

Of course the solution is not to exclude stay-at-home moms (and dads) from the studies, however assigning them zero earnings is wrong too since it implies they are freeloaders who earned nothing of the household wealth when in fact many of them were invaluable partners or at the very least, married wisely. One could solve this problem by using household income as the measure of earnings but this seems unfair to all the single people and gives housewives too much credit for their husband's money.

 If research on IQ and income should persist, I suggest that for individuals, income be measured as individual income but for married people, earnings be measured as [individual income + 0.5(household income)]/2. I further suggest that this be averaged over as many years as possible and that welfare/disability, undeclared income and child benefits be excluded.

MY WHOLE COMMENT RE-TYPED!
HAIRY!
PIs ARE GLABROUS.
ABOS + PAPAUANS + SOME SOUTH INDIANS ARE HAIRY.
BEARD + CHEST HAIR + FOREARM HAIR.
THEIR FACIAL SKELETON IS DIFFERENT TOO!
“PRIMITIVE CAUCASOID” IS A GOOD DESCRIPTION.
^^^NOT A BLACK MAN. A BLACKFELLA!^^^
THE NOSE!
as i’ve commented before: NO OTHER RACE on the planet has that nose.
the abo + papuan NOSE!
nose@nose.com
regarding aa employees i speak from my own LARGE experience and that of pipo i know too.
i also speak from the experience of being an aa hire myself.
i believe i was hired by a chinaman because i was a wypipo.
not much of a job. but the whole thing was FUBAR. if i’d stayed there for years i’d’ve reformed things and been rich.
peepee: so why didn’t you stay dere n shit?
because i’m not a sociopath like you peepee!
You denied HBD for over ten years & through good men like Jensen under the bus in the process. You’re the most evil sociopath here.
densen was evil and retarded. and i still deny HBD. because i’m NOT evil like you the affirmative action racist. you’re so evil it’s absurd.
So you believe all races are equally genetically smart but you don’t believe they should have equal opportunity. What a filthy disgusting evil nepotism hire racist.
You’re not worthy of shining Jensen’s shoes because that man had something you can’t even spell and that’s integrity,
my other virtues were highest score on the first actuarial exam. of like 2,000 pipo.
PLUS being a wypipo.
MY TAIWAN CHINAMAN boss was 6’3″ and a JEW-ess was breathing down his neck.
SO MAYBE NOT!
he KNEW i wasn’t a jew.
This guy Peter Turchin. Theres an interview with him in the FT. He predicts social collapse soley comparing real wage/GDP per person. Hahaha. He says the elites have gotten too greedy. You could almost call him a marxist.
I wanted to tell you guys: Joe Biden has not suffered severe cognitive decline. He does repeat whatever is spoken to him through his earpiece. He does not slur words any more than an average human. It’s completely natural for a person’s eyebrows to randomly become slanted in a way they were not for the rest of their lives and to randomly regrow hair. You are all insane for believing otherwise.
There is no such thing as a conspiracy. There is no deep state. Things just happen because every one in the government innocently behaves according to simplistic happy-go-lucky basic desires and there are too many competing forces for any group to ever hide anything from the public ever. Epstein’s Island for example.
*He does not
Ok honestly i never really read this article first time. Some porkies:
According to the 2000 book The Millionaire Mind by Thomas J. Stanley, which reported on a national survey of 733 millionaires (defined here by household, not individual net-worth), which at the time the book was written, were 4% of U.S. households. The top 4% were largely self-made, with only 8% inheriting more than half their wealth.
I bolded it to help you see CONTRADICTION! with sentence 2. If you look at this study inference…it makes not a lick of sense. Obviously you fell for it like a BLM activist or a Gallup employee.
Because Stanley found virtually no correlation between net-worth and SAT among his sample, it might be assumed that the richest people in his sample also averaged IQ 118 (U.S. norms).
He finds no correlation. And then you make him have a correlation by inferring IQ from a z score. Idiot.
If we assume that in the early 1990s, the IQs of the self-made members of the 400 richest Americans ranged from 92 (Cosby) to 170 (Gates, Ballmer &/or Allen), then the mid-point of the range is 131 which is a reasonable estimate for the richest 0.0001% (self-made).
I have so many problems with this method my head literally hurt reading it.
For the first time ever, we just happen to have publicly known IQ data on every single living self-made person who was ever ranked as the richest American. As mentioned above, Bill Gates reportedly scored 1590 on the pre-1995 SAT, equating to an IQ of 170 (see chart at bottom of this article).
Uh??? What? No we do not. These guys all posted WAIS scores? Where. Show the articles/papers.
defined here by household, not individual net-worth),
At that level, especially in those days, household wealth is individual wealth because wives seldom contributed much financially
He finds no correlation. And then you make him have a correlation by inferring IQ from a z score. Idiot.
LOL! He found no correlation AMONG the millionaires and I acknowledged that by saying both the top 4% and the top 0.27 were both 118.
However 118 is high compared to non-millionaires so a correlation in society as a whole is still strongly implied
I have so many problems with this method my head literally hurt reading it.
lol! I agree that’s the weakest part of the article. In retrospect I would have skipped that data-point.
Uh??? What? No we do not. These guys all posted WAIS scores? Where. Show the articles/papers.
Not the WAIS but Gates reportedly had an SAT in the 1500s, Musk & Bezos in the 1400s, Buffet’s sister reported his childhood Binet IQ. See article for more details
Self reported btw.
Musk also self reported he was a top ranked league of legends player and it was a scam.
But I have always said Buffet is a genius. And Gates. But I didn’t need Binet or SAT. I looked at Linkedin.
No look at linkedin for Bernard Arnault, Carlos Slim, Putin, MBS, and Ellison.
Self reported btw.
Musk also self reported he was a top ranked league of legends player and it was a scam.
And he could be lying about his SAT or selectively disclosing since he took it twice, but an IQ of 140 sounds plausible and if he were to lie, he strikes me as the type to lie big!
But I have always said Buffet is a genius. And Gates. But I didn’t need Binet or SAT. I looked at Linkedin.
It doesn’t take a genius to guess Gates and Buffet are geniuses, but scientists need data. You also said Will Smith was IQ 65 but maybe it’s just black people your skills don’t work on since unlike most Northwest Europeans, your kind evolved to be racist.
Has it ever occurred to you some people marry other people to acquire wealth?
Why did Ivanka Trump pick Jared Kushner?
Is Jared Kushner as good looking as Trudeau or Tom Brady?
Of course that’s occurred to me. Why do you think I focus on self-made. You’re very bad at inferring my beliefs which is odd because you’re socially insightful in other ways. Maybe you simply have dementia and can’t update your Theory of Mind based on new data while still having the memory of some good insights you made pre-morbid.
If you focused on self made…you wouldn’t look at household entities/trust funds.
90% were “self-made” and the wives contributed little to the household. Most millionaires are doctors/lawyers/entrepreneurs. Only at the higher levels of wealth does it extreme inheritance become common but then and the very highest levels, it’s back to “self-made” because old money is too fucking stupid to keep up with the explosion of high-tech wealth
Everything has to be an actual diagram with arrows pointing at different facets….
Ok, we talked about elon’s dad. Now talk about his mother.
Puppy please read a book on upper class families and lives. Jane Austen wrote some good stuff 300 years ago. Start there I guess.
LOL! You have the same taste in books as Oprah! She loves Jane Austin. Oh the irony.
Well I read books. Oprah pretends to read books. And you don’t read books just data tables.
Oprah really does read books. You used to be able to read them. That’s kind of cute though, that a racist kid born in a backwoods family of mentally retarded hillbillies would somehow find a library and read and enjoy an author as high class as Jane Austen. That does show you had a very high IQ at one point in time.
Everything is made up with you. Can you say something that isn’t made up. Name one thing that you believe that isn’t made up by you.
LOL! pill accusing someone else of making stuff up.
Never made anything up once. In 8 years. Fact check me.
My predictions are open to interpretation or obviously not happening. And even those Im usually right.
I predict Nick Fuentes will be dead within 6 months.