• About

Pumpkin Person

~ The psychology of horror

Pumpkin Person

Monthly Archives: July 2018

Preserving your brain might kill you, but it could it help you live forever

14 Saturday Jul 2018

Posted by pumpkinperson in Uncategorized

≈ 28 Comments

The talk about brain preservation in the comment section reminded me of this excellent discussion on CBC radio about preserving your brain long after your body is dead and the progress scientists are making to solve this problem.

Apparently, the only way to salvage your brain for posterity is for it to preserved while you’re still alive, thus killing you.  Waiting until after you’re dead will cause the chemical interactions that are your thoughts and memories to atrophy.

These scientists reject commenter RR’s belief that our minds can not be reduced to our brains.

Share this:

  • Click to share on X (Opens in new window) X
  • Click to share on Facebook (Opens in new window) Facebook
Like Loading...

Neurological variables correlate 0.63 with IQ?

13 Friday Jul 2018

Posted by pumpkinperson in Uncategorized

≈ 46 Comments

I’m starting to feel a bit sorry for HBD deniers.  Their world is crumbling.
Brain scans from people sitting doing nothing explain 20% of the variation in IQ (hat-tip to Steve Hsu)
Press release:

In a new study, researchers from Caltech, Cedars-Sinai Medical Center, and the University of Salerno show that their new computing tool can predict a person’s intelligence from functional magnetic resonance imaging (fMRI) scans of their resting state brain activity. Functional MRI develops a map of brain activity by detecting changes in blood flow to specific brain regions. In other words, an individual’s intelligence can be gleaned from patterns of activity in their brain when they’re not doing or thinking anything in particular—no math problems, no vocabulary quizzes, no puzzles.

“We found if we just have people lie in the scanner and do nothing while we measure the pattern of activity in their brain, we can use the data to predict their intelligence,” says Ralph Adolphs (PhD ’92), Bren Professor of Psychology, Neuroscience, and Biology, and director and Allen V. C. Davis and Lenabelle Davis Leadership Chair of the Caltech Brain Imaging Center.

To train their algorithm on the complex patterns of activity in the human brain, Adolphs and his team used data collected by the Human Connectome Project (HCP), a scientific endeavor funded by the National Institutes of Health (NIH) that seeks to improve understanding of the many connections in the human brain. Adolphs and his colleagues downloaded the brain scans and intelligence scores from almost 900 individuals who had participated in the HCP, fed these into their algorithm, and set it to work.

After processing the data, the team’s algorithm was able to predict intelligence at statistically significant levels across these 900 subjects, says Julien Dubois (PhD ’13), a postdoctoral fellow at Cedars-Sinai Medical Center. But there is a lot of room for improvement, he adds. The scans are coarse and noisy measures of what is actually happening in the brain, and a lot of potentially useful information is still being discarded.

“The information that we derive from the brain measurements can be used to account for about 20 percent of the variance in intelligence we observed in our subjects,” Dubois says. “We are doing very well, but we are still quite far from being able to match the results of hour-long intelligence tests, like the Wechsler Adult Intelligence Scale,”

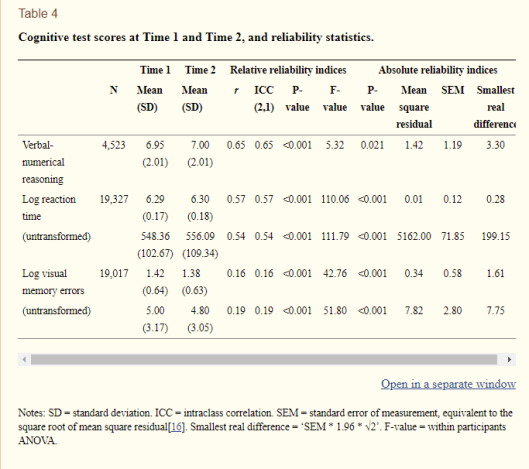
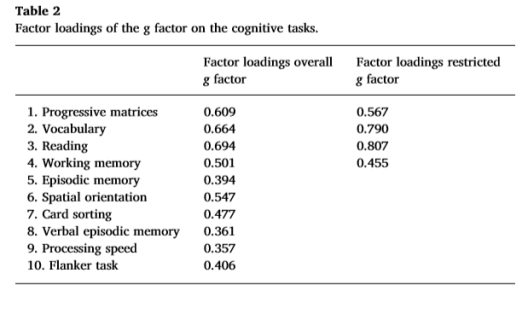
Dubois also points out a sort of philosophical conundrum inherent in the work. “Since the algorithm is trained on intelligence scores to begin with, how do we know that the intelligence scores are correct?” The researchers addressed this issue by extracting a more precise estimate of intelligence across 10 different cognitive tasks that the subjects had taken, not only from an IQ test. …

Paper:

A distributed brain network predicts general intelligence from resting-state human neuroimaging data

Individual people differ in their ability to reason, solve problems, think abstractly, plan and learn. A reliable measure of this general ability, also known as intelligence, can be derived from scores across a diverse set of cognitive tasks. There is great interest in understanding the neural underpinnings of individual differences in intelligence, since it is the single best predictor of long-term life success, and since individual differences in a similar broad ability are found across animal species. The most replicated neural correlate of human intelligence to date is total brain volume. However, this coarse morphometric correlate gives no insights into mechanisms; it says little about function. Here we ask whether measurements of the activity of the resting brain (resting-state fMRI) might also carry information about intelligence. We used the final release of the Young Adult Human Connectome Project dataset (N=884 subjects after exclusions), providing a full hour of resting-state fMRI per subject; controlled for gender, age, and brain volume; and derived a reliable estimate of general intelligence from scores on multiple cognitive tasks. Using a cross-validated predictive framework, we predicted 20% of the variance in general intelligence in the sampled population from their resting-state fMRI data. Interestingly, no single anatomical structure or network was responsible or necessary for this prediction, which instead relied on redundant information distributed across the brain.


But what makes this all the more remarkable is that the study controlled for brain size.

As I’ve blogged about before, brain size itself is known to explain 16% of the variation in IQ (perhaps 20% when you control for gender as many studies don’t), and because brain size was controlled, any IQ variation explained by brain size is independent of the 20% variation explained by brain activity.

So does this mean that by scanning both brain size and brain activity, they can explain perhaps 40% of IQ variation (20% + 20%)?  If so a composite neurological score consisting of both brain size and brain activity would correlate 0.63 with IQ (the square root of 40% of the variance).

Of course none of this proves IQ is genetic, but what it may prove is that IQ is largely biological.

Or does it?

Here we get into the philosophically tricky distinction between culture and biology.  Arthur Jensen has stated that g (general intelligence) appears to be a wholly biological variable, not amenable to psychological manipulation.

But how do we interpret Jensen’s claim when all psychology is ultimately biological.  Even if one asserts that IQ tests measure only middle class knowledge, that in itself must leave a neurobiological imprint, as all learning does.  If so, machine learning should eventually be able to scan your brain to determine whether you took French class in high school or read Hamlet, should it not?

So if culture itself affects brain physiology, what does it even mean for g to not be amenable to psychological manipulation?  I think it means variation in g must be caused by biological variation (genes, nutrition etc) and not by cultural variation.  Overall brain size is probably not much influenced by culture (except for in extreme pathological cases) but I don’t know about brain activity.


Share this:

  • Click to share on X (Opens in new window) X
  • Click to share on Facebook (Opens in new window) Facebook
Like Loading...

How genetic is IQ?

13 Friday Jul 2018

Posted by pumpkinperson in Uncategorized

≈ 17 Comments

A recent study used genomic predictors of cognitive ability, education, and reaction time respectively, derived from a UK sample, to predict test scores in Scottish samples.

vnr3

As we can see, genomic predictors of VNR scores in a UK sample explained 3.59% of the variance in age 70 Morray House IQ scores in a Scottish sample , implying a correlation of 0.19.  However if we assume that the VNR has a g loading of only 0.45, and further assume that the correlation between two scores is a product of their factor loading (Jensen, 1998), then dividing 0.19 by 0.45 tells us that a polygenic score based on a perfect measure of g would correlate 0.42 with Morray house scores at age 70, and if the Morray itself were a perfect measure of g, the correlation would rise  above 0.5, explaining 25% of the variance, since variance explained equals correlation squared.

And keep in mind we are only looking at common additive genetic variance.  Gail Davies et al writes

SNP-based estimates of heritability for general cognitive function are about 20–30%13. However, these estimates might increase to about 50% when family-based designs are used to retain the contributions made by rarer SNPs14. To date, little of this substantial heritability has been explained, i.e., only a few relevant genetic loci have been discovered

Heritability of 50% (meaning genomic predictions of 0.71) might be an overestimate because a lot of the variants might not be causal.  On the other hand it could be an underestimate because we’re still only talking about additive variants; we haven’t even begun to look for gene-gene interactions.

I think it’s neither an overestimate nor an underestimate, but roughly correct, because even the most extreme critics of twin studies pegged heritability at 45%.

Share this:

  • Click to share on X (Opens in new window) X
  • Click to share on Facebook (Opens in new window) Facebook
Like Loading...

The g loading of the UK Biobank’s Verbal Numerical Reasoning test

13 Friday Jul 2018

Posted by pumpkinperson in Uncategorized

≈ 2 Comments

The Verbal Numerical Reasoning test (VNR) is a thirteen item test given to people in the UK Biobank.  It’s kind of like the SAT, except instead of taking 2 hours, it takes 2 minutes.

Given such brevity, I’m not surprised at its low genetic loading in most studies.  Short tests seldom load high on the general factor (g) of IQ tests, and g is the most genetic component of IQ tests.

So how g loaded is the VNR?  One way to try to answer this is to look at its correlation with brain size (corrected for age and ethnicity)

vnr

When highly g loaded IQ tests are used, the correlation between brain size and IQ is 0.4 (maybe a bit higher (0.45) when sex is controlled and a bit lower (0.35) when sex is not controlled as in this study).  And yet the VNR only correlates 0.177 with brain size,  roughly half the 0.35 you’d expect from a highly g loaded (0.9+) IQ test, suggesting the VNR has a g loading of only half as high as the most g loaded tests (0.45 instead of 0.9).

With a g loading of only 0.45, it’s not surprising so few “genes” for IQ have been found.

It’s also worth noting that the VNR has a test-retest correlation of 0.65.   Not bad for a 2 minute test, but nowhere near the 0.9+ stability coefficients that SATs or professional IQ tests show over a four year span.

vnr2


Share this:

  • Click to share on X (Opens in new window) X
  • Click to share on Facebook (Opens in new window) Facebook
Like Loading...

Could the mediocre correlation between the SAT & Raven be the Raven’s fault?

13 Friday Jul 2018

Posted by pumpkinperson in Uncategorized

≈ 58 Comments

Back in 2016 I wrote:

A study by Meredith C. Frey and Douglas K. Detterman found a 0.48 correlation between the re-centered SAT and the Raven Progressive Matrices in a sample of 104 university undergrads, but after correcting for range restriction, they estimate the correlation to be 0.72 in a less restricted sample of college students.  I don’t buy it, but I’m not interested in how well the re-centred SAT would correlate with the Raven among college students, but among ALL American young adults. (including the majority who never took the SAT).

Using the Frey and Detterman data, I decided to look at the Raven scores of those who scored 1400-1600 on the re-centred SAT, because 1500 on the new SAT (reading + math) corresponds to an IQ of 143 (U.S. white norms), which is 46 points above the U.S. mean of 97. Now if the new SAT correlated 0.72 or higher among ALL American adults, we’d expect their Raven scores to only regress to no less than 72% as far above the U.S. mean, so 0.72(46) + 97 = IQ 130.

I personally looked at the scatter plot carefully and did my best to write down the RAPM IQs of every single participant with an SAT score from 1400-1600. This was an admittedly subjective and imprecise exercise given how small the graph is, but I counted 38 top SAT performers and these were their approximate RAPM IQs: 95, 102, 105, 108, 108, 110, 110, 113, 113, 113, 113, 113, 117, 117, 117, 117, 117, 120, 120, 120, 122, 122, 128, 128, 128, 128, 134, 134, 134, 134, 134, 134, 134, 134, 134, 134, 134, 134

raven

The median IQ is 120, and it does not need to be converted to white norms because the Raven was normed in lily white Iowa circa 1993, but as commenter Tenn noted, I should have perhaps corrected for the Flynn effect since the norms were ten years old at the time of the study.  Correcting for the Flynn effect reduces the median to 118 (U.S. white norms) which is 21 points above the U.S. mean of 97.

For people who are 46 IQ points above the U.S. mean on the new SAT to regress to only 21 points above the U.S. mean, suggests the new SAT correlates 21/46 = 0.46 with the Raven in the general U.S. population.

I maintain that the SAT only correlates 0.46 with the Raven in the general U.S. population, however it now seems that this mediocre correlation may be more the fault of the Raven than the SAT.

In a 2017 study by Dimitri van der Lindena, Curtis S. Dunkelb, Guy Madison, the Raven was found to have a g loading of 0.609 in 900 American healthy young adults.

raveng

As Arthur Jensen has noted, the correlation between two tests is a product of their factor loading, so assuming the SAT and Raven have only the g factor in common, the estimated 0.46 correlation between the SAT and Raven, (if all American young adults took the SAT), implies the SAT has a g loading of 0.46 divided by the Raven’s 0.609 g loading.

Thus the SAT may have a high g loading of 0.76!

Share this:

  • Click to share on X (Opens in new window) X
  • Click to share on Facebook (Opens in new window) Facebook
Like Loading...

Data on sex differences in IQ and brain size

13 Friday Jul 2018

Posted by pumpkinperson in Uncategorized

≈ 2 Comments

A while back I promised to blog about sex differences in IQ but never did because I couldn’t find good data (many IQ tests assume the sexes are equal a priori, thus eliminating subtests or items that show big sex differences).

Anyway, here’ s some interesting data comparing the sexes in brain size and g (general intelligence) (hat-tip to James Thompson for blogging about this).

sexdifferences

The first thing I notice is how HUGE younger American adults (age 22 to 37 circa 2011 to 2013) are in brain size.  Scientists have been claiming for years that brains are shrinking, but as Richard Lynn noted back in the 1990s, they only shrunk because of the malnutrition/disease that was agriculture,  but they rebounded over the 20th century.  Indeed if you average the intracranial volume of these “young” American men and women, you get 1,586,683 cubic mm, which is virtually identical to Cro-Magnon’s 1600 cc crania though methods of estimating cranial capacity likely differ and participants in the study were pre-screened for health issues.

As for sex differences in IQ (or g), they’re expressed as Z scores but if we convert them to the IQ scale where all Americans average 100 with a standard deviation (SD) of 15, we find that men average 102 (SD = 13.4), while women average 98 (SD = 13.2).

Share this:

  • Click to share on X (Opens in new window) X
  • Click to share on Facebook (Opens in new window) Facebook
Like Loading...

Open thread week ending July 14, 2018

10 Tuesday Jul 2018

Posted by pumpkinperson in Uncategorized

≈ 289 Comments

Please post all off-topic comments for the week in this thread.  They will not be posted in the main articles.

I’m so excited.  This Friday is Friday the 13th!

pam2

Share this:

  • Click to share on X (Opens in new window) X
  • Click to share on Facebook (Opens in new window) Facebook
Like Loading...

Forbes ranks the World’s 75 most powerful people

08 Sunday Jul 2018

Posted by pumpkinperson in Uncategorized

≈ 35 Comments

Back in May, Forbes released their 2018 list of the World’s Most Powerful People, not to be confused with Pumpkin Person’s 2018  list of the 100 most influential living people of all time.  Power is what you can do.  Influence is about what you have done.  Here’s the top five in power according to Forbes:

worldsmostpowerful

From the perspective of HBD, it seems symbolic than an East Asian is #1.  Don’t agree with Putin being #2.  If any other foreign leader is more power that Trump it should be Bibi, given that Trump recently ripped up the Iran nuclear deal.

Forbes explains how the list was created:

To compile the ranking of The World’s Most Powerful People, we considered hundreds of candidates from various walks of life all around the globe, and measured their power along four dimensions. First, we asked whether the candidate has power over lots of people. Pope Francis, ranked #6, is the spiritual leader of more than a billion Catholics. Doug McMillon (#23), is the CEO of the world’s largest private employer, Wal-Mart Stores, with more than 2.3 million workers around the globe.

Next we assessed the financial resources controlled by each person. Are they relatively large compared to their peers? For heads of state we used GDP, while for CEOs, we looked at measures like their company’s assets and revenues. When candidates have a high personal net worth, like the world’s richest man, Jeff Bezos (#5), we also took that into consideration. In certain instances we considered other valuable resources at the candidate’s disposal, like access to oil reserves.

Then we determined if the candidate is powerful in multiple spheres. There are only 75 slots on our list –one for approximately every 100 million people on the planet– so being powerful in just one area is often not enough. Our picks project their influence in myriad ways: Elon Musk (#25) has power in the auto business through Tesla Motors, in the aerospace industry through SpaceX, because he’s a billionaire, and because he’s a highly respected tech visionary.

Lastly, we made sure that the candidates actively used their power. North Korean dictator Kim Jong-un (#36) has near absolute control over the lives of the 25 million people who live in his country, and is known to punish dissent with death.

To calculate the final rankings, a panel of Forbes editors ranked all of our candidates in each of these four dimensions of power, and those individual rankings were averaged into a composite score. This year’s list comes at a time of rapid and profound change, and represents our best guess about who will matter in the year to come.

In my previous discussion of the World’s richest people, I noted that blacks were dramatically underrepresented in wealth, but given the cultural capital of black celebs, one might have expected more blacks among the World’s most powerful.

And yet blacks are only about 1% of the list, despite being 15% of the World’s population, and despite all the super famous U.S. blacks, not a single African American made the list this year.  It seems blacks get a lot of fame, visibility and status, but are still locked out of power.

To quote J.R. Ewing, “nobody gives you power.  Real power, is something that you take.”

Share this:

  • Click to share on X (Opens in new window) X
  • Click to share on Facebook (Opens in new window) Facebook
Like Loading...

World billionaires by race

08 Sunday Jul 2018

Posted by pumpkinperson in Uncategorized

≈ 39 Comments

Blogger n/a analyzed the ethnic background of Forbes 2013 listing’ of “The World’s Billionaires“:

No. %
Northwestern European 415 29.10
Asian or Pacific Islander 313 21.95
Jewish 249 17.46
Middle Eastern or Central Asian 120 8.42
Eastern European 95 6.66
Southern European 84 5.89
(New World) Hispanic or Brazilian 75 5.26
South Asian 69 4.84
Black 6 0.42
total 1426 100


So even though blacks are 15% of the World’s population, they are only 0.42% of the World’s richest.  Thus their representation among the super rich is only 2.8% of their population share.

White (Gentiles) are 16% of the World’s population, but 41.65% of the World’s billionaires, thus their representation among the super rich is 260% of their population share.

Jews are only 0.2% of the World’s population, but 17.46% of the World’s richest.  Thus their representation is 8,730% of their population share.


Share this:

  • Click to share on X (Opens in new window) X
  • Click to share on Facebook (Opens in new window) Facebook
Like Loading...

World population by race

08 Sunday Jul 2018

Posted by pumpkinperson in Uncategorized

≈ 7 Comments

I found the following chart at the sciencechatforum.com.  Not sure how accurate it is.  One major group that is missing are Jews, but being only 0.2% of the world population, their population is too low to show anyway.

racepie


Share this:

  • Click to share on X (Opens in new window) X
  • Click to share on Facebook (Opens in new window) Facebook
Like Loading...
← Older posts
Newer posts →

contact pumpkinperson at easiestquestion@hotmail.ca

Recent Comments

RaceRealist's avatarRaceRealist on Which better predicts populati…
austin slater's avataraustin slater on Which better predicts populati…
RaceRealist's avatarRaceRealist on Which better predicts populati…
God's Word's avatarGod's Word on Which better predicts populati…
pumpkinperson's avatarpumpkinperson on Which better predicts populati…
RaceRealist's avatarRaceRealist on Which better predicts populati…
Anime's avatarAnime on Which better predicts populati…

Archives

  • December 2025
  • November 2025
  • October 2025
  • September 2025
  • August 2025
  • July 2025
  • June 2025
  • May 2025
  • April 2025
  • March 2025
  • February 2025
  • January 2025
  • December 2024
  • November 2024
  • October 2024
  • September 2024
  • August 2024
  • July 2024
  • June 2024
  • May 2024
  • April 2024
  • March 2024
  • February 2024
  • January 2024
  • December 2023
  • November 2023
  • October 2023
  • September 2023
  • August 2023
  • July 2023
  • June 2023
  • May 2023
  • April 2023
  • March 2023
  • February 2023
  • January 2023
  • December 2022
  • November 2022
  • October 2022
  • September 2022
  • August 2022
  • July 2022
  • June 2022
  • May 2022
  • April 2022
  • March 2022
  • February 2022
  • January 2022
  • December 2021
  • November 2021
  • October 2021
  • September 2021
  • August 2021
  • July 2021
  • June 2021
  • May 2021
  • April 2021
  • March 2021
  • February 2021
  • January 2021
  • December 2020
  • November 2020
  • October 2020
  • September 2020
  • August 2020
  • July 2020
  • May 2020
  • April 2020
  • March 2020
  • February 2020
  • January 2020
  • December 2019
  • November 2019
  • October 2019
  • September 2019
  • August 2019
  • July 2019
  • June 2019
  • May 2019
  • April 2019
  • March 2019
  • February 2019
  • January 2019
  • December 2018
  • November 2018
  • October 2018
  • September 2018
  • August 2018
  • July 2018
  • June 2018
  • May 2018
  • April 2018
  • March 2018
  • February 2018
  • January 2018
  • December 2017
  • November 2017
  • October 2017
  • September 2017
  • August 2017
  • July 2017
  • June 2017
  • May 2017
  • April 2017
  • March 2017
  • February 2017
  • January 2017
  • December 2016
  • November 2016
  • October 2016
  • September 2016
  • August 2016
  • June 2016
  • February 2016
  • January 2016
  • November 2015
  • May 2015
  • January 2015
  • December 2014
  • November 2014
  • October 2014

Categories

  • ethnicity
  • heritability
  • income
  • Oprah
  • Uncategorized

Meta

  • Create account
  • Log in
  • Entries feed
  • Comments feed
  • WordPress.com

Blog at WordPress.com.

Privacy & Cookies: This site uses cookies. By continuing to use this website, you agree to their use.
To find out more, including how to control cookies, see here: Cookie Policy
  • Subscribe Subscribed
    • Pumpkin Person
    • Join 686 other subscribers
    • Already have a WordPress.com account? Log in now.
    • Pumpkin Person
    • Subscribe Subscribed
    • Sign up
    • Log in
    • Report this content
    • View site in Reader
    • Manage subscriptions
    • Collapse this bar
 

Loading Comments...
 

    %d