
One of the problems with studying the controversial subject of race and IQ is we do not have reliable data on the racial IQ distributions of very many races. Richard Lynn’s 2006 book made a major contribution to the field, but analyzing hundreds of studies was too ambitious a task for a single 76-year-old man and inevitably the research was criticized for biased selection of data and clerical errors. Another problem was that different races sometimes took very different tests under wildly different circumstances and living conditions, ranging from modern industrialized society to pre-literate hunter-gathering.
To sidestep these problems, I decided to compare all races on the same type of tests (literacy and numeracy) under similar conditions (as students attending modern schools). Although achievement tests are not technically IQ tests, they correlate better with IQ tests than some of the actual IQ tests used by Lynn (i.e. Mazes, Draw a Person) and because they are only taken by people with similar schooling, some of the culture bias inherit in all paper and pencil tests is removed. They also have the advantage of being given to huge and representative samples.
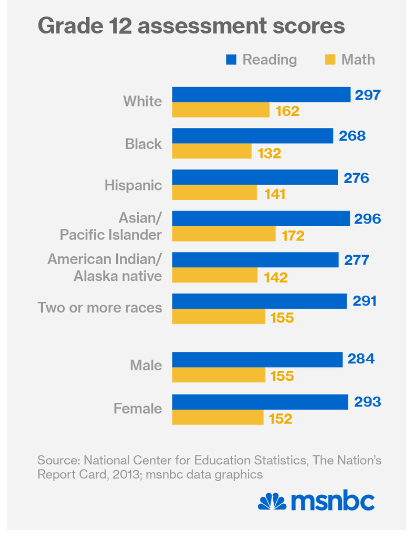
The first major data set is the NAEP mass testing of U.S. 12th graders (above), known as the nation’s report card. Since an IQ of 100 is by definition whatever score the average U.S. white obtains, a reading, math, and combined score score of 297, 162, and 459 are all equal to IQ 100. Since I already estimated that U.S. black 12th graders in recent years score an IQ equivalent of 90, 86, and 87 in reading, math, and combined respectively, simple linear extrapolation allows us to infer the IQ equivalents of all the above demographic groups:
| reading iq | math iq | combined iq | |
| white | 100 | 100 | 100 |
| black | 90 | 86 | 87 |
| hispanic | 93 | 90 | 91 |
| asian/pacific islander | 100 | 105 | 102 |
| american indian/alaska native | 93 | 91 | 91 |
| two or more races | 98 | 97 | 97 |
| male | 96 | 97 | 96 |
| female | 99 | 95 | 97 |
The scores of Asian Americans are probably dragged down a bit by the inclusion of Southeast Asians, Pacific Islanders and people with language difficulties. I suspect if the Asian sample was limited to second generation Northeast Asian Americans, the mean combined IQ would be 105. Some might argue that Asian scores are inflated by selected migration and a culture of studying. While the latter might be true, the former is unlikely given the spectacular academic performance of Northeast Asians in their home countries.
The scores of American Indians/Alaskas natives are probably dragged down by fetal alcohol syndrome and extreme cultural deprivation. Just as African Americans saw their IQs as measured by achievement tests increase from 80 in the 1970s to 87 today, I suspect indigenous Americans are also 7 points below their genetic potential and may have the genetic potential to average 98.
The scores of African Americans are probably slightly inflated by white admixture and I suspect the scores of unmixed descendants of black American slaves would average about 83. On the other hand if slaves were drawn primarily from the lower end of the African IQ distribution, the scores of African Americans may be deflated relative to the potential of the global black population.
Ashkenazi Jews
Jewish Americans are not included here but previous large scale research suggests a verbal IQ of 109, a math IQ of 113, and thus a combined IQ of 112 on measures of reading and math. Ashkenazi Jews have an anomalously high IQ for a Caucasoid race, but they are such a tiny percentage of the population that I suspect the highest IQs in the World all belong to peoples of Northeast Asian ancestry.
Australian aboriginals
Data from PISA studies show indigenous Australians score 0.87 SD below non-indigenous Australians on reading tests, suggesting a reading IQ of 87.
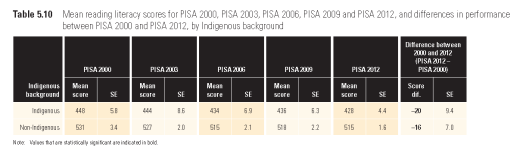
Meanwhile they score 0.9 SD below on math, suggesting a math IQ of 86.

This suggests a combined IQ of 85. However like indigenous Americans, I suspect that Australian aboriginals are like U.S. blacks in the 1970s (scoring at least 7 IQ points below their potential on achievement tests) so I estimate their potential IQ to be 92.
However I also estimate that indigenous Australians are 43% white at the genetic level, and correcting for this reduces the potential IQ of full-blooded Australoids to 86.
Dark Caucasoids
Data from PISA studies suggest dark caucasoids in Turkey average about 87, but like indigenous peoples, the Arab world is probably about 7 points below their full potential given that less than half of the Turkish population finishes high school, so I suspect they have the genetic potential to be IQ 93.

What about that new study published in Nature last week, which was even covered in mainstream media sites that usually hate to discuss IQ, much less its heritabliity?
https://www.theguardian.com/science/2017/may/22/scientists-uncover-40-genes-iq-einstein-genius
Isn’t it now just a matter of time before some researcher (probably in China) connects the dots to say look, this ethnic group has very few of the “good” variants of those genes, and this other ethnic group has a lot more of those good variants? Will that put an end to all the whining about some groups underperforming because of systemic racism etc?
No control for dropout rates?
Another issue with you calculations is that you’re reasoning like IQ causes educational success when everything indicates that schooling raises IQ. So your genetic hypothesis are baseless.
>PISA
Seriously? Surely you know how much school quality comes into play with teaching the PISA.
Seriously? Surely you know how much school quality comes into play with teaching the PISA.
I agree, but truly culture reduced tests are seldom given to large representative samples of racial groups. The closest we have to a culture reduced mass administered test is the Raven, but studies show that too is surprisingly sensitive to schooling, probably because it requires a lot of intellectual persistence, a habit acquired in school.
Pumpkin, what do you think of the test I took in January.
It says I read at the 2nd-grade level.
And math at the 5th-grade level.
Can some of this be tied into my processing speed and also that the test may be a poor way to sampling for education?
What does Pumpkinperson thinks about that?
Abstract: Some academic publications infer from studies of transracial adoptees’ IQs that East Asian adoptees raised in the West by Whites have higher IQs than Western Whites, and that White adoptees raised by Whites have higher IQs than Black adoptees raised by Whites. Those publications suggest that this is because genetic differences give East Asians a higher mean IQ than Whites, and Whites a higher mean IQ than Blacks. This paper proposes a parsimonious alternative explanation: the apparent IQ advantage of East Asian adoptees is an artifact caused by ignoring the Flynn effect and adoption’s beneficial effect on IQ, and most of the IQ disadvantage of Black adoptees disappears when one allows for attrition in the Minnesota Transracial Adoption Study, and acknowledges the results of other studies. Diagnosing these artifacts suggests a nil hypothesis: East Asian, White, and Black adoptees raised in the same environment would have similar IQs, hinting at a minimal role for genes in racial IQ differences.
http://www.mdpi.com/2079-3200/5/1/1/htm
Interesting. I never blogged about the high IQs of adopted East Asians because I long suspected they were inflated by old norms (Flynn effect) so interesting to see a study attempt to correct for it. I’ll have to read the study to see if they did so properly.
Race and IQ were invented by racist idiots to promote the ideals of the American Eugenics Movement. They are still used today by racist idiots.
Pretty much hit the nail on the head. It’s used to validate the social class structure due to how the tests are constructed. I wouldn’t say ‘racism’ is the cause, though. Just a need to validate the current structure in America and they have constructed tests that correlate with class structure.
Lol the author of this article and Richard Lynn must not be very intelligent if they can’t figure out the actual causation of the average scores…it’s obviously because of the variation in the sample sizes, birth rate, infant mortality rate which correlates at around r=-.8 or stronger with average IQ scores.
What does the infant mortality rate have to do with anything probably thinks the readers?
– Leading causes of infant mortality are prenatal/natal factors linked to impaired brain development and lower IQ (things like underweight birth, birth defects, malnutrition) by age 2 humans reach around 80% of their adult brain size.
The way that an embryo grows and develops has a big impact on brain development and is directly connected to the infant mortality rate.
Cloning experiments indicate the same.
– Academic tests usually have age rules only allowing the younger age group to participate and a low infant mortality rate seems to nearly always mean the younger group is a small sample size.
With small sample sizes outliers like talented students stand out and it’s automatically easier to gain higher calculated average scores.
This means basically any country or group should be able to gain high calculated average scores for the age 15 or under age 20 group if they can gain a low birth rate and infant mortality rate.
The Whites and East Asians in large sample sizes born during the time-period when the infant mortality rate was high don’t have high IQs on average.
A small sample of every group should have a high average IQ.
This infant mortality rate hypothesis explains everything nearly perfectly much better than the fantasy imagined genetics claim or poverty or socioeconomic factors or the education system or any other explanation.
Many people have claimed that East Asians are genetically better at mathematics for instance let’s see if the infant mortality rate explains things better than genetics or not. Cambodia, Laos, and Myanmar are the only countries I can find genetically like East Asian with high infant mortality rates they ranked at the very bottom of all countries in the popular math IMO contest (has an under age 20 rule)…almost every country in the entire world ranked higher so much for the genetics claim.
Every other group genetically like East Asian seems to have medium-low or lower infant mortality rates even with extreme levels of poverty and negative socioeconomic factors like Vietnam and North Korea actually have below replacement level fertility rates (meaning the younger group sample size is small), medium-low infant mortality rates, and among the lowest percentage of underweight infants in the world (actually lower than the US’) even though based on poverty and socioeconomic factors you wouldn’t think so.
Kosovo is the only European country I can find with a high infant mortality rate and they ranked at the very bottom of all countries in the PISAs (the PISAs has an age 15-16 rule as expected, correlates at around r=-.8 with the infant mortality rate as expected).
Have you ever mentioned the infant mortality rate, birth rate, or younger group sample size on your blog site? Or did you not recognize the pattern…I guess IQ tests don’t measure everything that someone’s brain does if people with allegedly high IQs can’t recognize a pattern that simple and easy.
I think Richard Lynn did mention the sample size a little bit but instead he claimed that a sample size of more than 3,000 was too small for Kenya so using his own reasoning nearly every sample size used for Europeans and East Asians in his book should be thrown out and disregarded since almost every sample size used for Europeans and East Asians was much much much smaller than 3,000 people (what a real clown he basically refuted his own book).
I’ve always wondered why many people with high IQs can’t recognize patterns or generate ideas or independently reason things I guess IQ puzzles are different this makes their IQ completely useless.
I’ve considered prenatal effects before you even thought you could think it, but ruled it out because in the Minnesota transracial adoption study, the half-black kids scored half the typical black-white IQ gap (consistent with the genetic hypothesis) even though they had white biological mothers (and thus white prenatal). Mind you the sample size was small and suffered from attrition so the theory should not be completely dismissed.
Looks like you did not really as your posts rants about fantasy genetic potential and seems to never mention the infant mortality rate or fertility rate or sample size.
The infant mortality rate, fertility rate, and sample size explains the average scores perfectly much better than genetics…looks like fans of the genetics explanation are trying to censor it out (correlates at r=-.8 to r=-.9 with nearly every sample) to prevent their delusions from being falsified.
Underweight birth has been linked to stunted brain growth and lower IQ, and also higher infant mortality rates.
Certain birth defects have been linked to impaired brain development and lower IQ, and also higher infant mortality rates.
Malnutrition as an infant has been linked to stunted brain growth and lower IQ, and also higher infant mortality rates.
We can clearly see the direct connection between the infant mortality rate and brain development.
By age 2 humans reach around 75-80% of their adult brain size. Most brain development ends around age 3-5.
Lots of peer-reviewed studies, research, and cloning experiments clearly indicate that the way that an embryo grows has big impacts on brain development and IQ whereas the evidence for genetics so far is based on fantasy, imagination, and speculation this study shows “Most reported genetic associations with general intelligence are probably false positives.” https://www.ncbi.nlm.nih.gov/pubmed/23012269
The real reason why half-Black kids score half the typical black-White IQ gap is because their infant mortality rate is in between the Whites and unmixed Blacks (smaller sample size, less non-genetic negative factors influencing brain development).
The grade 12 sample mentioned on this post only reflects the age 17-18 sample which is directly connected to the infant mortality rate and fertility rate (obviously).
The fertility rate, infant mortality rate, and percentage of infants underweight explains the results perfectly.
US Blacks have the highest infant mortality rate, highest percentage of infants underweight, and 2nd highest fertility rate so the lowest scores would be expected.
Hispanics have a high fertility rate but low infant mortality rate so scores in between would be expected.
Native Americans have a low fertility rate but high infant mortality rate so scores in between would be expected.
Whites and East Asians have both a very low fertility rate and infant mortality rate so the highest scores would be expected.
It matches in exactly, precisely, perfectly.
Unmixed Blacks with lower infant mortality rates would have higher average IQs than mixed Blacks based on this hypothesis. Barbados is a 90% African country their infant mortality rate is medium-low (not super-low), Cardinal Warde from Barbados is a full Professor of Electrical Engineering and Computer Science at MIT, PhD. in physics at Yale University, published more than 100 technical papers…this more matches into the infant mortality rate hypothesis rather than genetics.
I would expect the older unmixed Whites born during the time-period when the fertility rate and infant mortality rate was higher to have lower average IQs and the SAT score data from the 1960s and 1970s show very low SAT scores for unmixed Whites back then so very low that many have tried to inflate the score since it doesn’t match into genetics…this matches in again with this hypothesis.
A much better question would be controlling for non-genetic factors which group would be genetically smarter.
There could be many groups genetically smarter than Whites and East Asians controlling for non-genetic factors but not shown because their average scores are lowered by non-genetic factors like the sample size and factors influencing embryo growth and brain development.
Cambodia, Laos, and Myanmar ranked at the very bottom of all countries in the popular IMO math contest (the only groups I can find genetically like East Asian with high infant mortality rates) many countries with higher infant mortality rates did better so this means it may turn out to be shown in the future that East Asians are genetically the least intelligent but their intelligence is nearly always artificially increased by non-genetic factors (smaller sample sizes, lower percentage underweight, etc…).
The control variable is the highlight of the scientific method I guess we just live in an anti-science society with Richard Lynn and his anti-science fans.
So far this hypothesis with the infant mortality rate, fertility rate, and factors influencing brain development (underweight birth) explains the average scores of the younger group nearly perfectly and remains unrefuted.
Anyone can falsify this hypothesis by pointing out a country or group with a high infant mortality rate and fertility rate that did well on tests with younger group age rules.
Nearly all academic tests and contests only reflect the younger group PISAs has an age 15-16 rule, SAT scores usually only reflect age 16-17, IMO contest under age 20 rule, etc….which is directly connected to the fertility rate and infant mortality rate and does not reflect the majority of the population.
The younger Whites and East Asians represent a very small fraction of the population of Whites and East Asians (most White and East Asian countries have median ages in the 40s+) so higher average scores for the younger group is expected.
So far this infant mortality rate, fertility rate, sample size hypothesis remains unrefuted.
The real reason why half-Black kids score half the typical black-White IQ gap is because their infant mortality rate is in between the Whites and unmixed Blacks (smaller sample size, less non-genetic negative factors influencing brain development).
The half-black kids had a sample size of 55 (not that small) and despite having both a prenatal and family environment that was 100% white (their biological mothers were ALL white and they were adopted into white upper-class homes) their Flynn effect adjusted IQs at 17 averaged 93 (half way between the U.S. black mean at the time of 85 and the U.S. white mean of 102), just as the genetic hypothesis would predict. So although the prenatal hypothesis is extremely plausible (and I endorse it for explaining the Flynn effect), its prediction has been tested and failed. Of course the study needs replicating before we can be 100% certain, but preliminary data says you’re wrong:
https://en.wikipedia.org/wiki/Minnesota_Transracial_Adoption_Study
^^^ what a great comment.
“Underweight birth has been linked to stunted brain growth and lower IQ, and also higher infant mortality rates.”
The effects of slavery may have caused epigenetic effects on birth weight in American blacks. See Jansienska (2009), “Low Birth Weight of Contemporary African Americans: An Intergenerational Effect of Slavery?” For a general overview of the physiology behind racist and sexist oppression (real or imagined they cause the same effects) see Shannon Sullivan’s book on the matter.
Fun fact. Yours truly was 2 pounds at birth, born almost 3 months premie. Now decades later I’m 165 at ~10 percent body fat, Hella strong, with a solid career.
“Although achievement tests are not technically IQ tests, they correlate better with IQ tests than some of the actual IQ tests used by Lynn”
I mean, is this supposed to mean anything? Why do they correlate, PP? It’s because they’re largely the same test – all standardized testing has similar content so it’s no wonder they correlate! It does NOT prove anything.
Why is it that group ability tests predict school achievement as well as they do? The answer is quite simple. Group achievement tests and group ability tests are sufficiently similar that without lables, one has difficulty telling which is which. If these group ability tests are used to predict, and group achievement gets are used to confirm the predictions, why should anyone be surprised? Schwartz, 1975, “A Is to B as C Is to Anything at All: The Illogic of IQ Tests.”
A person’s height and their shadow’s height correlate perfectly. Does that mean there’s no difference between you & your shadow?
Really PP? Is this the best you have? Why are you hereditarians so obsessed with height and relating it to IQ? Your analogy is ridiculous – constructed tests and a valid measure? Don’t make me laugh.
In any case, you’ve dodged the objection.
Your objection was silly. No one brags about IQ tests predicting achievement tests. Wechsler himself agreed with you that IQ tests are a kind of achievement test, but they also can be distinguished by objective criteria as I explained in two very recent articles on family effects and age effects.
You said that “achievement tests are not technically IQ tests, they correlate better with IQ tests than some of the actual IQ tests used by Lynn”, if I misunderstood you, then please correct me. In virtue of what is the passage I cited not relevant here?
RR, enough!
what countries were your great grandparent born in peepee?
Half were born in Germany unlike your ancestors who invaded the americas
Technically you’re an illegal immigrant. By what legal authority did your ancestors come to the U.S.?
7 of my eight great grandparents were born in the US. the 8th was born in england.
what were your European ancestors doing in the U.S.?
“Some might argue that Asian scores are inflated by selected migration and a culture of studying.”
I mean, this is true but they are hyper-selected and so, class matters less for Asian Americans in regard to academic outcomes:
Why class matters less for Asian-American academic achievement
Inequalities reproduce at both ends of the educational spectrum. Some students are assumed to be low-achievers and undeserving, tracked into remedial classes, and then ‘prove’ their low achievement. On the other hand, others are assumed to be high-achievers and deserving of meeting their potential (regardless of actual performance); they are tracked into high-level classes, offered help with their coursework, encouraged to set their sights on the most competitive four-year universities, and then rise to the occasion, thus ‘proving’ the initial presumption of their ability. These are the spill-over effects and social psychological consequences of the hyper-selectivity of contemporary Asian While the latter might be true, the former is unlikely given the spectacular academic performance of Northeast Asians in their home countries.
https://sci-hub.tw/10.1080/1369183x.2017.1315851
Let me preempt a response from PP:
“It’s their ethnic genetic interests; they’re both Asians so they are attempting to say that it’s due to hyper-selective migration.”
“the former is unlikely given the spectacular academic performance of Northeast Asians in their home countries.”
Nevermind the fact that Lynn doesn’t cite numerous studies showing opposite results:
https://raceandiqmyths.blogspot.com/2016/10/fake-chinese-iq-studies-richard-lynn.html
https://raceandiqmyths.blogspot.com/2016/11/low-iq-data-set-on-china-as-mentioned.html
Let me guess, “Lynn is old and it’s hard to search to search through thousands of research papers” to find these papers, right?
Are you aware of the many reports of Chinese cheating on standardized testing?
https://www.theatlantic.com/education/archive/2016/03/how-sophisticated-test-scams-from-china-are-making-their-way-into-the-us/474474/
https://www.lamag.com/citythinkblog/ucla-cheating/
https://www.telegraph.co.uk/news/worldnews/asia/china/10132391/Riot-after-Chinese-teachers-try-to-stop-pupils-cheating.html
https://nypost.com/2019/05/02/feds-bust-cheating-ring-that-took-english-test-for-chinese-nationals/
This is but a sample, you can find many more if you search for yourself.
But the Chinese are trying to stop it:
https://www.inkstonenews.com/education/how-chinas-high-tech-cheaters-are-trying-beat-gaokao/article/2149649
Chinese ‘IQ’ is fake.
The answer is we don’t know. To avoid the elite immigrant bias, I’m trying to collect a sample of Chinese descended from indentured labourer migrants but there aren’t many pure ones left
(Don’t post the other comment)
So why, then, do the second-generation Chinese score lower than other nationalities in Spani?
Calibrated Ambitions: Low Educational Ambition as a Form of Strategic Adaptation Among Chinese Youth in Spain
Based on analysis of the Longitudinal Study of the Second Generation in Spain, findings from this study show that Chinese youths in Spain have substantially lower educational ambitions and attainment than youths from every other nationality.
https://sci-hub.tw/10.1111/imre.12037
Why do East Asian countries dominate international math tests? Do they all cheat? But white countries never cheat?
I see that you disabled replies or whatever.
“The half-black kids had a sample size of 55 (not that small) and despite having both a prenatal and family environment that was 100% white (their biological mothers were ALL white and they were adopted into white upper-class homes) their Flynn effect adjusted IQs at 17 averaged 93 (half way between the U.S. black mean at the time of 85 and the U.S. white mean of 102), just as the genetic hypothesis would predict. So although the prenatal hypothesis is extremely plausible (and I endorse it for explaining the Flynn effect), its prediction has been tested and failed. Of course the study needs replicating before we can be 100% certain, but preliminary data says you’re wrong”
If a sample size of more than 3,000 is too small for Kenya then a sample size of 55 is too small and insignificant according to Richard Lynn’s own reasoning.
You seem to not understand what I said about the fertility rate, infant mortality rate, and underweight birth which includes more than just prenatal factors alone since Richard Lynn is more of an anti-science person so I’ll have to explain.
The adoption study you cited doesn’t refute this hypothesis it actually matches in exactly since the biological black parents had higher infant mortality rates and higher percentage of underweight infants than other groups.
Based on this hypothesis we would still expect groups adopted from regions with higher infant mortality rates to have lower average IQs…
The infant mortality rate data from the 1970s clearly shows that biological blacks had extremely high infant mortality rates back then matching in exactly to the fertility rate and infant mortality rate hypothesis which still remains unrefuted.
The reason why you think that the genetics hypothesis matches in but not the infant mortality rate hypothesis is because correlation isn’t causation. Whites had the lowest infant mortality rates, then mixed Blacks higher, and unmixed Blacks the highest which matches in exactly.
Also many adoptions are done after age 2 (by age 2 humans already reach 75%-80% of their adult brain size) so being adopted after certain age won’t have any effect on brain development.
So the adoption study matches in exactly to the infant mortality rate hypothesis rather than genetics hypothesis.
Controlling for genetics the fertility rate and infant mortality rate still explains everything nearly perfectly.
Still no explanation as to why Cambodia, Laos, and Myanmar ranked at the very bottom of all countries in the popular math IMO contest the only groups genetically like East Asian with high infant mortality rates matching into the fertility rate and infant mortality hypothesis but not genetics at all.
Nearly every country in the entire world ranked higher so what’s the explanation based on genetics alone?
Genetics shows the majority of people in Cambodia, Laos, and Myanmar as identical to other East Asians. Mongolians are actually more genetically distant from East Asians than the people in those countries.
So this means it matches exactly into the fertility rate and infant mortality rate hypothesis exactly but not the genetics hypothesis at all.
East Asians are actually genetically close to Australoids but Australoids according to Richard Lynn have lower average IQs than sub-Saharan Africans.
SAT score data from many all White regions in the 1950s-1970s clearly show very low average SAT scores in the 700s-800s for many all White high schools which matches in exactly to the fertility rate and infant mortality rate hypothesis but not into the genetics hypothesis at all.
I guess we live in the age of anti-science with Richard Lynn and other anti-science people who don’t pose ways to falsify a hypothesis maybe I should make my own blog site.
Anyone can easily falsify what I said by pointing out any group that performed well on academic tests with age rules that have high fertlity rates and infant mortality rates…so where is it? Oh looks like it never happened ever.
Average scores have to do with the sample size and the infant mortality rate has do to with factors influencing brain development at early ages. Also a lot of people learn better alone than in groups (it’s been observed with many non-human pets that they don’t learn as well in groups than one by one).
The infant mortality rate, fertility rate, and underweight birth data clearly shows Whites and East Asians as having the lowest matching in exactly.
Vietnam and North Korea actually have lower fertility rates and percentage low-birthweight babies than US Blacks, 5% underweight for Vietnam, 6% North Korea, 12% US Blacks (https://data.worldbank.org/indicator/SH.STA.BRTW.ZS?most_recent_value_desc=false, https://www.cdc.gov/nchs/products/databriefs/db306.htm).
Cambodia, Laos, and Myanmar also have slightly lower percentage of low-birthweight babies than US Blacks as well but still did very poorly in the IMO test worse than many countries with higher infant mortality rates and a higher percentage of underweight infants which doesn’t match into genetics at all.
Everything matches in exactly to the fertility rate, infant mortality rate, and percentage of infants underweight it’s just that Richard Lynn and his fans feel bad that I debunked their nonsense really easily without thinking much at all so they try to avoid mentioning the fertility rate, infant mortality rate, and percentage of infants underweight since it explains everything perfectly.
Based on this hypothesis I would expect US Blacks to start performing well on the SATs sometime in the 2040s…basically any country or group can perform well in academic tests with age rules if they gain fertility rates, infant mortality rates, and percentage of low-birthweight babies as low as the majority of European and East Asian countries.
If you count only the US Blacks that weren’t born underweight in the regions with low infant mortality rates I’m sure they would also have high average SAT scores but they don’t represent the majority of people just like how the modern day age 17-18 sample doesn’t represent the majority of Whites and East Asians.
The truth hurts.
The real average IQ for Whites and East Asians counting every age group is somewhere in the 70s-90s…academic tests only reflect the younger group which is represents like no one for Whites and East Asians so higher average scores are expected.
But this could mean something else that natural selection does not favor a high IQ for survival. People tend to imagine higher as better but in nearly every condition too high becomes a negative.
It seems like natural selection favors an IQ somewhere in the 80s-90s range. This is the same IQ range of the majority of careers directly connected to survival (construction workers, farmers, plumbers, mechanics, etc..). The majority of high IQ careers have no connection at all to survival just useless obsolete stuff.
Also the fertility rate is supposed to be high enough for survival…many European and East Asian countries are experiencing population decline. Japan’s population is projected to be only 50 million by 2090…going extinct.
I think I should make my own blog site I don’t like this age of anti-science anyone can easily falsify what I said by pointing any group that performed well on academic tests with age rules with high infant mortality rates and fertility rates…so where is it?
It remains unrefuted.
Again you were refuted by the Half-black kids (with white prenatal environments) who showed half the racial gap. Not sure what part of that you don’t understand. A sample size of 55 is fine. If you disagree with the results then replicate the study with a bigger sample but until then I’m gonna listen to the actual science