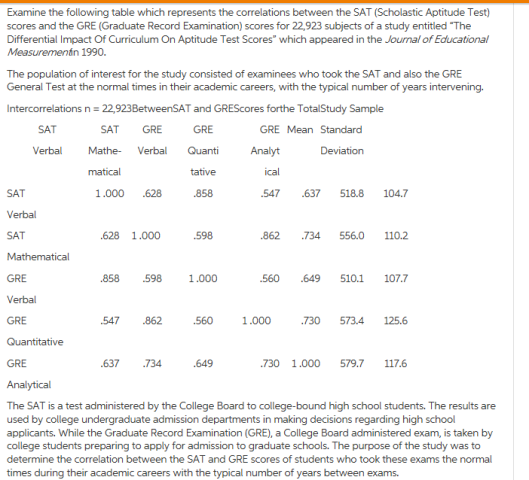
Based on thousands of people who took both the SAT and GRE in the 1980s, we can say that a verbal GRE of 510.1 (SD 107.7) equaled an SAT verbal of 518.8 (SD 104.7)
By the end of the 1980s, the average GRE taker 484 SD 125 (source)
From the above data points, we can say GRE takers had the equivalent of a verbal SAT of 493 (SD 122).
Now national norms studies suggest that if all American young adults had taken the SAT in the 1980s (not just the college-bound elite), the verbal mean and SD respectively would be 376 and 102 (Herrnstein & Murray 1994). If the U.S. mean is defined as 100 and 15 respectively, this puts the 1980s GRE population at 117 and 18.
[UPDATE July 25, 2024: A commenter suggested that the strangely high standard deviation of the GRE takers was inflated by the uneven verbal scores of foreign test takers. I thus re-did the analysis using the math SAT and this time I got a slightly lower mean IQ (116) but oddly an even bigger SD (19). ]
In the mid 20th century, the college board became curious about what the distribution of SAT scores would be if ALL American 17-year-olds took the SAT, not just the college bound elite. One reason for this curiosity was the average score of people who actually took the SAT started falling in the 1960s, especially the verbal scores, so people wanted to know whether this was simply because less elite kids were applying to college, or if teens in general were being dumbed down (see chart from Herrnstein & Murray, 1994; page 425):
This is discussed in the book The Bell Curve:
What they found was that the decline was just an artifact of the SAT population becoming more inclusive. When you look at nationally representative samples, not only was there no decline, but there was actually a very small Flynn effect.
I was especially interested in seeing these national norms because the SAT has long been considered a good proxy for IQ, but unlike IQ tests which are normed to have a mean and standard deviation of 100 and 15 in the general U.S. population, the verbal and math subscales of the pre-1995 SAT were both normed to have a mean and SD of 500 and 100 respectively and with respect to the 1940s SAT taking population (not the general U.S. population). The chart above tells us how the average U.S. 17-year-old (IQ 100) would have scored on the SAT from 1950s to the 1980s, but to fill in the rest of the IQ distribution, we need to know the standard deviations.
Thanks to Charles Murray, I was able to find the SDs for the 1980s and I had already found the SDs for the 1970s.
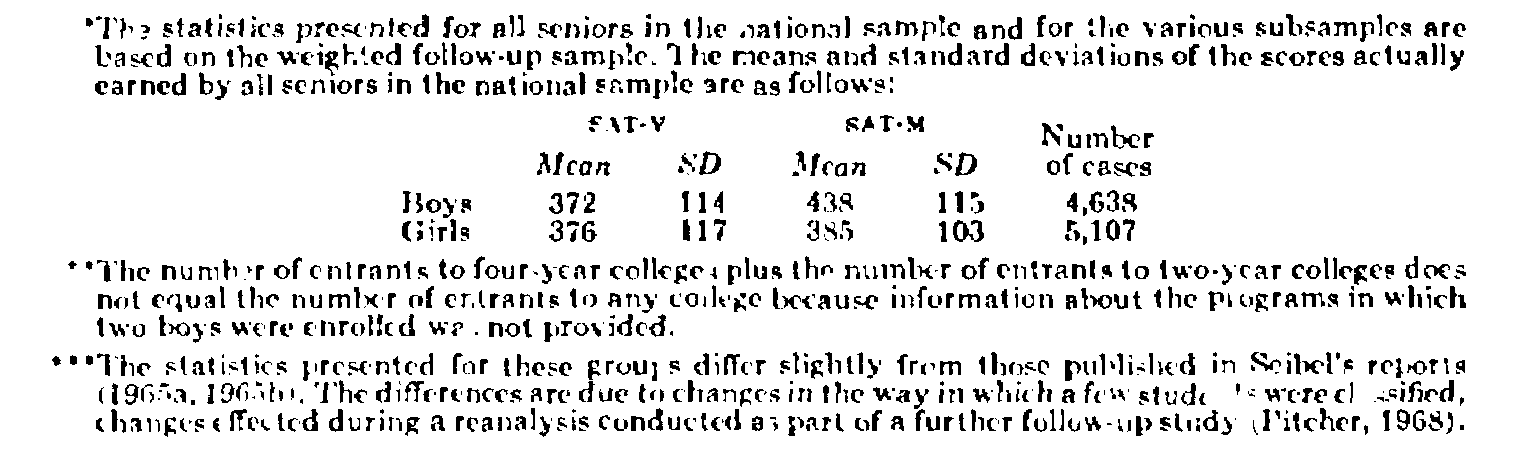
What about the 1960s? I recently discovered this data from the 1960 norming study:
Unfortunately the data is stratified by sex (if they tried that today they’d need categories for non-binary, gender fluid, two spirit). Well to determine the mean of the entire cohort, we take the weighted average (52% female) so verbal mean = 0.52(376) + 0.48(372) = 374. Math mean = 0.52(385) + 0.48(438) = 410.
These figures perfectly match the 1960 figures from The Bell Curve book which I showed at the top of this article so I must have done something right!
Now combining the SDs of men and women is much more difficult (even chat GPT can’t do it!). You can’t just average them because the size of the combined SD is not just a function of the two SDs, but how far apart the two means are. Of course if we assume the male, female, and sex-combined distributions are all perfectly Gaussian it’s kind of easy to estimate, but estimating is very different from actually calculating (and when men and women are too far apart, it’s probably impossible for all three distributions to be Gaussian.
To determine the sex-combined SD we must first determine the Sum of Squares:
Sum of Squares = female n*(female sd^2 + female mean^2) + male n*(male sd^2 + male mean^2)
And then:
sex combined standard deviation is SQRT(Sum of Squares / sex combined N – sex combined mean^2)
And so for 1960, the sex-combined mean and SD for verbal and math respectively were 374; 116 and 410; 114 respectively.
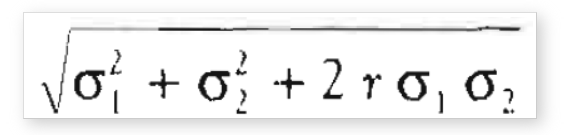
To determine the sex-combined composite mean we just add the verbal + math mean = 784, and assuming the 0.67 correlation between verbal and math and the below formula (Herrnstein & Murray, 1994, page 779), the composite SD was 210.
Cro-magnons were the first truly human Europeans and have long been romanticized as the first truly modern humans, in part because of a Euro-centric bias, but also because they’re the people most associated with the Upper Paleolithic revolution and the replacement of the Neanderthals who had held our ancestors captive in Africa for hundreds of thousands of years.
They had wonderful lives, wandering through the forests of Europe as the seasons changed from summer to snowy winters, sleeping under the stars, exploring a vast uncharted terrain with a child-like awe of the unknown and rich mythology to explain it, vastly out-competing their only rivals the Neanderthals for food and shelter, and hunting so much mega fauna that they reached their full genetic potential for height and brain size, unlike the stunted malnourished people who would follow them once agriculture was invented. These were some of the happiest people to have ever lived and they did so in a true Garden of Eden, before tempted by the metaphoric apple into the “sin” that was agriculture. A “sin” we would pay dearly for.
But how intelligent were they? This is a tricky question because based on brain size, they appear a bit more intelligent than Europeans today, but based on polygenic education scores, they appear substantially less intelligent.
Brain size suggests Cro-Magnons had an IQ of 104
Over the 20th century, brain size, IQ and height in the developed World has increased thanks to advances in nutrition and reduction in disease allowing us to recover the genetic potential not realized since the Upper Paleolithic, before agriculture had stunted us (Lynn, 1990). Despite brain size in 21st century America reaching an impressive 1418 cm3, (Pumpkin Person, 2018) it’s still less than it was 40,000 years ago, when brain size peaked (mostly in Europe) at about 1487 cm3 (after correcting for preservation bias). So it seems the remaining 69 cm3, shortfall (0.76 SD) is a genetic loss.
But why did genetic potential for brain size decrease 0.76 SD? Perhaps in part because genetic height in Europe decreased 0.5 SD (Piffer & Kirkegaard, 2024) and polygenic height scores correlate 0.64 with height, and height correlates 0.4 with cranial capacity (Rushton, 1992), then this fact alone might explain (0.5 SD)(0.64)(0.4) = 0.13 SD of the brain size decrease, leaving 0.63 SD (57 cm3) not explained.
Perhaps the remaining shrinkage can be explained by a genetic drop in muscle mass that paralleled the drop in genetic height, but until ancient DNA studies explore SNPs associated with lean body mass, this remains speculation.
Given the 0.4 correlation between IQ and brain size (Jensen 1998)(Gignac & Bates, 2017), this would predict an IQ loss 0.4(0.63 SD) = 0.25 SD or 4 IQ points since the Upper Paleolithic, suggesting Cro-Magnon would have scored an impressive IQ 104 if raised in today’s America!
Genetic education predicts Cro-Magnon had an IQ of 89
Although brain size may have decreased in Europe by as much as 0.63 SD (after adjusting for body size), polygenic education scores (EA3 PGS) seem to have increased from what looks like -1.63 in Upper Paleolithic Europe type areas, to what looks like about -0.2 in Medieval England to about +0.2 in contemporary England (Piffer & Kirkegaard, 2024) for a total increase of about 1.83 SD since the Upper Paleolithic. Given a correlation of 0.4 between IQ and polygenic education scores (Pumpkin Person, 2024), this suggests a gain of 0.4(1.83 SD) = 0.73 SD since the Upper Paleolithic (11 IQ points), suggesting Cro-Magnon would have scored IQ 89 if raised in today’s America.
Indeed when I recently asked Peter Frost what their IQs would be if reared in today’s America, he guessed “high 80s”:
Combining brain size with genetic education predicts Cro-Magon had an IQ of 93
If brain size predicts Cro-Magnons have an IQ of 104 (if raised in today’s America) and genetic education level predicts an IQ of 89, and there’s no a priori reason to think one prediction is more valid than the other, then the only reasonable solution is to predict their IQs based on both variables.
The multiple regression equation predicting IQ from brain size and genetic education is:
Phenotypic IQ gap = 0.37(phenotypic brain size gap) + 0.37(genetic education gap) (Pumpkin Person, 2024).
When this formula was tested on the 15 point black-white IQ gap, it accounted for an incredible 13 of the 15 points! (Pumpkin Person, 2024).
Now applying it on the gap between today’s U.S. whites and Cro-Magnon man:
Phenotypic IQ gap = 0.37(+0.63 SD) + 0.37(-1.83 SD)
Phenotypic IQ gap = +0.23 SD – 0.68 SD
Phenotypic IQ gap = -0.45 SD
0.45 SD = 7 IQ points and is equivalent in SD units to a one inch increase in within sex height over 40,000 years. Kind of trivial. On a scale where today’s U.S. whites scores 100, Cro-Magnon would have scored IQ 93, consistent with the sophistication of their drawings; when I objectively scored these on the draw-a-man IQ test, they clocked in at IQ 90, though the sample size was tiny (n = 2).
Although some evidence suggests adaptive evolution increased ten thousand percent in the last 40,000 years (Hawks et al, 2007). Europe only gaining 7 IQ points in 40,000 years suggests evolution more or less ended in the stone age, consistent with the punctuated equilibrium model. This is consistent with the emergence of brain genes peaking 55,000 years ago (Libedinsky et al, 2023).
What happened 40,000 or 50,000 years ago was the last major change in the genotype. At least the last major biological change. Evolution continues, but the evolution that’s involved in making us capable of wielding this vast variety of cultures–that probably stopped around 40,000 or 50,000 years ago and there’s been no essential change since.
There has been no biological change in humans in 40,000 or 50,000 years. Everything we call culture and civilization we’ve built with the same body and brain.
One of the great mysteries of human evolution is why after four million years of brains getting bigger in the hominin line leading to humans, did they suddenly start to shrink sometime after modern humans colonized the World and replaced all rival homo species. While Lynn (1990) attributes this to malnutrition and disease caused by agriculture, others have argued it was a genetic change.
However Peter Frost argues that it might (at least in part) be a statistical artifact:
Perhaps smaller skulls are more likely to decompose faster. The skulls we unearth would therefore be a biased sample, and this bias toward preservation of larger skulls would gradually increase for skulls that have been in the ground longer.
The problem of “preservation bias” has already been noted with respect to female and infant remains
This makes perfect sense but how big is the effect and is there anyway to adjust for it? Frost points us to a paper by Walker et al. (1988) that describes a California cemetery for the mission’s Indian neophytes who died circa 1831. Although the mission records showed that 53% of the buried people were female, the skeletal record showed only 50% were. The inference to be drawn from this is that because females are smaller, they decompose faster.
Now imagine if we tried to estimate the average cranial capacity of the mission Indians from the skeletal record. Considering men have brains about 12% bigger than women do, such a decrease in the percentage of women alone would increase the mean cranial capacity of the entire sample by 0.34% in just the 157 years after death that the data was published. Assuming the process is linear, that leads to a 87% increase in 40,000 years. So instead of Cro-Maagnons having brains of 1498 cm3(80 cm3 bigger than the average American today), they’d have brains that averaged 1498 cm3/1.86 = 805 cm3
A more reasonable hypothesis is that instead of preservation bias inflating brain size estimates by 0.34% per 157 years, it inflates it by 0.34% per the natural logarithm of 157 years, so 5.06 log years. And if Cro-Magnons lived around 40,000 years ago, or 10.6 log years ago, this would make the 1498 cm3 brain size estimate for Cro Magnon 0.71% inflated, and thus the true value 1498 cm3/1.0071 = 1487 cm3. One should note that weighting the samples by sex will not entirely solve this problem because sex is simply being used here as a proxy for big vs small brains and for most skulls, the sex is probably not known, they just assume the bigger skulls are male.
The U.S. black white IQ gap has been about 1 standard deviation (σ) since WWI (Jensen 1998, Pumpkin Person 2016). How much of this can be explained by biology?
Well we know the brain size gap is about 1.08 σ (at least as of 1980) (Pumpkin Person 2024)
The gap in polygenic education scores between U.S. whites and Nigerians is 1.6 σ (Piffer, June 4, 2020), however because U.S. blacks are about a quarter white genetically (Bryc et al. 2015), we can arguably reduce this by a quarter to 1.2 σ.
In other words, the U.S. black-white gap in brain size, polygenic education level, and IQ are all about 1 σ.
Predicting the black-white IQ gap from brain size & genetic education
Polygenic education scores now explain about 8.7% of the variation in Peabody verbal scores (Okbay et al 2022) suggesting a correlation of 0.29 (the square root of 8.7%), but since vocabulary tests “only” correlate 0.74 with general intelligence ( McCrea & Robinson, 2011) we can arguably divide this correlation by 0.74 and estimate that polygenic education scores (at least the best ones), much like brain size, correlate about 0.4 with IQ.
So knowing both phenotypic brain size and genetic education both correlate about 0.4 with phenotypic IQ, how well do these variables predict the U.S. black-white IQ gap?
Well assuming these two variables are independent, aside from their shared correlation with IQ, we’d expect them to correlate about 0.16 with each other (the product of their shared 0.4 correlation with IQ) and thus each would independently correlate 0.37 with IQ.
In other words:
Phenotypic IQ gap = 0.37(phenotypic brain size gap) + 0.37(genetic education gap)
Phenotypic IQ gap = 0.37(1.08 σ ) + 0.37(1.2 σ)
Phenotypic IQ gap = 0.4σ + 0.44σ
Phenotypic IQ gap = 0.84 σ
In other words, about 84%, or 13 of the 15 point U.S. black-white IQ gap can be explained by known biology. Of course that doesn’t prove it’s 84% genetic as the phenotypic brain size gap could be at least partly environmental in origin.
Jensen predicted 80% of the variation in adult IQ was explained by genes and the remaining 20% was explained by biological environment. Jensen’s default hypothesis thus predicts √ 80% = 89% of the 15 point gap (13 points) will ultimately be explained by DNA, and the remaining 2 points will probably be explained by racial differences in prenatal environment.
The single best study of U.S. race and brain size ever done was by Ho et al (1980). They found that at age 25, the average sex-combined brain weight of white Americans (at autopsy) was 1455 g and the average brain weight of black Americans was 1333 g. I suspect the brain weights of both races have since increased thanks to the nutrition that causes the Flynn effect (Lynn 1990)(Figure taken from Jensen (1988), though even in 1980, the white male brain weight at 25 was absolutely colossal:
Unfortunately Ho et al only reported standard deviations for the entire sample and not specific ones for different age groups. However a study of South African black brain weights found that at age 21 to 30, the SD is 122 g for men and 103 g for women for a within sex average of 113 g (Govender et al, 2018)
If we assume a similar SD within U.S. races, then the sex combined age 25 black-white brain weight gap gives a within sex brain weight gap of 1.08 SD which is identical to the 1 SD black-white IQ gap observed since WWI.
Of course that’s not to say that the black-white IQ gap is entirely caused by the black-white brain size gap. The correlation between brain size and IQ is “only” about 0.4 (Jensen 1998)(Gignac & Bates, 2017) so only about 40% of the gap might be caused by brain size and that’s assuming the correlation is entirely causal.
However individual level correlations can more than double at the group level because individual sources of error cancel out. For example, Rushton (2009) found brain size correlated 0.91 with IQ across 10 population groups.
We should have seen AI coming. We know from multiple regression that correlations can be used to predict anything from how much you weigh to how much it will snow in December. If correlations can predict that, they can predict anything, it’s just a matter of getting the data and intelligence could arguably be defined as the ability to predict.
However just because AI can pass the bar exam, hit the ceiling on the verbal sections of the WAIS-IV, write plays in the style of Shakespeare, compose music that resembles Mozart and create drawings in the style of Picasso, does not necessarily mean it’s more intelligent than the average man. It achieves these great feats by processing the entire corpus of civilization. If it looks taller than us, it’s because it’s standing on the shoulders of our giants.
The only way to know if AI is truly more intelligent than people (or even as intelligent) is to personify it. Put it in the cranium of a humanoid robot that is indistinguishable from a human in the way it looks, moves, feels and sounds. Have it perceive the World through artificial eyes, ears, and touch. And then give it just one goal: get as much money as possible.
At first people would assume the AI was a mental retardate because it would behave awkwardly in its humanoid body, but it would quickly learn that acting human was financially incentivized. Would this AA eventually become the World’s first trillionaire (IQ 150+) or would it just languish in jail because it was caught stealing (IQ 90)? Of course luck is a huge factor in wealth so we’d might want to run the experiment on many such robots and observe the median outcome.
Another thought experiment would be if we get all humans (or at least all the smart ones) to leave the Earth and replace them with millions of AI humanoid robots that had only one goal: Get to to the moon. I agree with Stephen Jay Gould and RIchard Klein that the modern human mind (average IQ around 90) more or less evolved about 40,000 years ago (the age of the first true cave art), so it took humans about 40,000 years ago to go from the stone age to the space age (and most of us weren’t even trying).
How many years would it take millions of humanoid robots to achieve the same shared goal. And how would he program even “incentive” them to do so? Perhaps they’d get a “pass” for every step closer to the moon like jumping in the air or climbing a mountain, and get a fail for every step further from the moon like falling in a hole.
Given 40,000 years, would their shared neural network modify its algorithm to the point where it reached the moon? If they did it in half the time humans took, we could argue they’re roughly twice as smart as humans (IQ 180, and yes IQ can be multiplied) or would it take them over 80,000 years, implying an IQ below 45? I realize these are not perfect apples to apples comparisons since unlike AI, humans had other problems to solve like getting food and reproducing and the subset of humans who reached the moon evolved IQs somewhat above the 90s, but these points roughly cancel each other out.
So this recent interview of Ann Coulter by Vivek Ramaswamy got a lot of attention because she straight-up tells him to his face that despite admiring his intelligence and politics, she can’t vote for him because he’s an Indian. I always thought it was incredibly naive of Ramaswamy to think he could transcend race and succeed in a Republican primary (assuming it wasn’t just a publicity stunt), perhaps thinking Indians would face less racism than blacks do.
But I applaud Coulter for her honesty. Usually white conservatives can never admit they oppose a minority because of race, there always has to be six or seven other reasons, but Coulter to her credit has the courage, integrity and self-awareness to not play those games. Because as much as Ramaswamy may share her politics in theory, he may always regress to his racial mean in practice.
Unfortunately, as the politics becomes more complex, Coulter’s tribal instincts can no longer compensate for her sub-genius IQ. She complains about all the Muslims at the university protests and to her credit, she has the math chops to understand that even if there are more native born whites, there are proportionately more immigrants or children there of. This in Coulter’s eyes, is proof that the immigrants are anti-American. That would only be true if America supported Bibi out of strategic U.S. interests and not because Biden and Congress are bought and paid for by Zionist billionaires. She’s not even sophisticated enough to realize that? Doesn’t she read Steve Sailer? Has she never heard of Mearsheimer and Walt? And Ramaswamy is presumably too politically ambitious to touch this Third Rail.
And then when it comes to why there are so many immigrants, Ramaswamy has long argued it’s because the Democrats want more liberal voters but Coulter thinks it’s because the rich want cheap labor or because they just hate America.
So when it comes to the two main policies of the U.S. establishment (what Steve Sailer calls invade the world/invite the World) both Coulter and Ramaswamy are either too dumb or too scared to articulate the role of Ashkenazi elites. Or if you want to evade the JQ, at least go with the Mug of Pee/Tucker Carlson argument that racial diversity serves as a distraction from economic inequality and makes it easier for elites to divide and conquer the masses.
A few commenters have mocked me for supposedly worshiping the rich when in reality I just believe in Darwinism, but according to Coulter, this, along with the first two amendments, are American values and another reason why she wont vote for Ramaswamy even though he also appears to worship the rich and is almost a billionaire himself. But he is Indian and Indians view the poor as closer to God according to Coulter.
Coulter says she can call Ramaswamy articulate because he’s not an American black. I can’t tell whether she’s once again calling him non-American or just non-black or both. If he were the son of Nigerian immigrants would she have said the same thing? It’s a fascinating question because black skinned Brahmens have long been considered not only Caucasoid, but 100% pure Aryans, but then David Reich got jealous and did a study proving Indians are a hybrid of Middle Eastern and Andaman Island adjacent people. Andaman Islanders are morphologically Negroid in my opinion, however the subset that Indians are descended from may have evolved into the first Caucasoids before mixing with their Middle Eastern descendents.
Also of interest, Coulter strongly opposes reparations for black Americans. Not only does she deny they built America, but argues that slavery held America back because it disincentived innovation and her evidence of this was the relative poverty of the U.S. South compared to the non-slave owning North.
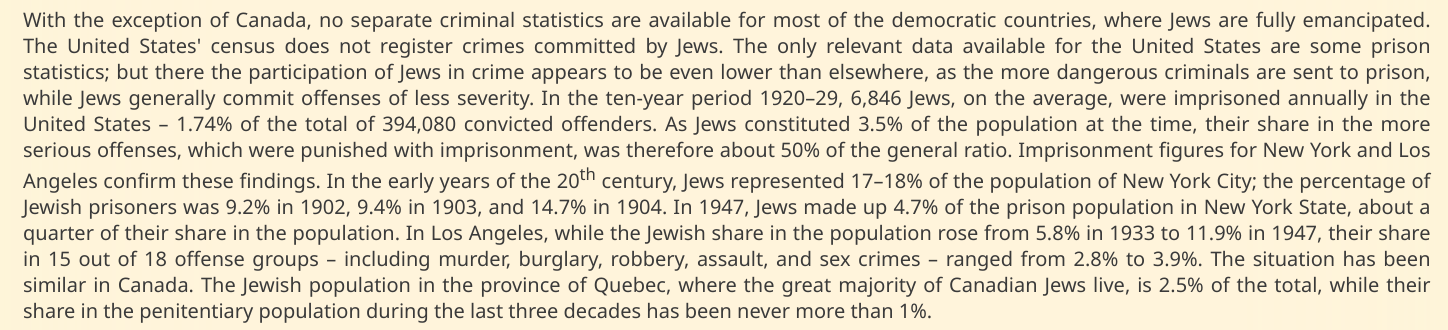
For years it’s been known that Jews have some of the lowest crime rates of any ethnic or racial group. Jewishvirtuallibrary.org reports:
However it’s well known that crime decreases as a function of socio-economic status and IQ (especially verbal IQ) and given that Jews in Western countries rank high on both of these variables, it might be argued that their apparent law abidingness is just a function of these other traits.
Thus when I stumbled upon a list of extremely rich Americans who had trouble with the law, I was intrigued because such a list, by definition, largely controls for economic variation. In their book ALL THE MONEY IN THE WORLD, Peter Bernstein and Annalyn Swan studied everyone who has ever appeared on Forbes magazine’s authoritative list of the 400 richest Americans from 1982 to 2007 and find at least 16 got in trouble with the law. Upon reading the list of names, what jumped out at me was that just over half of the 16, (56%) were Jewish.
Of course this doesn’t prove all that much because it’s long been known that Jews are hugely overrepresented among the Forbes 400, with some sources claiming they’re about a third of the list, however it’s interesting that among the tiny subset who had trouble with the law, their percentage increases from a third to over half. Of course given the small sample size, this result is probably not statistically significant.
Nonetheless if merely controlling for wealth can cause their crime rate to go from low to not low, I wonder what controlling for both wealth and verbal IQ would do.
Preliminary evidence suggests that the aliens test has little, if any, correlation with IQ, at least among readers of this blog. The most likely reason for this is that the test so overloaded working memory that people were essentially just guessing.
As a result I have substantially revised the test in the hopes of reducing the demands on working memory and attention to detail, since the point of the test was to get at higher level, more conceptual ability.
I have reduced the number of aliens you have to compare from 12 to nine and also reduced the number of ways people can be tricked into miscategorizing the aliens.
Because the point of this test is not just to measure your intelligence, but more importantly, to show that there is a correct way to organize the natural world, whether we’re dividing categories as broad as plants and animals or as narrow as racial groups.
[Take the new version of the aliens test here. You can register with a fake name; email optional]