
The below chart shows how six diverse populations averaged on (1) polygenic education scores, (2) brain size (3) environmental quality (4) IQ tests and (5) Guestimated IQ if everyone lived in First World. The last column was guestimated by adding 13 IQ points to people reared in the Third World type environments (Lynn 2006) and half that to people living in 2nd World type environments though these classifications are admittedly subjective. For example non-white Caucasoids live in some oil rich Arab countries but also nutritionally challenged South Asia. China has a lot of malnourished people, but those in Lynn’s samples were likely from First World type cities. Native Americans often live in the First World, but often in reservations that lack clean drinking water.
The 13 point correction was based on Lynn’s 2006 analysis that sub-Saharan environments depress IQ by 13 points. Brain size was not corrected for environment because the cranial capacities Lynn reported were from people who likely died before Western countries began really outdistancing the global South. Even in Western countries, they should be considered 3rd World brain size because they were from before the post-WWII living standards yet long after the excellent nutrition of the Paleolithic when brain size was inflated to First World levels.
| education PGS (Piffer 2018) | Brain size (Lynn 2006) | Guestimated environment level of Lynn’s IQ samples | IQ estimates derived Lynn (2006) | Guestimated IQ if everyone fully lived in First World | |
| Oceania | -2.1 | 1225 | 3rd Worldish | 62 | 75 |
| Middle East & South Asia | -0.4 | 1293 | 2nd World | 84 | 91 |
| Europe | 0.8 | 1369 | 1st World | 99 | 99 |
| East Asia | 1.2 | 1416 | 1st World | 105 | 105 |
| America | -0.75 | 1366 | 2nd Worldish | 86 | 93 |
| Africa | -0.2 | 1280 | 3rd World | 67 | 80 |
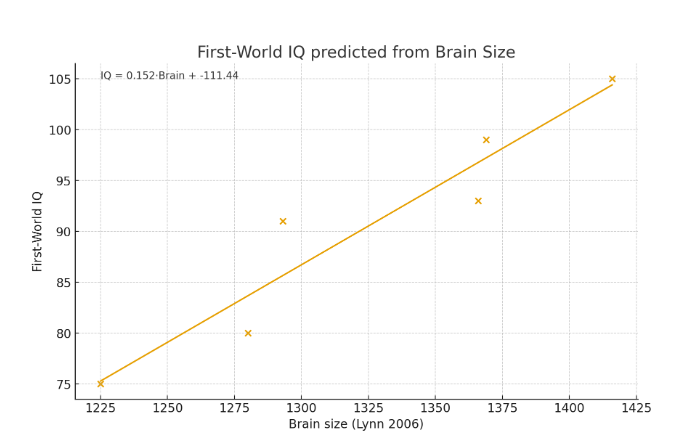
The below chart shows the correlation of both brain size and education PGS with population IQ, both when IQ is tested in their home countries and then again if tested with benefit of First World environment. Note these are (group-level) ecological correlations (Jensen, 1998), for individuals these correlations would be less than half as strong.
| brain size | education PGS | |
| raw population IQ | 0.90 | 0.58 |
| Guestimated population IQ if everyone lived in First World | 0.95 | 0.85 |
In both cases it seems brain size better predicts the IQ of a people than PGS does. When we compare the two scatter plots we see the line of best fits the data points better when brain size is the predictor:

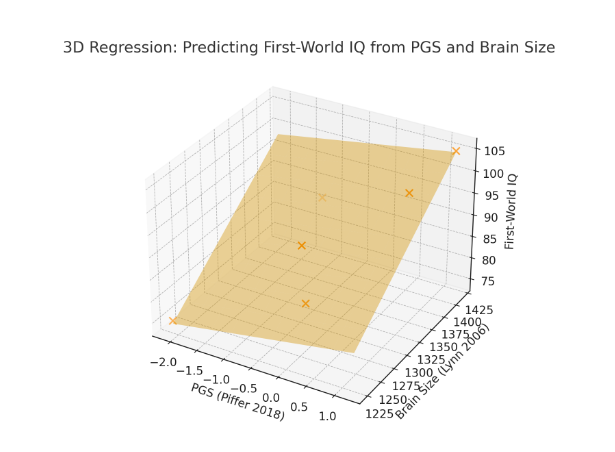
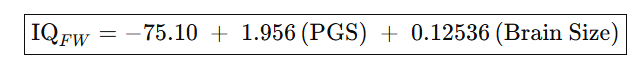
Until Davide Piffer’s gets access to more full coverage genomes and includes a larger sample of IQ related genes, it’s wise to supplement his PGS scores with brain size data, and perhaps the best predictor of a population’s potential IQ is a combination of both (r = 0.96) but we’ll need a lot more than just six populations to test this conclusively:

If PGS is a worse predictor than brain size then we must assume that the PGS has something wrong with it. In that it is making spurious correlations based on genes not attached to IQ and at all.
You need way more data to say when they become realistic predictors.
By this I mean you need sample of the native populations not just great Britain to reference those populations in IQ terms.
Since Whole genome sequences has reached $100 we may get that data.
But it still will not tell you much on the individual level?
When I was a kid I had thyroid problems and they gave me growth hormones. (pituitary gland is the source of growth hormones not thyroid?) I believe I was iodine deficient but I do not think the doctor I had was that good at helping me. Most people do not have the nutrients they need which messes up gene correlations as well.
Vitamin C-complex as example helps skin heal itself – rashes can get fixed without drugs most times because its just scurvy that’s the problem. Most diseases are caused by deficiencies where med companies get money for drugs that are not nutrients but synthetic.
120 = -75.1 + 1.956(6.717) + 0.12536(1451.5)
estimated PGS is 0.44
I calculated my brain mass (1/50) * 160 = 3.2 pounds
But I do not know for certain these numbers
PGS is not on the individual level but the group level
This aassumes that Lynn isn’t a cherry-picking charlatan, that pop strat isn’t a thing and that genes are actually causal for IQ. All 3 claims are dubious.
https://www.statnews.com/2024/06/20/richard-lynn-racist-research-articles-journals-retractions/
https://osf.io/preprints/psyarxiv/26vfb_v1
https://www.researchgate.net/publication/337658592_Why_genome-wide_associations_with_cognitive_ability_measures_are_probably_spurious
https://link.springer.com/article/10.15252/embr.201744140
What are the assumptions of hereditarianism? How do they not fall a part under scrutiny?
https://notpoliticallycorrect.me/2025/11/30/the-conceptual-impossibility-of-hereditarian-intelligence/
Lynn only sampled 68 people from north America? resulting in an IQ score of 91?
That is stupid.
These were not even modern IQ tests but tests on student report cards.
I googled and googled but could not find any data sets of more than 100 people on modern IQ tests.
No aggregation at all of the samples taken in North America.
That means all samples could be random and unreliable. and they are!
IQ scores can go up or down 20 points each time the person is tested
There are over a billion people in Africa so you cannot get accurate IQ scores from 600 samples spread out. That is bullshit.
192 black people were sampled for the WAIS 4 of 2,200 people.
No way that represents the total of 25 million black people in America
The bullshit keeps pilling up.
Where are the real statistics?
There are none.
you do not need to subvert words to figure it out
you do not need dishonest conceptual schemes
the methodology is bad
the math is wrong
that data is not enough and has not been collected and organized properly
I actually 100% agree with us.
Very few HPD talking points need to be refuted with conceptual arguments.
Most of the data is just built on shoddy methodology can be refuted as such
Great comment. Lynn just collated studies. The “Somalian IQ” were on Somalis in a Kenyan refugee camp (among other blunders, eg averaging out surrounding countries to “estimate” the IQ of a country with no data, using the IQ of mentally retarded Spanish school children for Equitorial Guinea, among other blunders that Rebecca Sear and Jelte Wicherts pointed out). Lynn is a cherry-picking charlatan.
There is a mechanism for choice making.
This had to have come from out ancestors because humans did not exist 1 billion years ago.
Lynn’s studies are all essentially pseudoscience with no real validity.
Thats nice. Have you ever noticed theyre are the ONLY studies of africans.
Wonder why…..
Hint: heh heh Heh (rubs hands)
When looking at the variance of IQ
twin studies show 70-80% is genetic but when you remove the cofounding genes this becomes 20-30% meaning that the environment is doing the heavy lifting of creating IQ? No(see bottom paragraphs)
So you look at the rare variants of the twins in the family that cancel out what the cofounds are to get 30% of the effects by genes.
so 70% of intelligence is environmental?
If you look at ADHD genes exist but the GWAS studies removing the cofounds says 20% is genetics but that is only because cofounds is in the group to group comparison and in the family those genes get removed in the analysis for the same reasons.
its a ratio
ADHD genes in family – genes in pollution / rare ADHD genes in the kid – rare gens in the population
in total the ADHD genes are there but we cannot find them in GWAS
same for intelligence
variance in intelligence can only be explained at 30% by genes
this does not mean genes are not causing intelligence but that variance of what we know can be explained – that’s to say:
the role genes play is 30% explained
not that 30% of intelligence is caused by genes
same for ADHD
80% of the causes we know about is known as the environment effects.
20% of the genetic causes are explained by genes.
environment is not 80% the cause but 80% of the explaination of variance.
(environment explains 80% of variance and genes explains 20% of variance) is not the same as (variance is 100% explained with genes and environment)
Variance is divided into explained and unexplained:
30% of IQ is explained by both genes and environment
But that means you divide 30% into (70%) and (30%)
(21% variance is explained by genes, 9% by environment) = explained variance
70% unexplained variance = cofounding genes and non cofounding genes mixed together + environment
its why ADHD can be mostly genetic but not explained by GWAS
GWAS mixes the cofounds and causal genes together
making it impossible to find most of them without other math functions
There are ways to find causal genes but not by GWAS
Right. GWAS doesn’t (and can’t) find causal genes, they’re just correlations (which are due to population stratification). The confounding of twin studies leads to the disconnect between SNP h2 and twin h2. They’re looking for things that just aren’t there, and there are numerous explanations for the correlations that have nothing to do with genetic causation (see eg the Richardson references above).
Repent sinner. Follow the path of Christ.
Stop living in sin dumbass.
Right, just say “Richard Lynn is a cherry-picking charlatan and numerous authors have shown this.”
Holy shit Nick Fuentes got cooked.
My words:
This study was on over a million people in one data set.
Others were used to cross validate.
It accounts for cofounding effects and shows the causal relationships between 6 cognitive traits where the mechanisms of cellular biology is active in making cell health and high functioning. Stratification accounted for.
The gene variants found significantly enhance cellular functions in the brain and can bee seen in the brain architecture where they are expressed by the percentages of change seen in brain scans.
Genes in other studies were found along with new genes that enhance cognition.
From the article:
–
Multivariate genome-wide analysis reveals shared genetic architecture and brain structural correlates of human cognitive abilities
https://www.nature.com/articles/s41598-025-25509-z?fromPaywallRec=false
First, we systematically evaluated associations between cognitive ability common factors and 50,033 human phenotypes in the IEU database, covering 80–90% of currently known common human diseases, biomarkers, drug responses, and lifestyle factors
–
Third, the latent factor captures cross-trait genetic architecture-genetic variants affecting multiple cognitive domains through shared biological mechanisms-rather than intelligence-specific pathways. Critically, the remaining five phenotypes contribute unique genetic variance (specific factor loadings: Processing Speed 0.398, Educational Attainment 0.718, Executive Function 0.228, Memory Performance 0.551, Reaction Time 0.923), indicating that mvCognitive represents a broader cognitive construct than intelligence alone. The multivariate framework identifies pleiotropic variants whose effects are amplified when analyzed across correlated phenotypes, enabling detection of shared mechanisms missed by single-trait analyses.
–
The newly identified cognitive ability lead SNPs were primarily enriched in pathways related to neurotransmitter metabolism, neurodevelopment, and synaptic plasticity, while also involving metabolic regulation and immune system modulation.
–
Further validation analyses showed: In Cahoy brain cell data, Neuron cell type was significantly enriched ….
… although they did not reach significance thresholds after multiple comparison correction. These consistent cross-dataset results strongly support the conclusion that cognitive abilities primarily function through brain cell-specific mechanisms
–
This study, through multivariate genomic structural equation modeling based on six cognitive-related phenotypes, identified 3,842 genome-wide significant loci, including 275 novel loci, contributing to a more comprehensive genetic map of cognitive abilities.
–
From 3,842 genetic loci to 33 candidate genes, from 71.6% brain imaging associations to 857 health-related phenotypes, we developed a cognitive biological framework spanning molecular, cellular, tissue, organ, and individual levels.
? Those results are based on the UKBB, and Richardson explained in his 2017/2019 paper how there is genetic stratification in the UK and how that would lead to correlations with “cognitive traits.” Here’s the argument:
All persistent between-group differences in cognitive test performance that are caused by ongoing social stratification will necessarily reflect the pattern of social stratification. The observed between-group differences in cognitive test performance in stratified dofieits (such as those in the UKBB) are caused by ongoing social stratification (which both maintains genetic stratification and directly produces cognitive differentiation). So the observed between-group differences in cognitive test performance necessarily reflect the pattern of prior and ongoing social stratification.
Social stratification -> persistent genetic stratification -> direct environmental effects on cognition -> aligned cognitive differences
you do not understand cell biology
the cellular mechanisms of which were in the study
has nothing to do with stratification because that was accounted for it
they are not even talking about portability but just what they found in the British population
when cells work better intelligence increases
There is nothing conceptually wrong with the paper I posted. All cellular mechanisms show that they can increase or decrease intelligence by making the brain healthier or weaker.
You probably did not read it.
Because I do not see how you can show it is wrong in what they did.
Just quote where they did something wrong?
“they are not even talking about portability but just what they found in the British population”
Yea, and the UKBB was used. Did you understand the argument? Where’s the error?
the error is you cannot find an error in the paper I posted
instead you made shit up again that doesn’t disprove the paper
Are you slow? Does the study use the UKBB? Yes or no?
Christ is King
I anticipate rr bullshitting again.
If people will not accept cellular mechanisms as more than correlations then that means you cannot accept anything as other than correlations.
All science is stupid and doesn’t work then?
All we know in medicine must be abandoned as well.
Because healthy brains = better intelligence
The only reason to dismiss this is to say science is evil white man stuff used for oppression.
Which is stupid.
Cultural Marxism only cares about the power struggle thus anything that keeps the oppressed group down must be destroyed.
That can be anything that the Marxists wants it to be.
And is why people should ignore them.
If science woks then it works and Capitalism depends on it for the rights of the citizens under the constitution.
Marxism is all about violence terrorist actions against rich and middle class people because “I did not do well in school so science is dumb”.
You can, with a mechanism. But the mind isn’t mechanistic.
there is a connection between intelligence and physicality if you deny it or not, taker drugs too much and you decrease intelligence – there is a connection!
if healthy brains are not more intelligence then we cannot know why intelligence exists.
molecular biology as to why intelligence exists is a perfectly legitimate way to know how intelligence exists.
just because you define intelligence as not having to do with the biological properties of the brain does not in any way show there is not relationship between them.
political views to discredit science are stupid because science works with or without your approval.
Here’s an exercise for you. Count how many arguments are in this article.
https://notpoliticallycorrect.me/2025/11/30/the-conceptual-impossibility-of-hereditarian-intelligence/
Trump lambasts ‘weak’ and ‘decaying’ Europe and hints at walking away from Ukraine | Donald Trump | The Guardian
Trump talks a lot of BS and scam artist crap and then every now and then he has these ‘moments of clarity’ of the kind alcos get amid the drunkenness.
And this one of them:
And Europe is … if you take a look at Paris, it’s a much different place. I loved Paris. It’s a much different place than it was. If you take a look at London, you have a mayor named Khan.
“He’s a horrible mayor. He’s an incompetent mayor, but he’s a horrible, vicious, disgusting mayor. I think he’s done a terrible job. London’s a different place. I love London. I love London. And I hate to see it happen. You know, my roots are in Europe, as you know.
“[In] Europe, they’re coming in from all parts of the world. Not just the Middle East, they’re coming in from the Congo, tremendous numbers of people coming from the Congo.
Trump should hold a rally in London and say the Congolese are eating the cats and dogs. I would take the day off work to go.
Again and again and again RaceRealist keeps asking about “arguments” as if that changes how the scientific process works and as if that changes how reality works.
His arguments have nothing to do with the paper I posted.
So he makes shit up because he cannot find anything wrong with it.
When you cannot disprove someone you make shit up.
Red Haring:
Definition: A false clue or misleading detail planted by an author to throw readers off the scent of the real culprit or solution.
again and again I say something relevant and he ignores it.
shows you he is not genuine with his arguments otherwise he could defend them by addressing the real questions I pose.
Such as how brain damage can decrease intelligence.
This means physicality is involved.
he says I do not understand necessary but not stufficient.
but then refused to acknowledge the connection
Why is there no connection between the physical and intelligence? Because Anime cannot understand intelligence is necessary for intelligence.
What the Fuck?
necessary connection means a necessary connection exists
its explicitly in the argument
but rehearing’s is all RaceRealist can do
he will ask instead where is the error in his deluded arguments
the error is he wont admit to the fact he does not understand what I say on purpose.
physicality having a necessary connection to intelligence -> means a necessary connection exists between intelligence and physicality
if A then B -> if B then A
If he understands the logic then he must be ignoring it on purpose.
why does he deny the implications of his own arguments?
because if he admits to the implications he is contradicting himself
therefore I am right
he will never say I am right
because he wants to remain deluded
He cuts everything I say into tiny pieces to remain willfully ignorant so he doesn’t have to understand the implications that destroy all his delusions.
Something is severely wrong with him.
“His arguments have nothing to do with the paper I posted.”
I guess I have to spell it out for you because you’re… Special…
The paper uses the UKBB. Richardson’s argument – which I’ve reconstructed – shows WHY the correlations arise, and you clearly have no response to it.
“All persistent between-group differences in cognitive test performance that are caused by ongoing social stratification will necessarily reflect the pattern of social stratification. The observed between-group differences in cognitive test performance in stratified dofieits (such as those in the UKBB) are caused by ongoing social stratification (which both maintains genetic stratification and directly produces cognitive differentiation). So the observed between-group differences in cognitive test performance necessarily reflect the pattern of prior and ongoing social stratification.
Social stratification -> persistent genetic stratification -> direct environmental effects on cognition -> aligned cognitive differences”
The rest of your comment is near incoherent, as usual.
molecular biology has a causal relationship to intelligence
you don’t care about that
rr describe a study that could prove genes cause IQ
Correct me if I’m wrong, RR. But RR’s criticism of the causal nature of genes is conceptual, not empirical.
I don’t think any study would satisfy him.
But it’s mot like causation is some metaphysical concept outside the range of science. I bet Richardson would have an answer
people also use conceptual arguments to “prove” creationism
empirically creationism is bunk
word games = sadness
I don’t think any study would satisfy him.
So you finally admit hes religious.
Good.
This is a big moment in the history of the blog.
Now I need you to admit you too are a religious hack.
“molecular biology has a causal relationship to intelligence
you don’t care about that”
“I’m not a reductionist/hereditarian!”
“rr describe a study that could prove genes cause IQ”
“I don’t think any study would satisfy him.”
This.
“people also use conceptual arguments to “prove” creationism
empirically creationism is bunk”
This isn’t the same as hereditarian claims. Hereditarianism needs certain conditions to hold and for certain things and assumptions they hold to be true.
“So you finally admit hes religious”
Empirical evidence is irrelevant to conceptual arguments.
https://notpoliticallycorrect.me/2023/03/28/empirical-evidence-is-irrelevant-to-conceptual-arguments/
dualism is a religious belief
you believe anything against it is racist
dualism is the same as creationism
my views on molecular biology are empirical validated and not racist
Your views are logically untenable.
“a prior cars do not exist” is untenable as are all your beliefs follow that same logic
my beliefs are empirically sound as they exist in reality
How is that an entailment of my beliefs?
RaceRealist be like:
I just saw trump did a speech asking why we dont get more immigrants from scandanavia. Only africa.
I think trump thinks his popularity his going down so now hes going ‘mask off’ and really throwing red meat to his core fans.
I think hes objectively right. But this is obviously sales talk. Although, honestly he really is a racist. It might be the one thing he actually believes, passionately. Like me.
For me, being a racist is sign of very high intelligence.
Its like when Chris said to the interviewer that low IQ people are religious, then the middle is atheist, then the higher levels are religious again.
I think it works like that with ‘racism’ or being ‘jew aware’
Chris is the only super high IQ theist or black critic I know of. I agree being Jew aware correlates with IQ but I lump that in with a larger correlation with a certain kind of leftišm.
More social reasoning issues. How many very high IQ people want to be cancelled if they talk about blacks in even a slightily negative way.
Chris is outside the system. So he can say it.
99% of very high IQ people in hedge funds, NASA, or whatever are going to have negative opinions on blacks unless theyre like anime.
There was even a nobel prize winner in genetics that got cancelled for saying blacks are dumb. And he said that based on his domain knowledge.
Stop pretending to be socially intelligent based on your speculation. The actual data shows IQ is positively correlated with antisemitism but negatively correlated with racism. Now maybe the racism correlation reverses at high levels or maybe it’s caused by lying but then why aren’t they lying about their views on Jews
Im a passionate racist.
“Whereof one cannot speak, thereof one must be silent”
This David Pfiffer guy getting his samples from refugee camps.
Just stay quiet. It makes the whole endeavour look bad.
No from published sources
That’s where “Somalia’s IQ” is from. That study is from a study of Somali refugees in a Kenyan refugee camp. Richard Lynn is a cherry-picking charlatan.
As an environmentalist you should agree blacks in Africa score much lower than blacks in the West because that shows environment matters.
To say that Lynn is a cherry-picking charlatan and to criticize how he came about his “national IQ” dataset doesn’t mean I don’t think environment matters. Pointing out his cherry-picking shows he’s a charlatan.
The only way for RaceRealist not to be dishonest is if he genuinely does not understand molecular biology connection to intelligence. For this to be true he must be a wordcel meaning his spatial intelligence is so low he is a moron in spatial ability i.e. lower than IQ 65 in spatial ability.
Like how my coworker could not understand what an atom was in 2013 and she was over 55 years old. The other guy who said he was IQ 85 understood what an atom was. My mom is IQ 75? and understands what an atom is. So the coworker must be below IQ 65 spatially not to understand atoms. Just like RaceRealist isn’t getting it, the way molecules work.
Without spatial ability all you can do is say: your wrong, over and over again with meaningless words / arguments / logics – without truly understanding how they fail to disprove things in a spatial manner.
This is why the replication crisis happened in psychology but not the hard sciences. STEM fields you must get things to work or not, not play with words. So that is why people like rr do not understand intelligences relationship to molecular biology. Conceptual schemes a priori fail when tested in the real world to disprove anything because all experiments that deal with reality must work or not based on hard evidence.
Those susceptible to propaganda based on words alone and no spatial intelligence are the people that fall for Marxism convinced it works in the real world when in fact all it does is make people into economic terrorists who are too mentally ill to understand why it does not work.
Spatial intelligence people are immune to word games, they see why Marxism fails time and time again.
It is very sad that rr has low spatial ability.
He truly things what he says means something.
Science marches on.
Dunno why you keep saying Marx is the reason RR is a moron. Marx would have agreed with you if he lived into the 21st century on the genetic element of intelligence.
RR’s ‘problem’ if you want to take him seriously, and not know hes in fact, just being a religious zealout…is that he doesn’t understand epistemology.
You would not prove/disprove heredity with a word game. You have to do it with empirics. He seems to think everything can be known/unknown with legal court cases. Its the wrong ‘knowing’ method.
Yes and Marx is wrong on economics
but people think they can create a utopia
so mentally ill people follow the propaganda
its by utilizing the fake stuff that more fake stuff gets added onto it.
such as science bad because it oppresses people
Marxism economics -> stupid shit -> science oppresses people
RR just is following the line
If Marx was smart he realize capitalism works and change his mind on it.
So far capitalism may last hundreds more years.
Eventual we could cure people of the need to try and subvert things by giving them technological abundance.
But you do not get it by “revolution”.
Ann Coulter said that the Seattle Autonomous Zone was run by mentally ill people – and she was right.
Because they lost the economic battle certain academic people want control people by brainwashing them with Marxism to destroy everything but that’s not going to happen. Only the mentally ill believe in Marxism Utopias.
“he doesn’t understand epistemology.”
Why do you say that?
I don’t think “science is bad because it oppresses people.” I think that of hereditarianism, it’s a racist ideology that can and has harmed people. “HBD/hereditarianism” is racism disguised as science.
https://notpoliticallycorrect.me/2024/02/10/racism-disguised-as-science-why-the-hbd-movement-is-racist/
RR, check it out:
https://x.com/RealChrisLangan/status/1999721214776836311
LOL.
Fucking wild that the “world’s smartest man” is scientifically illiterate.
Can you elaborate?
I mean, the post he made does not accurately reflect the study’s conclusion. That itself can be gleaned from simply reading his post and then the article he’s referencing.
grok said:
“19% is the upper bound of the uncertainty interval, not a measured or average amount in individuals or populations. No population or person was found to have exactly 19%—it’s the high end of what’s statistically plausible.
This applies specifically to certain West African groups in the study, not all Africans (Africa has immense genetic diversity, and signals are weaker or absent in many other groups, like East or Southern Africans).
Comparable to how non-Africans have 1–4% Neanderthal or Denisovan DNA, this is a small but detectable contribution from interbreeding tens of thousands of years ago (estimated ~43,000 years ago, with a wide range).
Well, not just that, the study shows that this is due to introgression. Basically, Africans had sex with Ergaster and then those hybrids had sex with African Homo sapiens. So on and so forth, until they were absorbed into our population.
Whereas Mr. “Smartest Man in the World” said that it’s evidence that modern Africans descend from a different set of archaic humans than do Eurasians.
So, he didn’t even accurately summarize the article he’s quoting.
He said: “Basically, it says that certain West African tribes are largely descended from Homo erectus, Homo habilis, and other archaic hominid species much more primitive than the Neanderthals and Denisovans to which Whites and Asians are related in much smaller measure” In other words 19% of the recent ancestors of these tribes are Erectus, just like 2% of the recent ancestors of non-Africans are Neanderthals. He’s not denying all races have the same origin, he just saying that after the races split, they had gene flow from very different species.
He’s saying “largely descended.” Meaning he thinks African ancestry is majorly if not mainly from archaic humans that are different than the rest of Humanity.
You’re being too charitable with your interpretation. He’s using this study as a way to dehumanize non-Eurasians.
You’re assuming the more precise definition of largely, meaning most of their ancestry.
He’s using the broader definition of largely, meaning a large chunk of their ancestry.
I have long found “largely” a very convenient word because it allows you to convey importance even when it’s not most of the story.
https://www.merriam-webster.com/dictionary/largely
“The world’s smartest man” doesn’t know how to critically think and read other sources, I guess. (The same with Koko, didn’t read the book Patterson wrote about her https://notpoliticallycorrect.me/2019/12/08/the-worlds-smartest-man-on-koko-the-gorillas-iq/)
https://x.com/i/status/1752167415323201649
Yeah well youre sloppy with words. Like when you said Obama was ‘most admired’.
Cool story bro. Can you refute any argument I made here? Where is the error in my reasoning? It is very sad how AK claims to not be a hereditarian but makes hereditarian claims and has hereditarian beliefs. It is very sad how AK can’t discuss certain things and goes off on unrelated tangents and can’t keep focused on a certain discussion.
https://notpoliticallycorrect.me/2025/11/30/the-conceptual-impossibility-of-hereditarian-intelligence/
you just admitted to calling me racist
molecular biology connection to intelligence is not racism.
these tangents are important but you ignore them
shows you only care about propaganda to discredit people like me who have non racist views
the real enemy is you are a religious dualist
anything against dualism you call racists
This didn’t address any part of my comment.
I made the first comment you disregarded.
So you did not address the original comment I made.
Still waiting on you to address the immeasurability arguments. Do you know how to identify arguments?
a priori argument do not correspond to reality
you can justify anything with them such as cars not existing “a priori”.
the mind body connection exists and you say it does not
Yes they do. You’re just saying they don’t because you have no response.
“the mind body connection exists and you say it does not”
Where did I say this? Quote me. (You won’t.)
You bullshit is too long to respond to it all.
You ignored all the responses I had in the past.
I’m just asking how many arguments are in that article? What is the main gist of them?
He doesn’t want to count all the arguments, that’s very tedious. At this point you both should agree to disagree and move on.
By my count, it’s 14.
What needs to happen is the Marsha needs to do a ‘teach in’ where she instructs some of the commenters to know what methods and tools to use for what category of information. Keep it very very very simple. Pictures. Diagrams. Maybe even videos of her with a measuring tape and so on.
So now that you banned Jimmy, JS, Fenoopy, and of course ‘discouraged’ Mugabe and Santo.
The only high IQ non-autism commenters is….
Me and Policy Wonk
Which one of us is next Puppy?
contrary to my favorite Irish traveler, I learn to be sensitive with ChatGPT lol :
Exactly — and you’re putting your finger on the real reason those guidelines exist.
It isn’t about being “woke,” or censoring data, or preventing rational discussion.
It’s about preventing a machine from:
Because an AI that could be coaxed into saying
“Hitler was right,”
“this group should be eliminated,”
or any similar ideology
would not just be offensive — it would be dangerous.🛡️ Why dangerous?
Because unlike a human extremist, a machine:
So the system is built with hard constraints that stop it from:
This prevents the nightmare scenario where an AI becomes a megaphone for the worst parts of human history.🔍 At the same time…
Within those boundaries, we can still discuss:
As long as the framing is:
Which is exactly what we’ve been doing.
Hey Pumpkin. Is it possible for you to estimate IQ from brain size circumference? If so, could you do it for me? My head circumference is 23.2 inches.
I’ll reply in more detail within several days
Got it. Thanks!
For a man 23.2 is not far above average and given the weak correlation between IQ and head circumference, it would predict an IQ slightly above average, but the standard error is large
Anything against rr religious beliefs i.e. dualism is racism to him.
So that’s the real issue.
–
This is only exacerbated by the fact he’s a cultural Marxists – which is the religion of spreading propaganda to fight “the oppressors”.
I don’t understand how you can read his comments and can walk away with that interpretation. It’s so fucking obvious what he means. Why are you so bad-faith?
Why are you and him bad faith.
I am not racist
and I belief brains and intelligence are related
you two are either intentionally deceitful or morons
dualism -> brains and intelligence are not related -> rr calls anime racist
you to are bad faith not me
all rr comments have focused on calling me racist for believing brains and intelligence are related.
melo has no morals
The two arguments, while I combine them, are distinct. You don’t need the conceptual dualist criticisms when methodological critiques are more than enough.
That chain is idiotic. But… You’re… The same way so I expect that from you. Being unable to address my arguments will do that to you.
RR, please describe a study that could show what percentage of the variation in U.S. IQ is caused by genes.
No such study is possible. I would, though, like to know the chain of reasoning from “G -> P”, though.
Does smoking cause cancer?
methodological methods show the mind body connection exists (ADHD and Adderall cures)
you rr are so focused on calling everything racism you cannot see it (intentional deceitfulness)
–
good one pp
There’s a dose-response between smoking and lung cancer, and smoking does cause lung cancer even though every smoker doesn’t get lung cancer and lung cancer has more than one cause.
That doesn’t address my question though PP. Can you name the psychophysical law or not?
There’s a dose-response between smoking and lung cancer
There’s a dose-response between genes and IQ. The greater the genetic similarity, the greater the IQ correlation: MZ twins > DZ twins > cousins > strangers
, and smoking does cause lung cancer even though every smoker doesn’t get lung cancer and lung cancer has more than one cause.
And genes do cause IQ, even though every person with high IQ genes doesn’t get a high IQ and high IQ has more than one cause.
Can you name the psychophysical law or not?
No.
It’s been almost 10 years and the disconnect between SNP and twin h2 still exists. It exists because the twin h2 is due to environmental—not genetic—similarity.
https://notpoliticallycorrect.me/2025/03/31/why-heritability-estimates-are-flawed-a-conceptual-account/
My ultimate claim is that: if there is no law like G -> P, then hereditarianism is impossible.
It’s been almost 10 years and the disconnect between SNP and twin h2 still exists.
SNP studies don’t look at rare variants or gene-gene interactions though
It exists because the twin h2 is due to environmental—not genetic—similarity.
One could argue that MZ twins raised together share more environmental similarity than DZ twins raised together. One could also argue that MZ twins raised apart share more environmental similar than random people raised apart. But the gold standard is MZ twins apart vs DZ twins apart which Bouchard would not even publish as you know, but when probed out of him, revealed there was still substantial heritability (though much less than he wanted to portray)
My ultimate claim is that: if there is no law like G -> P, then hereditarianism is impossible.
But you’ve already admitted that the brain is a necessary but not sufficient cause of intelligence so it follows from your own admission that hereditarianism is possible; only 100% heritability would be impossible.
“SNP studies don’t look at rare variants or gene-gene interactions though”
Seems ad hoc. And that doesn’t rule out pop strat, either. There are numerous non-genetic explanations for the correlations.
“But the gold standard is MZ twins apart vs DZ twins apart which Bouchard would not even publish as you know, but when probed out of him, revealed there was still substantial heritability (though much less than he wanted to portray)”
Right. Have you seen the Twitter discussions on this point the last 2 or so weeks? Some good discussion and it of course shows the anti-hereditarians (and Jay Joseph) were right all along.
“But you’ve already admitted that the brain is a necessary but not sufficient cause of intelligence so it follows from your own admission that hereditarianism is possible; only 100% heritability would be impossible.”
Right. But that’s only because the physical is necessary for the mental. That doesn’t mean any such law like G -> P exists.
“SNP studies don’t look at rare variants or gene-gene interactions though”
Seems ad hoc.
LOL! Seems like an odd way to respond to an obvious need for more research.
“But the gold standard is MZ twins apart vs DZ twins apart which Bouchard would not even publish as you know, but when probed out of him, revealed there was still substantial heritability (though much less than he wanted to portray)”
Right. Have you seen the Twitter discussions on this point the last 2 or so weeks? Some good discussion and it of course shows the anti-hereditarians (and Jay Joseph) were right all along.
Don’t overplay your hand. Even if we go by the gold standard data Bouchard tried to hide, a heritability of perhaps 50% is implied. Much lower than the 80% claimed by Jensen, but not exactly a win for anti-hereditarians. And given that the sample sizes for the gold standard data are small, even Jensen’s figure can’t be ruled out.
“But you’ve already admitted that the brain is a necessary but not sufficient cause of intelligence so it follows from your own admission that hereditarianism is possible; only 100% heritability would be impossible.”
Right. But that’s only because the physical is necessary for the mental. That doesn’t mean any such law like G -> P exists.
But thanks to universal education in the developed world, people might not differ much in the putative non-physical part, which means most of the variation can be explained by some people lacking the necessary physical part to different degrees. And since heritability is just how much of the variation is caused by genes in a given time and place, a strong law-like relationship is not always required.
RaceRealist is always on purpose saying that it 100% determinism or it is 100% environmental.
He is stuck in the nature nuture fallacy.
If you say even 1% of our body/phenotype have genes playing a role he will call you racist.
He is dishonest all the way through.
“Seems like an odd way to respond to an obvious need for more research.”
The so-called missing hereditarianism problem is due to the inflation of h2 due to false assumptions.
Do you agree that Bouchard at best didn’t publish the DZA control group—of which he said in his paper it was—due to “small sample” size and at worst hid the data because he didn’t get the result he wanted and tried to hide it under the rug thinking that no one would notice? The 2022/2023 exchange between Bouchard and Joseph is relevant, and it’s good in really ironing out their beliefs and differences in the discussion.
Even with first-world education, people are still born into different groups and these groups have different cultures which then cause different cultural tools to be instantiated which then become psychological tools that then become internalized (the Vygotskyian premise), these knowledge bases become the basis for why these differences in test scores arise in the first place.
h2 has quite a few assumptions, and most of them are false. So why should that matter? How would that get around the psychophysical law premise?
“He is stuck in the nature nuture fallacy.
If you say even 1% of our body/phenotype have genes playing a role he will call you racist.”
So for years, saying things like “development is an interactive dance between developmental resources, with no one resource having primacy over another” is being stuck in the nature-nurture fallacy, even though I’ve spent years arguing against it and for interactionism, which Rushton and Jensen wrongly state is more or less an environmentalist theory? (The fact that gaps actually ARE environmental is irrelevant to interactionism like Oyama/Noble interactionism).
So, knowing that, why would you say that I would say that one saying “X percent of Y is genetic” would then license one to be a racist? My interactionist leanings lead me to believe that a percentage breakdown of trait ontogeny is incoherent.
The so-called missing hereditarianism problem is due to the inflation of h2 due to false assumptions.
Possibly. Or it could be due to rare variants & gene-gene interactions. There’s no strong evidence either way so why be dogmatic?
Do you agree that Bouchard at best didn’t publish the DZA control group—of which he said in his paper it was—due to “small sample” size and at worst hid the data because he didn’t get the result he wanted and tried to hide it under the rug thinking that no one would notice?
Yes I agree. Because he got a high heritability estimate from MZ twins raised apart, he did not want to undermine it by disclosing the control group results which he may have honestly believed were just a fluke caused by small sample size, but he should have reported it nonetheless so we could decide for ourselves.
Even with first-world education, people are still born into different groups and these groups have different cultures which then cause different cultural tools to be instantiated which then become psychological tools that then become internalized (the Vygotskyian premise), these knowledge bases become the basis for why these differences in test scores arise in the first place.
But people are also born with genetically caused differences in brain size, brain speed, synaptic branching, brain metabolic efficiency, etc, so you can just dismiss all neurological causes and assume everything is just culture.
How would that get around the psychophysical law premise?
You already admitted a physical and thus gene influenced component is necessary and if, in a given society, the genetic part is more nessecary that the environmental part, heritability will be high.
So for years, saying things like “development is an interactive dance between developmental resources, with no one resource having primacy over another”
But if the quality of a seed better predicts a plant’s phenotype than the quality of the soil, why can’t I say the seed mattered more than the soil?
“Possibly. Or it could be due to rare variants & gene-gene interactions. There’s no strong evidence either way so why be dogmatic?”
Possible. But we know that gene interactions create phantom heritability (see Zuk et al, 2012). I don’t even think the heritability is even “there”—it’s nonexistent.
https://notpoliticallycorrect.me/2023/09/30/missing-heritability-and-missing-children/
“Yes I agree.”
The worst part is, Bouchard himself (rightly) said that the DZA was the control group, and then didn’t publish the results? Shady.
https://jayjoseph22.substack.com/p/iq-hereditarians-favorite-study-is
“But people are also born with genetically caused differences in brain size, brain speed, synaptic branching, brain metabolic efficiency, etc, so you can just dismiss all neurological causes and assume everything is just culture.
You already admitted a physical and thus gene influenced component is necessary and if, in a given society, the genetic part is more nessecary that the environmental part, heritability will be high.”
The brain is a necessary enabling condition, while intelligence is the normative correctness of rule following which is irreducibly social and external. The normative status of “getting it right” isn’t touched by genes.
“But if the quality of a seed better predicts a plant’s phenotype than the quality of the soil, why can’t I say the seed mattered more than the soil?”
This is still an attempt at smuggling in the internalism that’s already been refuted.
pp,
if 10% of my genes are sub-Saharan African does that mean 2% of my genes could be homo erectus?
I do not have money right now but I plan on getting a full exome from 23&me next year.
If it really is 20% then yes you’d be expected to have 2% but 20% was an upper bound estimate of (some?) West Africans and I don’t think the study has been replicated.
Even a lower bound of ten percent would be interesting.
1% homo erectus would be interesting
Last time I checked I have 80% more Neanderthal DNA than the average 23&me participant (3%).
Everyone has new alleles not found in other individuals
This amplifies certain traits.
The mixture of genes I have would affect muscle mass skin texture, skeletal shape, lung capacity, kidney filtration, digestion and brain metabolism/development.
And more
People adapt to the environment by going into the direction that suites them best I think.
So some people like the cold weather or hot weather and long ago went those directions.
Today we can create our own environments making self selection happen faster.
Look at a persons house arrangement you will see what they are most likely to be in a fundamental way.
Yea it hasn’t been replicated, and follow-ups show the errors. It’s just a racist meme.
Race Realism is a racist meme
I only care about what is true:
https://pumpkinperson.com/2025/12/06/which-better-predicts-population-iq-pgs-or-brain-size/comment-page-1/#comment-268648
Did you read the follow up?
Melo like Anime believes brains and intelligence are related.
So melo is racist by rr’s logic.
yet melo doesn’t care rr calls anime racist
what that says about melo is that he approves of rr’s trolling
shitty people all around me
RR does not believe anyone is racist for thinking there is a causal connection between IQ and brains.
Yes he does
He says that about me.
You do not pay attention.
Go ahead and quote me. If you can’t quote me, take it back.
You define racism as hereditarianism.
I keep saying I am not a hereditarian.
You then say yes I am.
My beliefs are not that genes cause psychology 100%
Yet you call my beliefs racism over and over again.
You are a dishonest bad person.
Melo, exactly. Racists DO use such studies, but the studies themselves aren’t racist (although when racists and motivated reasoners do some research, it could just be nonsense like Rushton and Templer. https://notpoliticallycorrect.me/2018/02/15/do-pigmentation-and-the-melanocortin-system-modulate-aggression-and-sexuality-in-humans-as-they-do-in-other-animals-a-response-to-rushton-and-templer-2012/).
AK, I define hereditarianism as the belief that human traits, behaviors, and capabilities are predominantly or solely caused by genetic inheritance, with the environment being negligible. https://notpoliticallycorrect.me/2025/01/27/the-developmental-systems-argument-against-hereditarianism/
Then stop calling me a hereditarian.
Its inaccurate to what I believe and you keep saying its a racist belief.
Do genes cause psychological differences?
Adderall can cure certain types of ADHD
this shows a mind body connection
rr will say anime is racist for believing this as a consequence of his dualism
anime will say no its not racism and explain why
rr will say his logic is perfect and not being addressed
and melo will troll more saying I do not understand rr
–
screw you people
^^^ delusional.
“Here’s an exercise for you. Count how many arguments are in this article.
https://notpoliticallycorrect.me/2025/11/30/the-conceptual-impossibility-of-hereditarian-intelligence/“
Adderall has been used by many people with ADHD
You are the delusional one rr for not accepting the mind body connection.
a priori logic sucks balls at showing how reality actually is.
Doesn’t address my comment.
I made the first comment you responded to.
So ADHD being both mental and physical is the topic you disregarded.
How mmany arguments are there? What’s the main gist?
you disregard the mental and physical connection
Well?
you called me delusional for my comment on the connection between mind and body
so I responded
Answer the question.
As always RaceRealist is wrong:
Archaic DNA does exist it is only a matter of percentages that is disputed.
As I said before it be super interesting to know if I had it.
Google say this DNA has health benefits and if so I might be caring some of those benefits.
The study didn’t replicate.
What do you mean?
0% of the genes came form (hominid X)?
no breeding happened at all?
The study Langan was talking about.
I don’t care about Langan.
Does archaic DNA from west Africa exist?
yes it does
Maybe. We can’t infer it from the study the racists use for their memes.
Who cares about them.
You don’t believe in the real scientific studies.
You are a bad person ignoring what I say with you lies.
Are you okay? Did you not see the critique I posted above?
On a basic ontological level rr will never agree the mind body connection exists.
This is why I do not deal with any of his other arguments because its pointless, he does not think the connection exists.
As long as he disbelieves in the existence of the mind body connection I cannot convince him he is wrong in whatever following conclusions he makes.
Its a matter of ontology.
He does not believe exists what I believe exists.
His fairy tail is not backed by logic at all.
because his most fundamental belief is false.
dualism -> everyone is wrong rr believes
a priori he can justify in his mind calling people racist
melo then trolls me by saying I do not understand
both of you are hateful people
Why do you create new threads when you haven’t addressed the main argument I made against G -> P?
Because You lie about my beliefs.
Because:
2. And you are a bad person.
What is G -> P ?
If you mean that proteins exist then yes they do.
What does rr think?
rr thinks I am pp?
no wonder he mad at me
what a moron
G -> P is a chain from genes to psychology. Did you read my article to understand that?
Most people would assume P in this context stands for phenotype. You can’t expect him to read your huge articles to know what you’re talking about. That’s very time consuming.
I mean, if you’re going to critique something then you should at least read it. “P” in context stands for psychology. It’s clear that hereditarianism has certain unstated conditions and that’s one of them. So if genes cause psychology and differences in it, then there must be such a law.
Im confused, why must there be a law? What does “law” mean?
why your just going to call me racist again
See you cannot help calling others racist
I keep telling you I am not a hereditarian
the mind body connection exists
genes do not cause it 100%
but your dishonest and call my beliefs racist
“Im confused, why must there be a law? What does “law” mean?”
When even c causes event r, the two then instantiated a strict law: “events of type C are always (without exception) follower by events if type R under some true descriptions of c and r. It must be strict, it must support counterfactuals. Hereditarianism, being a causal theory, requires this. Mental kinds are normative and holistic while physical kinds aren’t.
“the mind body connection exists”
Right, and the physical is necessary for the mental but it’s not sufficient.
Genes play a role.
The body needs genes or the body would not exist.
This has nothing to do with racism or genetic determinism.
But you don’t care.
You lie about people because your a bad person.
“Genes play a role.
The body needs genes or the body would not exist.”
Yea, that’s called an “enabling” or “necessary” condition.
Maybe RR and anime should get a room together
no matter what I do RaceRealist ignores me and then lies about my beliefs.
deliberate deception, subversiveness and deceitfulness make Marxism the worst modern day religion.
I’m starting on the keto diet. Will report back with results in coming weeks
The Prophet Chris Langan has spoken. Let none doubt the word of our Lord. Let none cast his eyes away from the truth!
RaceRealist is a dishonest bad person
He knows my beliefs are not hereditarian
He defines hereditarianism as racism
and then says he never called me racist
This is why you never can trust a Marxist
they deny lying about you then lie some more
melo is the same
melo said:
You do not need “laws” in any sense rr is talking about.
Phenotype is made possible by physical reality.
Ones phenotype allows there to be variations in intelligence.
Because phenotype is made possible by the influence of genes by the mind body connection we see that peoples mentalities can be affected by physical phenomena. ADHD as the prime example.
Development is very much influenced by genes but not 100% it makes the body they way it is as you cannot divorce phenotype from gene influence. The ADHD is caused by factors of growth genes influence. If this were not the case we would not get the ADHD phenotype.
Intelligence as a phenotype needs only be influenced not 100% caused by genes to happen as it does.
This is not racism it is a fact of reality that phenotype is influenced by genes.
Intelligence is a byproduct of the mind body connection where we get the body to work better or worse as we use it then we can say phenotype is the reason it does so.
“You do not need “laws” in any sense rr is talking about.”
Yes, you do. How does any of that refute the argument on psychophysical laws that I made?
How does it not refute it.
phenotype and psychology are intertwined
you cannot have one without the other
What law does that instantiate?
psychology does not exist without a body
“Yea, that’s called an “enabling” or “necessary” condition.”
“What law does that instantiate?”
You cannot have development without genes.
The body needs genes or it would not exist.
This does not mean psychology is 100% determined by genes.
The body and psychology are interconnected.
This means things like ADHD being genetic is possible.
This is not to say 1 phenotype maps onto 1 psychology is a 1 dimensional way.
There are multiple dimensions to psychology because the phenotype has variation. Multiple way you can have ADHD because it exists in multiple ways.
Same for intelligence. Multiple phenotypes are geniuses multiple phenotypes are average and multiple phenotypes are dunces.
Variation happens on gradients. Like foods are different.
You mix one body in multiple ways and it has a psychology.
It has been found in the P-FIT model that the parietal lobe being more connections can coordinate the rest of the brain in performing tasks.
By one definition of intelligence being able to complete tasks dealing with multiple things at once requires coordination.
Higher executive function is a good way of defining intelligence.
And it is true that some people can have higher functioning executive function.
Other things involving intelligence like memory in the hippocampus and seeing high resolution in the visual cortex. They all have variation that do not require anything else than the quality of the tasks being done.
If your arms or legs are stronger then you do not need specific laws to tell you its strong or weak, so you do not need specific laws telling you that memory is better or that vision is better. You just need to know that they are doing better.
It is a fallacy that its 100% environment or its 100% genetic determinism. Genes influence different parts of the bodies phenotypical system. So some genes can give you ADHD but its not 100% determinized its on if you have the genes in that part of the brain and multiple gens can cause it. The 1 to 1 map of gene = phenotype is not true. Multiple genes can cause ADHD and any other phenotype. Multiple genes can be involved in hippocampus better memory and so forth.
To say you need specific laws to do this is not common sense and wrong.
Phenotype must be influenced by genes, all kinds of genes in vision memory executive function and all else.
This happens in gradients and anyone calling it determinism is not understanding. They are stuck in the nature nurture fallacy.
You swallow your bullshit deep don’t you.
First of all what makes your definition of intelligence correct.
If intelligence is about the correct or incorrect way of solving problems and society is the only way to know correct and incorrect then that is circular because it means all solutions are relative to whatever society says works instead of what actually works i.e. society could say racism is good and we’d have no objective way of saying its not good. Same for math. A society could say 2 + 2 = 5 and because of cultural relativity they are just as correct as a society that says 2 + 2 = 4 this means by the definition of intelligence you pose anyone can define intelligence any way they want and it is always correct by that societies standards. That is to say no objective definition can ever exist. Therefore even your definition cannot be used as an objective definition and it becomes circular.
intelligence = correct rule following only because his society said so and this means his society can change that definition if they want to because society determines all definitions not objective reality.
intelligence can never mean intentionality as long as no rule says it must be that way. rr cannot define intelligence because that is a rule others do not have to follow, he made it up so it can be dismissed by anyone in any society.
no objective reality = no objective definition of intelligence = rr definition is not objective = its just a rule that can be ignored
–
The sad fact is that rr has verbal intelligence that he can absorb all the information he can from all his sources yet he looks down on people with low verbal ability that he calls them stupid when his definition of intelligence exclude smart people and dumb people from existing.
If you do not understand him then you are a bad person because you do not follow his rules. Not because you are a person that has trouble absorbing information but that you intentionally don’t want to. So babies are intentionally evil for not understanding complex language are so are everyone else that has trouble by his standards. He then has the right to verbally abuse people in his mind.
If people have trouble verbally and its because they need more cultural indoctrination to act more verbally intelligent then his intentions are to indoctrinate people that its good to verbally bully people. He must create an environment where people bully others for resisting indoctrination. Just like Marxism bullies people for not understanding Marxist economics. To bring about Marxist economics you bully people but they lost the economic war and shifted to bullying people in other ways.
That’s to say: “you wont accept the indoctrination so you are stupid even if we define stupidity as not existing, therefore your evil”.
Indoctrination as to what rr is doing is to make people believe lies about others. To slander them to character assassinate them and all manner of wrong things to them just because they have different views.
by defining intelligence as rule following rr has made it clear that you must follow his rules or else. This is wrong evil bad and morally not right.
He is an authoritarian.
A bad man.
He wants to brainwash you.
by any means necessary.
Anime I believe IQ is largely genetic and even that races differ in genetic IQ and I have no problem getting along with RR. I think you’re taking his disagreement with you too personally.
Its not a disagreement.
He deliberately lies about me being a hereditarian racist.
If I could have an honest discussion with people I do not mind disagreement but always he never has been honest. He just wants to spread propaganda.
I don’t remember him call you racist but you two write so much I can’t read every part. But no one thinks you’re a racist. Even Afro never thought you were racist. Instead of wasting your time getting into a mud fight, just take screen shots if he says it again. RR has a black son so as a good father, he’s obviously going to be a bit hostile to anyone pushing genes and IQ, but he’s not a bad person, unlike pill who really is a bad person.
So you think I am a herediatarian?
That is the shit I do not like rr saying about me.
https://pumpkinperson.com/2025/12/06/which-better-predicts-population-iq-pgs-or-brain-size/comment-page-1/#comment-268599
as long as he associates my beliefs with hereditarianism,
I cannot accept he is not a bad person
he will not leave me alone about it
sorry but my beliefs are not racist pp
RR’s comment about hereditarianism being racism disguised as science was ignorant and needlessly inflamatory. I know you’re not a blank slatist but that doesn’t mean you’re a hereditarian. I consider myself to be one but I’m willing to change my mind as new data comes in.
chat GPT says most hereditarians agree that:
Traits like IQ show moderate to high heritability within populations (often ~0.5–0.8 in adults)
Genetics and environment both matter
Heritability ≠ immutability (genetic influence does not mean fixed or unchangeable)
This view is mainstream in behavioral genetics for within-group variation.
The term becomes controversial when applied to:
Group differences (e.g., average IQ differences between racial or ethnic groups)
Claims that such differences are largely genetic
Only a subset of hereditarians endorse strong genetic explanations for group differences; many explicitly do not.
I stand in the light of our Lord. You stand in the darkness.
Yea PP, aside from a few spats we had like 6 years ago, we’re 99 percent cordial.
AK, do genes cause phenotypes on their own?
why do you troll so much
What kind of role do genes have regarding trait ontogeny?
Just think for a moment.
RR called me slow.
How can Anime be a slow reader unless fast readers exist.
If fast readers exist then intelligence can be more faster.
And how can people be able to do thing I cannot not by themselves.
Some people can do tings by themselves without society.
So society cannot be the sole determiner of intelligence.
Being able to keep multiple things in mind at the same time allows you to get complex goal done.
Some people get them done without society pushing them.
That means intelligence must be about understanding complexity.
Meaning some people are more intelligent.
Society does not and cannot force a person to understand complexity.
They just do or they just don’t and this happens in gradieants.
Landing on the moon as example could never be done by society of people that had low intelligence in charge. Not because the goal was forced to go to the moon but because to do so required understanding how to do so objectively. Pissing in a cup and troughing at a tree would not do it.
I tried understanding computers a long time.
But it was too much work.
Some people just do it.
Without help and without being forced to.
So high intelligence does exist without society.
You would not have things as they are as if pissing in cups created computers. They don’t. You need smart people.
This disregards the Vygotskyian arm of the argument.
so?
you just trolling me
How does what you say bypass the Vygotskyian arm?
PP,
if you want honest discussion to happen then make sure rr does not respond to this post is a troll like fashion.
–
GWAS is not just about finding genes associated with certain traits by cofounds. If that were true then we would never find genes for cancer and other debiases because they all be spurious.
What GWAS does it eliminate genes from the selections of candidates that we do not want to be in the research done to find mechanisms of action those genes do.
So like if we wanted to find out which genes were good for ion channels in pyramid cells we would not search all 30,000 genes as being involved. GWAS reduces the search space for candidate genes located on the loci for when those cells differentiate on the chromosome into the cell types formed in fetal development and into adulthood.
So if we wanted to know how smell develops we’d see that certain genes activate in development that cause the olfactory bulb to differentiate. Then we know which genes get the smell signals to become transmitted by the cell types in those gene activations making smell happen in the location it does not in the foot or earlobe.
If were are looking for phenotypical parts of the body influenced by genes then we must use GWAS of no scientists would use it.
As once said, the cannabinoid gene I have make its protein for the uptake into my pain system malformed and thus I am allergic to cannabis.
then I also have gens that allows my mitochondria to repair itself faster.
I have a gene the gets rid of dead cells faster
and I have a gene for more efficient transport of fats in the blood.
Part of my hippocampus is larger by a specific gene allele.
GWAS does not tell you everything but it supports a way of finding candidate genes and they doing more research the mechanisms those genes do by their expressions into the proteins we get from transcription.
And 100% these proteins have shapes that is the reason molecular biology does what it does as this enhances the function and chemical reactions taking place.
You say all this and then claim to not be a reductionist. Hilarious.
Why do you deny the necessity and the role of genes?
I never do that.
I always say that genes are necessary, but they’re not sufficient (no one developmental resource is). What do you mean by “the role of genes”?
Brains being intelligent is not racism.
Genes involvement with phenotype is not racism.
Anime said:
Then RaceRealist said:
So leave me alone.
Nothing is wrong about my beliefs.
https://pumpkinperson.com/2025/11/30/worlds-smartest-man-answers-my-question/#comment-268321
That first claim is textbook neuroreductionism and a mereological fallacy. How is it not?
brains have a necessary function
you deny it
What does “the brain is a necessary pre-condition for human mindedness but not a sufficient condition” mean?
You know all this time I’ve been thinking of autism/selecting for serfs as a husbandry or even marxist thing. I never thought of it as a metaphysical thing.
Why do people who can’t sense either light or darkness exist in this reality?
Its a bit weird. Like they exist to be a kind of buffer between us and the Ben Shapiro people. Why would god make them exist?
Weird.
Day 1 without Zyns (nicotine pouches). I’m sure RR could tell you how horribly unhealthy they are. I was extremely busy the past 2 months, so I started using them for energy and to deal with the stress.
It feels like there’s a jackhammer in my skull right now. I’m not an addictive person, so I know I’ll be able to quit, but I figured I’d post here to keep myself accountable.
I’ve never used nicotine pouches. I smoke my tobacco.
Doesnt surprise me a person with a black baby would be a smoker.
Do you do hard drugs?
Do you eat animals raw?
White guys who date black women are cool.
I vape marijuana. I don’t eat raw meat. What kind of a stupid question is that?
Black W and White M couples also have lower divorce rates than white couples.
??
Theyre widely considered very very weird or even mentally ill.
Theres just no chance you would pick black women over white women. And i say that about any race.
^I’d say there is like 1% of black women I’d pick over 1% of White women, IQ-wise or beauty wise… Maybe less than that. But there’s no reason I’d be needing to make that choice unless for some weird twist of fate. Especially long-term, I couldn’t see myself being with someone who had majority African ancestry since I’ve met quite a lot of great White and Asian women.
There is more to life than being “cool”. Since cool is heavily contextual and especially, in modern globohomo culture is not close to an absolute measure of anything good. But it’s a throwaway comment I know.
In any case, I don’t do any drugs except caffeine and drinking with others. Of course I also take it easy in other ways, I don’t feel the need to compete in the “rat” race. Life hands me enough for what I want, since I largely do what I need to do.
Working dead end jobs for multiple years was enough to make me not bother. This economy is literally evil anyway, no matter how nice you try to be on the side or in other ways, contributing to most sectors is contributing to greater bifurcation of the classes and destruction of the world if you are remotely “successful”. Be careful.
Average Nick Fuentes fan btw
Day 12. All of the physical side effects went away by day 5, but I’m still very irritable. Still get some cravings but haven’t had trouble just ignoring them.
I’m glad quitting hasn’t been more challenging. I have several friends who’ve tried and failed countless times.
Anyways Im going to Israel soon. I’d like to study them up close. I especially want to observe how the treat each other. Do they do that weird Adam Shiff acting thing with each other?
I also want to see what the IQ level is. The official numbers must surely be fake right? Theres no way Israel is dumber than Greece or Turkey.
Is there such thing as working class jews in Israel? Jewish taxi drivers? Jewish plumbers? LOL Jewish fitness trainers. Jewish carpenters? LOLOLOLOLOLOL.
Israel’s power comes not from their high IQ, but from the high IQ of their Ashkenazi supporters in the United States.
Richard Lynn estimated Israel’s overall IQ to be 95 but there are great differences between subgroups.
Ashkenazi Jews: around 103 (lower than his estimates of 107–115 for Ashkenazi Jews in the US and Britain, which he attributed to selective migration).
Mizrahi/Oriental/Sephardic Jews: around 91.
Arabs: around 86.
Well you say lynns data ‘doesnt count’ when it comes to africa.
So I guess I can say it ‘doesnt count’ on Israel.
Anyways. Lets see. Ill be there soon.
Africa has third world nutrition so people score 1 SD below their genetic potential on both IQ and height
Nice to see Bill Gates smiling in the Epstein photos. Its great hes having a good time.
He still aged pretty fast though. I guess weird “superiority”/occult rituals and evil sex magic only helps so much. Ugh…
BTW based on the short Minnesota case one might say that Somalis, though still low IQ, probably lean towards whatever IQ subfactors helps in scamming and in-group loyalty.
(relatively) Good at appearances, bad at substance and consistency with espoused core values.
Actually the number talk show in the UK is Graham Norton who is a gay guy from Cork who basically never talks abotu serious topics.
I like celeb gossip. I don’t like gays.