[The following is a guest post by Ganzir and does not necessarily reflect the views of Pumpkin Person]
Let us make the following assumptions to simplify an illustrative example, although they are unnecessary for such an effect to arise.
Intelligence is normally distributed.
Our model intelligence test item has an item characteristic curve, i.e., graph with intelligence on the x-axis and probability of solving the item on the y-axis, with a break-even point, i.e., the IQ at which 50% of people solve it, of 130.
This item’s characteristic curve is symmetrical in that going X IQ points above 130 will increase your probability of solving the item by the same amount that going X IQ points below 130 will decrease your probability of solving the item. For example, a person with an IQ of 120 has a 35% chance of solving this item, which means that a person with an IQ of 140 has a 65% chance of solving it.
Although people above IQ 130 might miss this item and people below 130 might solve it, the only determinant of whether or not a person solves the item is the probability on the item characteristic curve corresponding to their IQ.
If I am told that a randomly selected person solved this item, what is my best estimate of their IQ?
130?
Wrong!
If you said that, you committed the base-rate fallacy because you forgot that there are more people below 130 than above 130.
To calculate the answer, apply Bayes’ Theorem. Look that up if you do not know what it is (that is a good habit to learn; look something up yourself before asking someone else). In this problem, it will tell you that our general formula is to calculate A = B * C / D for IQ X, where
A = The probability that someone has an IQ of X (in this case, X = 130), given that they solved the item
B = The probability that someone will solve the item, given that their IQ is X
C = The proportion of people who have an IQ of X
D = The total proportion of people who solved the item
D is the sum of, for each IQ, the proportion of people who will solve that item at that IQ multiplied by the proportion of all people with that IQ. In other words, D is the sum of B * C calculated for every possible value of X. Technically this would be an integral, but we could treat it as a sum by doing the calculation for each IQ point, or each 5-point IQ range, or whatever division of the intelligence spectrum.
In a sentence, the formula A = B * C / D means that the probability that someone who solves the item has an IQ of X is equal to the proportion of people with an IQ of X who solved the item divided by the total proportion of people who solved the item. If that does not make sense, please contemplate it until it does. Venn diagrams might help.
Once you have calculated B * C / D, find the maximum value of A. That is your best guess of the person’s IQ.
Why is this important? Because if you have an item for which the break-even point is far from the average and for which the item characteristic curve is (informally speaking) not close to flat around the break-even point, then the maximum value of A will be closer to the center of the IQ distribution than the break-even point is. If that sentence was a bit much to digest, someone who scores really high on a test, or solves a really hard item, probably has a lower IQ than almost everyone would think!
Allow me to demonstrate on our example item, with the help of <a href=”https://www.iqcomparisonsite.com/IQtable.aspx“>this chart</a>. A very, very rough estimate of D is the sum of the following:
Proportion of people with an IQ of 120 * Proportion of people with IQ 120 who solve the item
Proportion of people with an IQ of 130 * Proportion of people with IQ 130 who solve the item
Proportion of people with an IQ of 140 * Proportion of people with IQ 140 who solve the item
I calculated the proportion of people at each IQ level by, with numbers from the table linked above, subtracting the proportion of people at IQ X from the proportion at IQ X+1. Now we plug in:
0.0105 * 0.35 = 0.003675
0.0034 * 0.50 = 0.0017
0.0008 * 0.65 = 0.00052
(Please do not bitch to me about significant figures. There is no need to bother with them here, and to how many decimal points I calculated the proportion of people at each IQ is arbitrary and irrelevant.)
What do we learn from this? If everybody with an IQ of 120, 130, or 140 attempted this item, and one of them were randomly selected, the probability that they have an IQ of 120 is 0.003675/(0.003675+0.0017+0.00052), which is about 62%. Even though the item “nominally” discriminates at 130, the majority of people who pass it have an IQ of 120!
This is a contrived example calculated with very generous assumptions, but my point, which stands even in the real world of non-spherical cows, is that a person who does one thing that seems to indicate exceptional smartness is probably not so exceptionally smart. The “Ganzir Effect” applies to reality as well as intelligence tests, which should be understood in the context that an intelligence test is only worthwhile insofar as it predicts real-life performance.
A concrete example of the Ganzir effect
I can give you a concrete example of this effect from the Mega Test norms:
The fourth column gives the percentage of testees in each six-point range who solved problem 36 (three interpenetrating cubes), the hardest problem on the Mega Test. Only the range 43-48, where 8 out of 13 candidates solved this item, exceeds its break-even point. However, from the third column, we find that 87 people solved it. Even though candidates in the ranges 37-42 and 31-36 were much less likely to solve the problem, 25 people in 37-42 did and 23 people in 31-36 did. If all I know is that someone solved the three cubes problem, it is almost three times as likely that they scored in the 31-36 range, i.e., high Triple Nine to low Prometheus, than in the 43-48 range.
I think baking cookies is equal to Queen Victoria running an empire —-Martha Stewart, 2000
In light of my research on Oprah, a reader wanted me to blog about Martha Stewart. It’s interesting to compare the two women because although both came from nothing to build perhaps the two biggest female owned multi-media empires of the 20th century, and both did it as TV personalities and life style gurus targeting white suburban housewives, the two women could not be more different.
Oprah came across as warm and engaging. Martha was a little more cold and aloof. Oprah talked about people and emotions. Martha talked about objects and things. Oprah is black looking black woman who struggled with her weight, Martha is a blond former model. Viewers saw Oprah as a friend they could relate to because of their shared struggles while Martha was seen as an unattainable icon of domestic perfection that no housewife could possibly live up to.
For almost all of their careers, Oprah was much richer than Martha. On Sept 24, 1999, Forbes required a net worth of $625 million to be one of the 400 richest Americans. With a net-worth of $725 million, Oprah was once again the only black to make the cut and well on track to become the first self-made woman billionaire. Martha had never once been anywhere near rich enough for the Forbes 400 and this year was no exception. However a mere 25 days after the authoritative list was released, Martha stunned the business world by taking her company public, briefly leap frogging over even Oprah to become the first self-made woman billionaire with a net worth of $1.3 billion, and easily making the Forbes list the following years.
After years of putting the housewives of America to shame with her perfect cooking, immaculate decorations, former model good looks and domestic perfection, she now put career women to shame by becoming a billionaire (on paper) a few years before any other self-made woman made the cut. She seemed so superior to everyone in every way. An avid reader who loved Nancy Drew, her high school manta was “I do what I please and I do it with ease.” (Byron, 2002)
In a recent Netflix documentary, we see her physically towering over her short kitchen helpers as she berates one for using a small knife to cut an orange: ALWAYS CUT ORANGES WITH A BIG KNIFE! SO MUCH MORE EFFICIENT! Even her Yale law educated Ashkenazi ex-husband was not safe from being made to look foolish by Martha who called him “FUCKING STUPID” for stacking firewood wrong (Byron 2002). Given that Ashkenazi Jews average verbal IQs 20 points higher than whites, it’s likely the elite law grad could hold his own with Martha verbally, however the average Ashkenazi Jew is somewhat below the white mean on non-verbal visual-motor cognition and if her husband showed this pattern too, it may have caused tension in the marriage given Martha’s high standards for hands-on, do it yourself domestic tasks.
Oprah was shocked when she learned Martha’s husband got a court order saying she could not speak to him, saying she never heard of such a thing. “That was a kind of punishment,” explained Martha during an interview in O Magazine. “Was it punishment for being too smart?” asked Oprah.
Although the media elites who ran Time Warner talked down to Martha like she was a1950s housewife …”I explained to Martha…Martha’s getting angry” she got the last laugh when she took them to the cleaners financially (Byron, 2002). The business world watched in awe as one of the biggest companies in the World was being “led around by the nose by a former caterer”.
When Martha demanded her own talk show, one media person doubted she had what it took to make money in such a competitive field. When Martha explained that she didn’t care if it made money, the person realized he was dealing with one of the greatest business minds the World had ever seen. The whole point of TV shows was to sell adds to make money, but Martha was so clever she realized the talk show itself could be an add (for her books, magazine, and Kmart products) disguised as a talk show, and thus instead of paying money for add space in other shows, she made money by getting advertisers to sponsor her stealth add (Byron 2002).
After famously taking her company public and becoming the first self-made woman billionaire, she was asked how she was doing, she smugly replied “I’m rich” as she marched into every room like she owned the place (Byron 2002). The country was dripping with jealousy and soon she found herself investigated for insider trading, spending five months in jail for conspiracy, false statements and obstruction. This scandal combined with the decline of old media (books, magazines, TV shows) in the internet age caused her stock to lose most of its value.
“Little Miss Perfect has fallen on her face,” gushed one media observer.
Nonetheless, she’s still worth hundreds of millions and her place in history as the first self-made woman billionaire is secure, though the achievement was a fleeting one.
PART 1: BIODEMOGRAPHIC EVIDENCE
Expected IQ of the first but fleeting self-made woman billionaire
Since Forbes began keeping score in 1982, it’s estimated that at least 1,739 Americans have been rich enough to make the Forbes 400 at one time or another. Of these I estimate about 1,655 are still alive. The percent who are “self-made” (not from a rich family) ranged from 40.7% in 1985 to at least 68.5% in 2011 (see table 1 of this document). Let’s split the difference and say about 55% of the 1,655 (910 people) were self-made.
As of 2023 there 209 million Americans old enough to have earned Forbes 400 wealth at some point in their lives (age 30+), so self-made Forbes 400 members (current or past) are all roughly above the one in 230,000 level in wealth creation (with Martha only narrowly making the cut since she only made the list a few times, unlike say Warren Buffet who made the Forbes 400 all 42 years in a row).
If there were a perfect correlation between IQ and self-made wealth, Martha’s IQ would be 67 points above the U.S. mean of 100, but since lifetime earnings (a proxy for self-made wealth) “only” correlates about 0.45, we’d expect her to be 0.45(67) = 30 + 100 = IQ 130.
Expected IQ of a 17 BMI U.S. woman
Decades before she was rich or famous, Martha’s tall thin physique combined with her sharp fashion sense, had her named one of the 10 best college girls of the year by Glamour magazine. According to the folks at celebrityheights.com, who I trust because they’re as autistic about height as I am about IQ, Martha’s peak height was 5’9.5″ and in her youth she appears to have weighed about 120 lbs. “It’s reasonable to estimate that less than 10% (and likely closer to 5%) of young women in the 1960s had a BMI of 17 or less” (Chat GPT, Feb 3, 2025).
If there were a perfect negative correlation between IQ and weight/height ratio, we’d expect Martha’s IQ to be 25 points above the U.S. mean (top 5%), but because the correlation is only -0.22, the expected IQ would be 0.22(25) = 6 points above the average of 100 and thus 106.
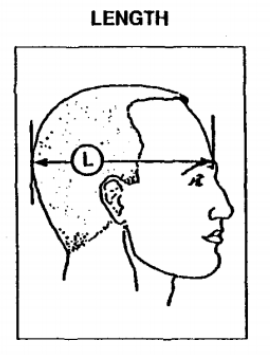
Expected IQ of 23″ headed woman
Martha also appears to have an extremely large head (a proxy for brain size). I could find no data on Martha’s head or hat size, but by placing a ruler on my computer screen, I made some crude estimates of her head length which is measured like so:
For example, Rosie O’Donnell once claimed on her show that her head size was 24.5″ and in the photo below, their head lengths are identical, suggesting Martha’s circumference is 24.5″ too.
However Oprah claimed her head is 25.25″ and in the below photo, Martha’s head length is “only” 80% as large, suggesting a head circumference of 20.2″.
However in the next photo, Martha’s head length appears equal to Oprah’s suggesting she too has a head circumference of 25.25″.
Averaging all three estimates (24.5″, 20.2″ and 25.25″) gives 23.32″ (592.3 mm). According to the U.S. Army Anthropometric Survey Database, by Claire C. Gordon (Final Report, October 1996), in 1995, a sample of 3,482 active duty females in the U.S. army had their heads measured. The mean circumference was 546.6 mm and the standard deviation (SD) was 15.1 which makes Martha +3.03 SD! If there were a perfect correlation between IQ and within sex head circumference, Martha’s IQ would be 45 points above the U.S. mean of 100, but since the correlation is only about 0.23, the typical IQ of people with such heads is 45(0.23) = 10 points above the U.S. mean and thus IQ 110.
Expected IQ of a 17 BMI 23.3″ headed first but fleeting self-made woman billionaire
Having already estimated what Martha’s IQ would be based separately on money, height and head size, it is time to estimate what her IQ is based on all three of her most salient cognitive correlates. Decades ago, a Promethean told me this type of thing could be done if you know not only each predictor’s correlation with IQ, but also their intercorrelations. So let’s build a correlation matrix!
Lifetime earnings
Weight/height ratio (within sex)
head circumference (within sex)
Lifetime earning
Weight/height ratio
0
head circumference
0.1
0.2
IQ
0.45
-0.22
0.23
By abstracting across the correlational matrix, we can infer that money, weight/height ratio and head circumference each have an independent predictive power of +0.41, -0.18, and +0.18 respectively.
Recall above we said that if there were a perfect correlation between these three variables and IQ, Martha’s expected IQ would be 67, 25 and 45 points above 100, respectively, but given their actual predictive power (independent of one another) her expected IQ is:
0.41(67) -0.18(-25) + 0.18(45) = 27 + 5 + 8 = 40 points above average or 140 (U.S. norms); 139 (U.S. white norms).
However given that all three predictors are quite crude, we can only say with 95% confidence that Martha’s IQ would be anywhere from 115 to 165. Given such a large margin of error we need independent confirmation that Martha’s IQ is around 140.
PART TWO: HISTORIOMETRIC EVIDENCE
Active vocabulary
During an interview with Charlie Rose, Martha used such words as arachidonic, esoteric, arcane, hybridized, soprano suggesting word knowledge in the Very Superior range. Traditionally measures of vocabulary have correlated better with full-scale IQ than any other subtest. However Martha built her empire with such non-verbal skills as folding a fitted bed sheet and artistically displaying food and flowers. This combined with her berating her employee and Yale Law educated husband for inefficiently cutting oranges and stacking fire wood respectively, suggests she also has first rate non-verbal intelligence.
Class rank
On the YouTube interview Life Stories (July 5, 2023) Martha stated “I graduated from a public high school. I was high up in my class. Can’t remember the number but it was good”. Martha was the only girl in the math class. She was not however valedictorian, being surpassed academically by a boy and a girl who shared that title and who young Martha admired greatly, however these two may have had more time to study, unlike Martha who partook in virtually every club and society the school had to offer.
Given that Martha says she ranked high in her class (and was the only girl in math) and can only recall two students who surpassed her, it seems she was the third best student. Given her New Jersey high school class of 1959 had 276 students (mostly of Irish, Polish and Italian ancestry, but only five blacks) (Byron, 2002), Martha would have been in the top one percent. But given that circa 1960, 27 percent of students likely dropped out before graduating and these were overwhelmingly the weaker students, Martha may have actually been the third best out of 378, or roughly the 99.5 percentile (376/378) which rough equates to a 140 IQ; thus validating the biodemographic estimate.