• About

Pumpkin Person

~ The psychology of horror

Pumpkin Person

Monthly Archives: October 2024

Dark humor

30 Wednesday Oct 2024

Posted by pumpkinperson in Uncategorized

≈ 446 Comments

Tags

puerto-rico, trump

I prayed that he would burn in hell, but I knew in my heart that even hell would not take him___Dr. Sam Loomis (Halloween IV)

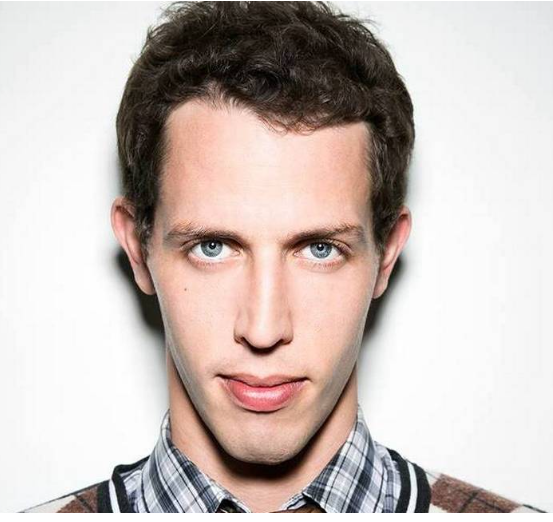
With Halloween only a day away, it’s time to talk about evil. I recently saw a clip of the Trump rally at New York’s Madison Square Garden, and comic Tony Hinchcliffe said “There is an island of floating garbage in the middle of the ocean”…

My ears immediately perked up. I remembered learning about this island of garbage long ago and being devastated by it.

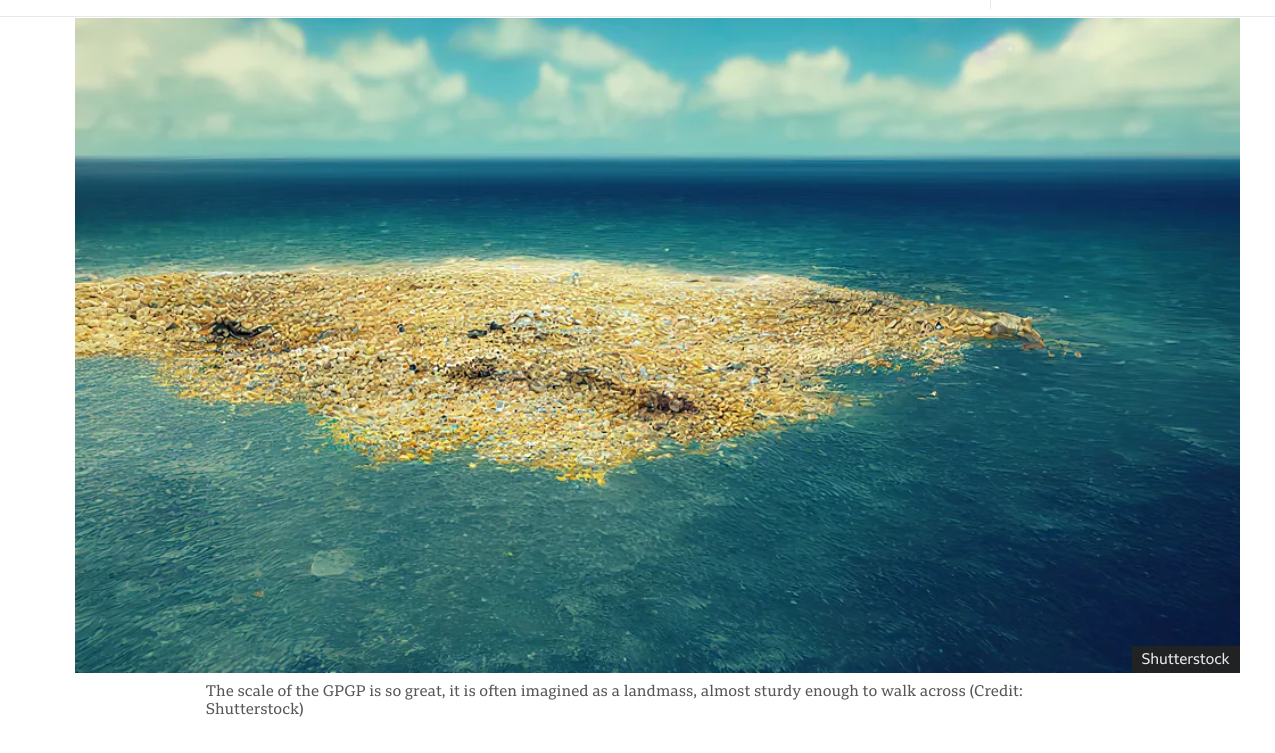
What’s he going to say about the island of floating garbage I wondered. I knew he was a comic so some punchline must be coming. “Well if Democrats didn’t make so make so much crap, we wouldn’t need to throw so much out” I imagined the punchline to be. Something nice and innocent like that. Instead the punchline was something so sick and so evil. I could never have seen it coming.

The whiter you are and lower IQ you are, the more likely you are to vote Trump, but because low IQ people tend to be non-white, IQ puts an upper limit on how white Trump supporters can be, and so for every white who is too smart to vote Trump, you get a minority who is too dumb not to.

Genetic studies show Peuroto Ricans are a hybrid race that is 64% European, 21% African, and 15% Native. I estimate these three races have genetic IQs of 100, 80 and 85 respectively and so Puerto Ricans should have an IQ of 0.64(100) + 0.21(80) and 0.15(85) = 64 + 16.8 + 12.75 = IQ 94. Their actual average IQ as reported by Lynn and Becker is 82 suggesting that their genetic potential has been suppressed by the malnutrition of not living on the U.S. mainland.

It’s very rare to find such a low IQ in a group with so much white ancestry, making them especially at risk for voting Trump, but thanks to Hinchcliffe’s cruel joke, Trump can kiss that vote good bye.

Thankfully Joe Biden came to Puerto Rico’s defense, saying something like “the only floating garbage are Trump supporters”. Now MAGA is trying to act like this was some huge political blunder by Biden, insulting 80 million Americans. Sorry MAGA, you don’t get to be offended. Only liberals have that power.

This is not the first time Team Trump has shown contempt for Puerto Rico. I remember after Hurricane Maria in 2017, when Trump finally flew down to Puerto Rico, he tossed paper towels at the people like they were trash. Instead of expressing sympathy for the hurricane they just endured like you’d expect any President to do, he scolded them for all the tax payer money the Hurricane relief was costing; blaming them for throwing the federal budget out of whack.

Share this:

  • Click to share on X (Opens in new window) X
  • Click to share on Facebook (Opens in new window) Facebook
Like Loading...

Did Trump steal Oprah’s McDonald’s act?

21 Monday Oct 2024

Posted by pumpkinperson in Uncategorized

≈ 241 Comments

I thought it was brilliant of Trump to appeal to working class voters by doing a shift at McDonald’s, but I wonder if he or his team got the idea from watching Oprah (who herself may have got the idea from Letterman).

Back in 2002 the World’s most powerful woman shocked Chicago McDonald’s customers by donning an apron and working the drive thru. Seeing as she’s also arguably the World’s biggest brained woman, I would have expected her to do a more efficient job, but then being too competent would not have made for good TV.

The most interesting part was when one of Oprah’s lawyers complained about the slowest service he has ever had not knowing it was his billionaire boss who was working the cash!

Share this:

  • Click to share on X (Opens in new window) X
  • Click to share on Facebook (Opens in new window) Facebook
Like Loading...

Cold winters & farming: The 2 main selection pressures for IQ

21 Monday Oct 2024

Posted by pumpkinperson in Uncategorized

≈ 53 Comments

By equating polygenic Z scores for education to the IQ scale (mean white score = 100; SD = 15) I was able to tenatively assign very rough “genetic” IQs to 11 populations and a very clear pattern emerges. Those with cold climate ancestry (Mongoloids) average higher IQs than those with temperate climate ancestry (Caucasoids) who in turn average higher IQs than those with tropical ancestry (Negroids).

But within each broad climate category, those who made the neolithic transition average much higher IQs than those who generally remained hunter/gatherers.

So the selection pressures of going from the tropics to Northern Siberia added up to 15 points to genetic IQ on average, but then transitioning to agriculture and subsequent civilization added up to another 20 IQ points.

This makes sense because after 25 million years living as tropical hunter-gatherers, leaving the tropics and adopting agriculture each would have selected for enormous adaptability.

This helps explains why despite our species being a few hundred thousand years old, we didn’t discover agriculture until 10,000 years ago, didn’t invent civilization until a few thousand years ago, and didn’t start the industrial revolution until a few hundred years ago. We were waiting for the IQ points

Rushton writes:

Agriculture ancestryHunter/Gatherer ancestry
MONGOLOIDSEast Asians IQ 105

Native Americans IQ 85
CAUCASOIDSAshkenazi Jews IQ 105

Whites IQ 100


South Asians IQ 95

Arabs IQ 90


Cro-Magnon IQ 80

NEGROIDSBantu IQ 80

Pygmies IQ 80


Australian aboriginal IQ 70


Bushman IQ 70

Share this:

  • Click to share on X (Opens in new window) X
  • Click to share on Facebook (Opens in new window) Facebook
Like Loading...

When did being black stop being a disadvantage?

18 Friday Oct 2024

Posted by pumpkinperson in Uncategorized

≈ 127 Comments

Tags

black-history

Wikipedia has an interesting chart showing how many blacks have been in the U.S. senate at different times over the last 235 years. Amazingly, it seems to consistently average around 0.5 from 1789 all the way to 2010, and then suddenly in 2013, the average triples to 1.5, and even that average has doubled to 3 since 2017. Note that the number of black senators is roughly equal to the percentage of the senate that is black since there’s been 100 senators for well over half a century and there were already 76 by 1870.

Now you may say “AmeriKKKa” is still an incredibly racist country since 14% of the country is black, but blacks have never been more than 4% of the U.S. senate.

However we have to consider that America is arguably a meritocracy, and last time I checked, black Americans are still 15 IQ points to below white Americans, and 13 points below all Americans. This matters because it’s estimated that 41% of the U.S. senate has IQs in the top 1% (+2.33 standard deviations (SD)) and thus the average U.S. senator is around +2.07 SD.

Given that IQ predicts how much power you’ll have in this World (r = 0.45), the median senator is probably +2.07 SD/0.45 = +4.6 SD in power (on a normalized curve), suggesting only one in 473,000 U.S. adults (age 25+) has that kind of power. Cutting that rarity in half, we can infer the the lowliest U.S. senator is at the one in 237,000 level (+4.47 SD). That suggests that of the 232 million Americans aged 25+, about 979 are either one of the 100 senators, or someone even more powerful (a U.S. governor, billionaire, high court judge, President etc).

Now how many of these 979 would we expect to be black? Well, if the average black IQ still tests at 0.87 SD below the U.S. mean (still waiting for the WAIS-5 to release their demographic data), and if IQ correlates 0.45 with power, then the the distribution of black power will be shifted 0.45(+0.87 SD) = 0.39 SD to the left of the overall U.S. distribution. That means that if the odds of achieving at least senator level power are one in 237,000 for Americans in general (+4.47 SD), they will be one in 1.76 million (4.47 SD + 0.39 SD = +4.86 SD) for black Americans. Now given that there are about 32 million black Americans over 25, that’s only 18 people, or 1.83% of the 979 Americans who are at least as powerful as a senator.

And yet prior to 2013, it appears blacks have never been more than 1.3% of the U.S. senate and as recently as 2010, were 0%. What this suggests is that prior to around 2013, there was significant white privilege to the point where even high IQ blacks were outdistanced by equally intelligent whites, despite affirmative action propelling blacks forward.

Then around 2013 it was pretty much a color blind society, with neither blacks averaging almost the 1.83% representation in the U.S. senate that their IQ distribution would predict.

But since 2017, that 1.83% representation has been greatly exceeded on average and it’s arguably been better to be black. We started hearing about people like Rachel Dolezal and Jessica Krug who pretended to be black to get ahead, a stunning reversal of hundreds of years of light skinned blacks desperately “passing” for white to escape racism.

This dramatic change may also explain why in 2008, Barack Obama needed to be more intelligent than most white Presidents to be considered a viable candidate, but in 2024, Kamala Harris is not being held to quite the same standards.

Share this:

  • Click to share on X (Opens in new window) X
  • Click to share on Facebook (Opens in new window) Facebook
Like Loading...

Revisiting Kamala Harris’s IQ

17 Thursday Oct 2024

Posted by pumpkinperson in Uncategorized

≈ 11 Comments

Tags

bar-exam, kamala-harris, LSAT, politics

Of America’s 76 million baby boomers (alive or dead), only three grew up to be President of the United States (so far). If we crudely assume being President is the pinnacle of power, the Presidency puts you at the top one in 25 million level. The median U.S. president would therefore be at the one in 50 million level in power (normalized Z = +5.47). Very tentative data suggests the average IQ of U.S. Presidents is 137 (+2.47), thus suggesting the regression slope predicting IQ from power = +0.45 (very similar to the correlation between IQ and lifetime income).

Biodemographic prediction

As of 2019, there were about 65 million Americans in Generation X, and assuming they resemble Americans as a whole, about 1.8% are Afro-multiracial, which gives 1.17 million people. On a scale where white Americans average IQ 100 with a standard deviation of 15, black Americans average 85, and “pure” U.S. blacks average 80, Afromultiracials would average about 90. If there were a perfect correlation between IQ and power, we’d expect Kamala Harris to have an IQ 72 points higher (one in 1.17 million) than the average Afromultiracial, however since the correlation is only 0.45, we’d expect her to be 72(0.45) = 32 points above the average IQ 90 Afromultiracial, or roughly 122. If true this would put her intelligence in the superior range, though the lower end there of.

However guessing someone’s IQ from only their race and power is unwise. What is needed is actual test data.

Psychometric confirmation?

Harris has no publicly known IQ scores so we’ll have to settle for the bar exam as a crude measure of her intelligence.

Snopes.com reports:

So she scored lower than 72.2% of California law students, suggesting she was in the bottom 27.8% of law students. However the LA Times reports:

So when we subtract that 4,909 people like Harris who took the test the first time, we see 2,088 were repeat test takers (which Harris would become the next year). How many of the repeat takers passed like Harris would the next year? Subtract 72.2% of 4,909 from 59.5% of 6,997. In other word, 619 out of 2,088 or the top 30%.

So despite being in the bottom 27% of all law students for not passing the first time, Harris was in the top 30% of that bottom 27% for not failing a second time. In other words she’d be around the 19th percentile of law students.

“The average national LSAT score for full-time, first-year JD enrollees for fall 2022 was about 159” according to bestcolleges.com. The 19th percentile would be 0.87 standard deviations less so about 150 given the SD on the LSAT is 10. A 150 LSAT would equate to an IQ of 111 or roughly 116 (U.S. norms) in Harris’s day when the average IQ of college grads and by extension, LSAT takers was higher. This converts to 114 using white norms, so 8 points lower than expected for America’s most powerful hybridized black, but still higher than 82% of white Americans.

Of course the Bar exam is not an actual IQ test so this remains only a rough guestimate.

Share this:

  • Click to share on X (Opens in new window) X
  • Click to share on Facebook (Opens in new window) Facebook
Like Loading...

IQ of self-made Presidents vs Legacy Presidents

12 Saturday Oct 2024

Posted by pumpkinperson in Uncategorized

≈ 91 Comments

Self-made PresidentIQ (U.S. norms)IQ (U.S. white norms)Notes
Richard Nixon
154154In 1991, Daniel Seligman wrote “Nixon biographer Roger Morris says RMN tested at 143 on the Otis test when he was in Fullerton High School in California. Nixon attended Fullerton circa 1928 and thus was tested around age 15.

In a 1930 paper by P. Cattell, it’s noted that 108 on the Otis index of brightness equates to the 75th percentile, implying a standard deviation of about 12, which would make Nixon’s IQ a spectacular 154 on the now commonly used sigma 15 scale (white norms since tests in that era were normed only on whites).
Barack Obama
140139Likely scored around 43.5 out of 48 on the 1980s LSAT which equates to an IQ of 148, but reportedly scored 128 on the childhood WISC IQ test (likely 124 after adjusting for norm inflation). A composite score of both tests would be around 140 (U.S. norms)
Average IQ of self-made Presidents (n = 2)standard deviation
147 (U.S. norms)10 (U.S. norms)
147 (U.S. white norms)11 (U.S. white norms)
Legacy President IQ (U.S. norms)IQ (U.S. white norms)Notes
George W. Bush130129National norm studies suggest that if all American 17-year-olds had taken the SAT in 1960 (not just the college bound elite) the mean and SD would have been 784 and 210 respectively, making Bush’s score of 1206, +2 SD or IQ 130 (U.S. norms)
JFK
125 124In 1991, Daniel Seligman wrote about how Kennedy biographer Thomas C. Reeves claimed JFK tested at 119 on the Otis test just before entering Choate Academy. JFK entered Choate around 1931 and thus was tested around age 14.

In a 1930 paper by P. Cattell, it’s noted that 108 on the Otis index of brightness equates to the 75th percentile, implying a standard deviation of about 12, which would make JFK’s IQ 124 on the now commonly used sigma 15 scale (white norms since tests in that era were normed only on whites).
Average IQ of legacy Presidents n = 2standard deviation
128 (U.S. norms)4 (U.S. norms)
127 (U.S. white norms)4 (U.S. white noms)
Average IQ of all Presidents n = 4standard deviation
137 (U.S. norms)13 (U.S. norms)
137 (U.S. white norms)13 (U.S. white norms)

Because sample sizes are tiny, only tentative conclusions can be drawn but based on publicly available data, the average IQ of self-made U.S. Presidents is an astonishing 147 suggesting only one in a thousand (white) Americans have an intellect this high. To come from nothing to become the most powerful person in America (and by extension the World) requires considerable intellect in most cases. This is similar to my earlier finding that the average IQ of all living people to hold the title “richest self-made American” is 151.

Whether measured by money or political power, it seems America is a meritocracy, at least when it comes to IQ. Ethics might be a different story.

To quote the late great Daniel Seligman. “people who are at the top in American life are probably there because they’re more intelligent than the rest of us.”

Given the 0.45 IQ correlation between fathers and sons, we’d expect the sons of self-made U.S. Presidents to be only 45% as far above the mean of 100 as their fathers were, and thus IQ 121. And so it’s not surprising that legacy Presidents average somewhat higher at 127 (white norms). This suggests that even among children born into obscenely rich and powerful families, there’s still some meritocracy, with the smarter ones being able to replicate the achievements of their self-made fathers and the less bright ones, squandering the family legacy.

Share this:

  • Click to share on X (Opens in new window) X
  • Click to share on Facebook (Opens in new window) Facebook
Like Loading...

Quick correction to Obama’s IQ

12 Saturday Oct 2024

Posted by pumpkinperson in Uncategorized

≈ 1 Comment

Tags

law-school, LSAT, politics

After playing the decisive role in electing America’s first black President, America’s first multibillionaire black accepts her medal.

In a previous post I argued that Obama reportedly scored 43.5 on the LSAT, and that since the ratio of whites to blacks in this score range is about 99 to one, it can be deduced that his score equated to an IQ of 129, since that’s the expected ratio of whites to blacks in this IQ range.

However such ratios assume a perfectly normal curve in both races and in fact there might be more blacks with high IQs than the normal curve predicts, because like Obama, many black Americans are not only largely white genetically, but even their black ancestry is hyper-elite, descended from the most educated immigrants, and not from the slave trade.

Because these atypical blacks could skew the numbers, I decided to equate the 1980s LSAT to IQ using the same technique Ron Hoeflin used to equate Mega Test scores to IQ: score pairing.

Using data from nine people with reported scores on both the 1980s LSAT and tests with known IQ equivalencies (SAT/Mega Test), placing scores in rank order from highest to lowest and then equating scores of equal rank, I obtained the following formula for equating the tests:

IQ (U.S. norms) = [(LSAT – 41.5)/4.5](13) + 142

Applying this formula to Obama’s LSAT score of about 43.5 gives an astonishing IQ of 148 (U.S. norms); also 148 (white norms).

The notion that Obama has an IQ pushing 150 is consistent with what Lion of the Blogosphere has been arguing for years, which he based mostly on the fact that Obama graduated magna cum laude from Harvard Law. Though ironically, Obama’s LSAT IQ of 148 would actually have been below the Harvard Law average which at the time would have been about IQ 152.

However given that Harvard Law class was constructed to have an average IQ of 152, they would have regressed to the mean of all LSAT takers (IQ 116) and thus average IQ 138 (U.S. norms), and assuming Obama did not regress (since his score was a random sample of his ability and not an intrinsic property), or regressed to a much higher mean (the mean of self-made Harvard Law star Presidents who wrote first rate memoirs) he’d tower over his classmates intellectually.

However a self-proclaimed former CIA guy claims Obama scored IQ 128 on the WISC IQ test as a child, which after corrections for the Flynn effect, becomes 124. This too is a very high score, but nowhere near 148.

Assuming a 0.61 correlation between the LSAT and the Wechsler, then an LSAT IQ of 148 and a Wechsler IQ of 124 give a composite IQ of 140. Perhaps this is our single best guess.

Share this:

  • Click to share on X (Opens in new window) X
  • Click to share on Facebook (Opens in new window) Facebook
Like Loading...

Harvard Law > Harvard undergrad IQ gap in the 1980s/90s

08 Tuesday Oct 2024

Posted by pumpkinperson in Uncategorized

≈ 190 Comments

Tags

education, Harvard, law, law-school

I’ve blogged about this before but I wanted to revisit it now that I have better data.

Harvard undergrads 1991: SAT IQ 147; expected WAIS IQ 129

Harvard undergrads from the class of 1995 (and thus took their SATs around 1991, had a mean SAT score of 1390. National norm studies suggest that if all American 17-year-olds, not just the college-bound elite, had taken the SAT in this era, the mean would have been 787 with a standard deviation (SD) of 193. Thus by general population standards, 1390 was +3.12 or IQ 147 (U.S. norms); 147 (white norms).

However because Harvard students were selected by SAT scores, they were selected in part for SAT overperformance. We saw this with Dartmouth students who scored only about 61% as well on the WAIS IQ test as they did on the SAT. Assuming the same would have happened to Harvard students circa 1991, instead of scoring 47 points above the U.S. mean, on the WAIS they’d score 47(0.61) = 29, so IQ 129 (U.S. norms); IQ 128 (white norms). Indeed a study by Harvard scholar Shelley H Carson found that in the early 21st century, Harvard students averaged around 130 IQ on the abbreviated WAIS-R and that was BEFORE deductions for inflated norms.

Harvard Law students 1980s: LSAT IQ 152; Expected WAIS IQ 137

I could not find the mean LSAT scores of Harvard Law students from the same era, but I did find a source (see table 7 of this paper) that the top 19 law schools in the 1980s had mean LSAT scores of 40 to 45 out of 48. It is likely that Harvard Law was the law school with a 45 point mean. My own preliminary research suggests that a 45 out of 48 on the 1980s LSAT equated to an IQ of 152 (U.S. norms); IQ 152 (white norms).

They too would regress to the mean except instead of regressing to the general U.S. mean of 100, LSAT takers are pre-selected by university so they would have regressed to the much higher mean of LSAT takers which would have been 116.

  • Average Harvard Law student WAIS IQ = (LSAT IQ – 116)(0.61) + 116
  • Average Harvard Law student WAIS IQ = (152 – 116)(0.61) + 116
  • Average Harvard Law student WAIS IQ = (36)(0.61) + 116
  • Average Harvard Law student WAIS IQ = 138 (U.S. noms); 137 (white norms)

Some readers might argue that if the WAIS-SAT correlation is 0.61, the WAIS-LSAT correlation should be lower, given it’s a more restricted sample, however surprisingly, people who take graduate school admission tests appear to be at least as variable as the general population.

Some readers may wonder why I regress Harvard Law students to the LSAT population when I don’t regress Harvard undergrads to the SAT population but rather the general population. The reason is, above about the top 1%, all members of the general population took the SAT, so regressing them to the SAT population would have been redundant.

Conclusion

Even though the Harvard Law > Harvard undergrad IQ gap was only 5 points when measured by the tests used to select them respectively (LSAT IQ 152 vs SAT IQ 147); the gap should nearly double if they were given a test independent of the admission process (WAIS IQ 137 vs WAIS IQ 128). This is a reminder that we should never measure the IQ of a group by the test used to select them and consistent with the general rule that law students are about 10 IQ points smarter than undergrads, though unlike Harvard, at a typical university circa 1990, the respective scores would have been around 120 vs 110.

Share this:

  • Click to share on X (Opens in new window) X
  • Click to share on Facebook (Opens in new window) Facebook
Like Loading...

contact pumpkinperson at easiestquestion@hotmail.ca

Recent Comments

pumpkinperson's avatarpumpkinperson on Which better predicts populati…
RaceRealist's avatarRaceRealist on Which better predicts populati…
Anime's avatarAnime on Which better predicts populati…
RaceRealist's avatarRaceRealist on Which better predicts populati…

Archives

  • December 2025
  • November 2025
  • October 2025
  • September 2025
  • August 2025
  • July 2025
  • June 2025
  • May 2025
  • April 2025
  • March 2025
  • February 2025
  • January 2025
  • December 2024
  • November 2024
  • October 2024
  • September 2024
  • August 2024
  • July 2024
  • June 2024
  • May 2024
  • April 2024
  • March 2024
  • February 2024
  • January 2024
  • December 2023
  • November 2023
  • October 2023
  • September 2023
  • August 2023
  • July 2023
  • June 2023
  • May 2023
  • April 2023
  • March 2023
  • February 2023
  • January 2023
  • December 2022
  • November 2022
  • October 2022
  • September 2022
  • August 2022
  • July 2022
  • June 2022
  • May 2022
  • April 2022
  • March 2022
  • February 2022
  • January 2022
  • December 2021
  • November 2021
  • October 2021
  • September 2021
  • August 2021
  • July 2021
  • June 2021
  • May 2021
  • April 2021
  • March 2021
  • February 2021
  • January 2021
  • December 2020
  • November 2020
  • October 2020
  • September 2020
  • August 2020
  • July 2020
  • May 2020
  • April 2020
  • March 2020
  • February 2020
  • January 2020
  • December 2019
  • November 2019
  • October 2019
  • September 2019
  • August 2019
  • July 2019
  • June 2019
  • May 2019
  • April 2019
  • March 2019
  • February 2019
  • January 2019
  • December 2018
  • November 2018
  • October 2018
  • September 2018
  • August 2018
  • July 2018
  • June 2018
  • May 2018
  • April 2018
  • March 2018
  • February 2018
  • January 2018
  • December 2017
  • November 2017
  • October 2017
  • September 2017
  • August 2017
  • July 2017
  • June 2017
  • May 2017
  • April 2017
  • March 2017
  • February 2017
  • January 2017
  • December 2016
  • November 2016
  • October 2016
  • September 2016
  • August 2016
  • June 2016
  • February 2016
  • January 2016
  • November 2015
  • May 2015
  • January 2015
  • December 2014
  • November 2014
  • October 2014

Categories

  • ethnicity
  • heritability
  • income
  • Oprah
  • Uncategorized

Meta

  • Create account
  • Log in
  • Entries feed
  • Comments feed
  • WordPress.com

Create a free website or blog at WordPress.com.

Privacy & Cookies: This site uses cookies. By continuing to use this website, you agree to their use.
To find out more, including how to control cookies, see here: Cookie Policy
  • Subscribe Subscribed
    • Pumpkin Person
    • Join 686 other subscribers
    • Already have a WordPress.com account? Log in now.
    • Pumpkin Person
    • Subscribe Subscribed
    • Sign up
    • Log in
    • Report this content
    • View site in Reader
    • Manage subscriptions
    • Collapse this bar
 

Loading Comments...
 

    %d