
So back in 2020, Pew Research asked both Jewish Americans and all Americans about their income. This is an interesting question because in the famous NLSY database used to write the book The Bell Curve, the sample of Jews scored 0.87 standard deviations (SD) higher (13 IQ points) than Americans as a whole on the AFQT. Given about 0.39 correlation between IQ and household income (in a given year) (see table 3), we’d expect Jews to be 0.39(0.87) = +0.34 SD in income.

The normalized distribution of Jewish household income
How close did my predictions come? Hard to say because household income is not normally distributed so applying linear regression to it is problematic.
One theoretical solution is to force income to a bell curve. This I did by comparing the highest and lowest income groups in the poll and finding their respective percentile with respect to both Jewish Americans and all Americans. Each percentile was than assigned its corresponding Z score on a theoretical normal curve.

Thus, if U.S. household income is forced to fit a normalized Z score curve which by definition has a mean and SD of 0 and 1 respectively, the Jewish mean and SD are 0.85 and1.2 respectively, about half an SD higher than expected from the IQ-income correlation.
Of course this is all very rough, because when two different distributions are FORCED to fit bell curves, one can’t assume the two bell curves will fit each other, but this is a very subtle point that few of you have the IQ to worry about.


“X is not Y. But if X were Y, then Z.”
How profound.
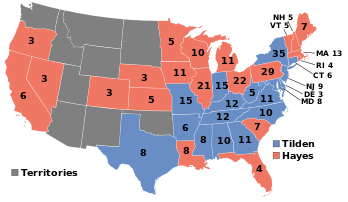
hayes v tilden has 3 of the southern states going GOP.
wtf?
aka voter supression!
“but southerners vote GOP” says moron.
they do now moron!
have you ever heard the expression “the solid south”?
or “yellow dog democrat”?
to this day 2022 there are wypipo southerns who vote dem or don’t vote because lincoln was GOP.
idiot!
one of the gestures of deconstruction is not to naturalize what is not natural.
the sun rises in the east and sets in the west…
oprah’s powers can’t change it.
11’s can’t either.
sad.
Those income numbers are not adjusted for cost of living/place of residence I assume? All else equal people who live in big cities earn more, right?
Also, that study was on individual income, so family income might have a different correlation.
The study correlating IQ and income used household income. They did not adjust for cost of living, nor should they in my opinion because presumably people are getting something in return for high living costs.
“The study correlating IQ and income used household income.”
My bad.
“presumably people are getting something in return for high living costs.”
Yes, but part of that something is higher wages in high cost-of-living places.
The reason that Germanic Americans are more likely to live rural areas is not because they’re dumber than say Italian Americans or Irish Americans but historical reasons, I think you’ll agree? And yet judging by nominal incomes they could very well appear so.
no one cares.
rome is the truth.
i agree it’s sad.
but it’s also a metaphor.
001 will be saved.
eventually.
right!
the totally bizarre thing about this from peepee’s perspective is…
everyone is saved. everyone has his “soteria” sucked out by 11. and…
https://en.wikipedia.org/wiki/Soteriology#Christianity
sorry,
imagine you’re trying to spread a religion…
because allah
because buddha
WRONG!
STILL HIKKUPS…
my harvard lawyer dad did teach me one thing which you can try yourself….
hiccups…
1. bend over…all the way….
2. drink drink drink…
3. take a spoon full of sugar..
4. stand up
it literally ALWAYS
“but this is a very subtle point that few of you have the IQ to worry about””
You think you are so smart pp.I challenge you to do a varimax rotation of principal component analysis of oprah. You can physically rotate her if you want while doing so. You need to post a video doing it.
Only then I will accept your superior intelligence.
and even worse than the low IQ is the anti-roman-ism.
i unnuhstan more gullah than i can fucking speak you dig?
Jesus replied, “Blessed are you, Simon son of Jonah! For this was not revealed to you by flesh and blood, but by My Father in heaven. And I tell you that you are Peter, and on this rock I will build My church, and the gates of Hades will not prevail against it. 19I will give you the keys of the kingdom of heaven. Whatever you bind on earth will be bound in heaven, and whatever you loose on earth will be loosed in heaven.”
And I say also unto thee, That thou art Peter, and upon this rock I will build my church; and the gates of hell shall not prevail against it.
can you imagine a world without rome?
right! no one can!
the eternal city.
in the next recommended vid dalio says “crisises”. i heard this at some davos roundtable too. by a native english speaker.
it’s interesting because the same people who write the wiki on Stranger Things and say “…byers’…” to mean “…byerses’…” also say “crisises”.
i’m tired of having english major parents!
when super billionaires can’t get it right…
then i can tell myself…
i’m so U i’m poor.
all the rich people are non-U.
https://en.wikipedia.org/wiki/U_and_non-U_English
The best predictor nowadays is whether someone knows when to use “good” and “well.”
btw, for the IN-cognescenti…
the plural of crisis is crises.
NOT “crisises”.
yet these same people claim it’s too hard to say Xerxes’s. never mind that there was more than one Xerxes and thus the same phonically speaking “Xerxeses”.
“crisis” is a transliteration of the greek word “κρίσις”.
so naturally it takes a non-anglo-saxon plural form…
CRISES!
supposedly in early modern english “Xerxes’s” would’ve been “Xerxes his” and this was contracted, elided to “Xerxes’s”. or that’s what my professor told me. i did take two courses on the history of english…that is, the language. taught by a professor of linguistics, not english. but he was a native english speaker.
it’s interesting. pnw english speakers, like me, can’t hear the difference between the IPA upside down “c” and the “ah” sound.
no. the federal government was intended to be very limited. so who the president was…no one cared…why would they?
my dad was a liberal who said he’d walk to dc just to uphold roe, but he also thought that homosexuality was a mental illness that should still be in the DSM.
that was old harvard.
the point is:
tradition is like buffalo head plowing through magma.
the point is:
tradition is like buffalo head plowing through magma.
deal with it!
wtf does this mean?
my earliest memory.

This reminds me of a game I used to play for the Sega Mega Drive called Golden Axe.
Robert’s election theories are bullshit. Just like all his other conspiracy theories. Robert gives conspiracy theorists like me a bad name. Copying and pasting Alex Jones into Puppy’s website should be banned.
Alex Jones looks morbidly obese and I wouldn’t be surprised if he had heart problems and died young.
Robert has bad judgement. Theres nothing we can do to improve that. If I look at a story and he looks at the same story he will draw stupid conclusions from that story. How can someone have a math degree and have terrible judgement? Maybe hes mentally ill in some way.