
It would be nice to get NAEP type data from every ethnic group because of the large representative samples of test prepared people who take these tests. It would be especially nice to get such data from post-apartheid South Africa and the statistics below come close.
According to a report
The outcomes of black learners are poorer compared to their coloured, Indian, and white counterparts. For example, in 2016 the proportion of black learners who passed maths with 60% or more was 9%, By contrast, the proportion of whites passing with more than 60% was 52% (the
proportions for coloured and Indian pupils were 20% and 40% respectively). In maths literacy, the figures are even starker – only 8% of black learners passed with a mark of above 60%, compared 20% of
coloured learners, 44% of Indians, and 73% of white learners. Figures for other subjects show similar trend
If we assume maths literacy is a proxy IQ test and force the distribution of all groups onton normal curves with an SD of 15, we get:
South African white IQ = x
South African Indian IQ = x – 11
South African Coloured IQ = x – 21
South African Black IQ = x – 30
But what is x?
We know that South Africa is about:
- 80.7% Black African
- 8.8% Coloured
- 7.9% White
- 2.6% Asia
And we know that their average score on international math tests is about 73. Thus solving for x:
0.807(x – 30) + 0.088(x – 21) + 0.079x + 0.026(x – 11) = 73
0.807x – 24.21 + 0.088x – 1.848 + 0.079x + 0.026x – 0.286 = 73
x = 73 + 24.21 + 1.848 + 0.286
x = 99
So if the white Math IQ is 99, then the IQs of the other groups can be deduced.
| Ethnicity | IQ (based on the percentage of each population scoring 60%+ on maths literacy relative to the white rate) |
| whites | 99 |
| Indians | 88 |
| Coloureds | 78 |
| Blacks | 69 |
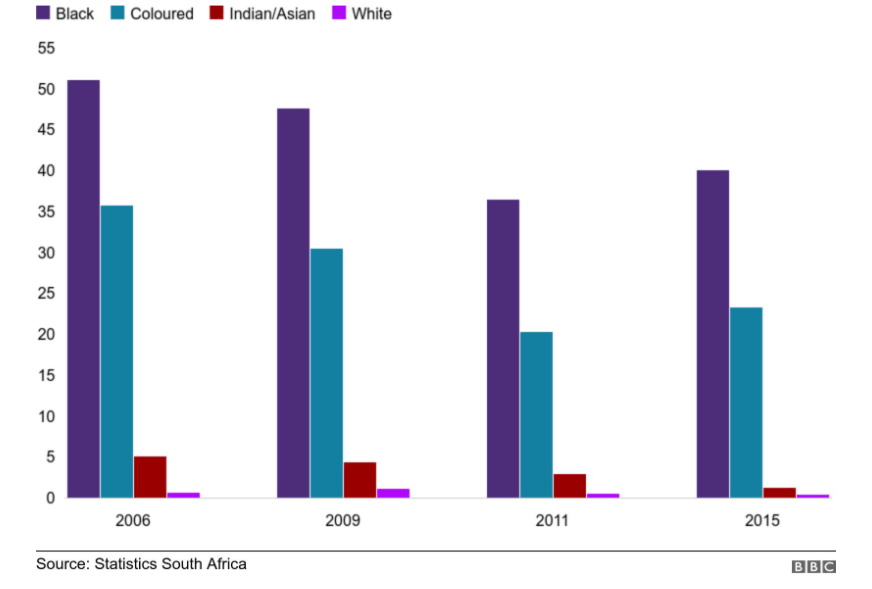
Of course given the legacy of apartheid and the huge differences in living standards and education quality between these groups, it would be very stupid to take scores on a math test as reflective of actual intelligence, let alone genetic ability. As of 2015 it looks like the percentage of Blacks, Coloureds, Indians and Whites living in poverty is about 40%, 24%, 2% and 0.5% respectively (crude guesses based on eyeballing the below graph):

It was the content of Justice Scalia’s reasoning that shaped me,” she is expected to say. “His judicial philosophy was straightforward: A judge must apply the law as written, not as the judge wishes it were. Sometimes that approach meant reaching results that he did not like.”
I think they call this textualism which is what I’m against. I’m in favour of the law ‘as intended’ which means an enforcer of the law, whatever that may be, can adjust depending on the exact scenario which a law can’t always foresee.
I have zero doubt in my mind the supercomputer in arizona monitoring everyone’s phone convos is legal by any approach you take to the constitution, even Swanks approach.
It’s probably constitutional, but you’d hate to think how it’s gonna be put to use in 20 years when the J-left has a permanent, one-party monopoly on the federal government.
Sorry my mistake. I meant its illegal. The supercomputer is an abomination.
yes. textualism is autistic. scalia actually said he would apply the law “as written” even if he knew the intention and peshat were different and there was simply a typo or mistake in drafting. but he was a short, fat, hairy, swarthy, greasy southern italian.
but when for whatever reason the original intent can’t be determined even a little bit then textualism and original meaning are the next best thing.
yeah it’s absurd. there’s a right to abortion because “unreasonable search and seizure” but no right not to have your conversations audited by the govt.
i myself am pro abortion in many cases but roe v wade was a retarded decision just like obergefell. whatever you think of gayness, there’s a very fundamental asymmetry between opposite sex couples and same sex couples. namely the former can have children, their own children. so yes barring marriage to infertile people is also permitted.
As of 2015 it looks like the percentage of Blacks, Coloureds, Indians and Whites living in poverty is about 40%, 24%, 2% and 0.5% respectively (crude guesses based on eyeballing the below graph):
at least 10% of white south africans are poor peepee-tard.
But not in poverty Mug of Tard
“in poverty” = poor.
AT LEAST 10% OF WHITE SOUTH AFRICANS ARE IN POVERTY.
jesus fucking christ. do you speak ANY language at all?
No poverty = EXTREMELY poor
My English is better than yours. Your vocab is way better but I use words more efficiently than you do. I scored in the 99.9 percentile on written expression & was worshipped by my English teachers.
Established as an arm of the Department of Defense following Pearl Harbor, with the primary purpose of preventing another surprise assault, the NSA suffered a series of humiliations in the post-Cold War years. Caught offguard by an escalating series of terrorist attacks—the first World Trade Center bombing, the blowing up of US embassies in East Africa, the attack on the USS Cole in Yemen, and finally the devastation of 9/11—some began questioning the agency’s very reason for being. In response, the NSA has quietly been reborn. And while there is little indication that its actual effectiveness has improved—after all, despite numerous pieces of evidence and intelligence-gathering opportunities, it missed the near-disastrous attempted attacks by the underwear bomber on a flight to Detroit in 2009 and by the car bomber in Times Square in 2010—there is no doubt that it has transformed itself into the largest, most covert, and potentially most intrusive intelligence agency ever created.
https://www.wired.com/2012/03/ff-nsadatacenter/
This person writing the article is totally autistic. OF COURSE the reason theres a supercomputer monitoring every piece of information isn’t meant to stop terrorism. HAHAH Most of these cases of terrorism involved technology no more sophisticated than a transistor radio. How the fuck was a supercomputer meant to stop that??
The ORIGINAL INTENT of creating the supercomputer is to find information on certain individuals which can be used to blackmail them. In my opinion. The people that had the whole idea behind it HAD ZERO interest in finding terrorists. They created it to destroy or find domestic enemies.
“Fighting Terrorism” – Thats the line they give children and people with intellectual disabilities….
This person writing the article is totally autistic
Projection ain’t just a tool in the Stone Age
Most conservative whites and men continue to support two of the worst presidents in the history of Brazil and the USA respectively. This seems to be a kind of intellectual disability ..
Someone commented on why the leak of SARs went to Buzzfeed. I didn’t want to say it because I’m supposed to be a boring idiot who likes immigration/’diversity’ in my professional life, but obviously the person must have thought that most mainstream media were compromised and in the hands of the people he wanted to expose by leaking the SARs.
https://www.buzzfeednews.com/article/jasonleopold/fincen-files-financial-scandal-criminal-networks
The NSA has this giant-ass supercomputer that Skynets every bit of information on the Internet and yet people still get away with downloading child porn and spinbotting in Counterstrike. Something is wrong here.
Must exist a final plan for reich wing beasts
https://www.vox.com/2020/10/9/21509239/gretchen-whitmer-kidnapping-plot-wolverine-michigan-governor
What ethnicity are you santo – east asian?
He’s obviously not East Asian. Your intuition is so bad.
Based on apricity site i’m med alpine…
Pumpkin, is what Billy says about Verbal IQ correct, that it’s not a measure of verbal skill but merely called verbal IQ because of the method of testing?
One psychologist tried to make a culture fair verbal test that used no words. It would be interesting to factor analyze it to see if it clustered with verbal or non-verbal tests
Alien bible!
https://images.app.goo.gl/9zXuwmEaCVU4cH1c6