
Back in 2016 I wrote:
A study by Meredith C. Frey and Douglas K. Detterman found a 0.48 correlation between the re-centered SAT and the Raven Progressive Matrices in a sample of 104 university undergrads, but after correcting for range restriction, they estimate the correlation to be 0.72 in a less restricted sample of college students. I don’t buy it, but I’m not interested in how well the re-centred SAT would correlate with the Raven among college students, but among ALL American young adults. (including the majority who never took the SAT).
Using the Frey and Detterman data, I decided to look at the Raven scores of those who scored 1400-1600 on the re-centred SAT, because 1500 on the new SAT (reading + math) corresponds to an IQ of 143 (U.S. white norms), which is 46 points above the U.S. mean of 97. Now if the new SAT correlated 0.72 or higher among ALL American adults, we’d expect their Raven scores to only regress to no less than 72% as far above the U.S. mean, so 0.72(46) + 97 = IQ 130.
I personally looked at the scatter plot carefully and did my best to write down the RAPM IQs of every single participant with an SAT score from 1400-1600. This was an admittedly subjective and imprecise exercise given how small the graph is, but I counted 38 top SAT performers and these were their approximate RAPM IQs: 95, 102, 105, 108, 108, 110, 110, 113, 113, 113, 113, 113, 117, 117, 117, 117, 117, 120, 120, 120, 122, 122, 128, 128, 128, 128, 134, 134, 134, 134, 134, 134, 134, 134, 134, 134, 134, 134
The median IQ is 120, and it does not need to be converted to white norms because the Raven was normed in lily white Iowa circa 1993, but as commenter Tenn noted, I should have perhaps corrected for the Flynn effect since the norms were ten years old at the time of the study. Correcting for the Flynn effect reduces the median to 118 (U.S. white norms) which is 21 points above the U.S. mean of 97.
For people who are 46 IQ points above the U.S. mean on the new SAT to regress to only 21 points above the U.S. mean, suggests the new SAT correlates 21/46 = 0.46 with the Raven in the general U.S. population.

I maintain that the SAT only correlates 0.46 with the Raven in the general U.S. population, however it now seems that this mediocre correlation may be more the fault of the Raven than the SAT.
In a 2017 study by Dimitri van der Lindena, Curtis S. Dunkelb, Guy Madison, the Raven was found to have a g loading of 0.609 in 900 American healthy young adults.
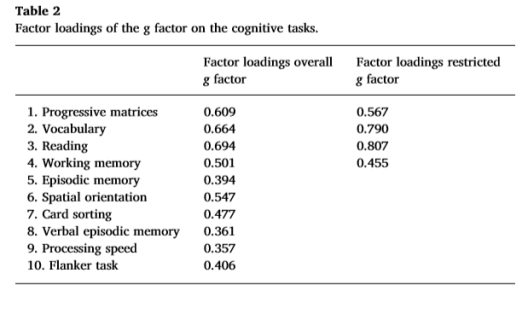
As Arthur Jensen has noted, the correlation between two tests is a product of their factor loading, so assuming the SAT and Raven have only the g factor in common, the estimated 0.46 correlation between the SAT and Raven, (if all American young adults took the SAT), implies the SAT has a g loading of 0.46 divided by the Raven’s 0.609 g loading.
Thus the SAT may have a high g loading of 0.76!

they estimate the correlation to be 0.72 in a less restricted sample of college students.
that’s as well as any IQ test correlates with another IQ test.
I don’t think adjusting for range restriction works on the SAT because the people who take it are restricted in more than just ability, and 0.72 is way lower than the correlation between the Wechsler and the Binet or even the Wechsler and the WIAT
Only a complete moron could think a test that people prepare & study for & that only measures two abilities is more g loaded than the WISC
RR & bill cosby are two examples of how people with poor schooling can dramatically underperform their IQ on the SAT
i posted the study peepee.
i guess the psych profs who did the study were complete morons.
what are rr’s and bill cosby’s IQ? you don’t know. you’re just LYING again.
RR scored 108 on an official IQ test and 60 on the SAT.
Cosby scored around 125 on an official IQ test but 80-85 on the SAT.
Why do you get so angry when someone suggests official IQ tests could be better than the SAT?
The only reason I pick on the SAT is because I hate the idea of America being a testocracy and prefer to think the correlation between IQ and success occured naturally instead of being socially engineered.
I have no personal dog in this fight. SATs are not used in Canada.
NOT ONLY DID I POST IT. YOU WROTE ABOUT IT.
[redacted by pp, july 13, 2018]
I fully agree that the SAT can be more g loaded than the Wechsler in subpopulations, but not in the general U.S. population. In this sense it’s the opposite of other tests which become more g loaded as range is increased. My point is the Wechsler would be better for comparing Bill Cosby to Barack Obama, but the SAT would be better for comparing Paul Allen to Bill Gates.
RR scored 108 on an official IQ test and 60 on the SAT.
Cosby scored around 125 on an official IQ test but 80-85 on the SAT.
what tests? show me!
what’s an “official IQ test” [redacted by pp, july 13, 2018]
All the tests I took.
WISC-3 Age 12 score 125 (2001)
Kaufman Adolescent & Adult Intelligence Scale
Age 14 score 113 (2003)
WAIS-3 Age 21 score 108 (2009)
WAIS-4 Age 28 score 113 (2016)
WAIS-4 Age 30 score 108 (2018)
the SAT is sampling mostly from the top half of the bell curve, so the joint distribution should NOT be bivariate normal. normalizing doesn’t fix this problem. [name redacted by pp, july 12, 2018]. thus pearson’s r is an inappropriate measure in the first place. the relationship should NOT be linear.
Even if you’re right (and you’re not), still doesn’t change the fact that people who are geniuses on the SAT are mediocre on the Raven. That’s the crux of the issue.
What does it mean to be a genius on the SAT? Math/Verbal?
Ravens is an abstraction which means holding many variables in mind at once.
Find the ruleset for solving the convergent answer.
SAT you learn rules also.
Harder problems demand more complex rulesets Ravens and SAT.
SAT is more crystallized than the Ravens which is more Fluid.
You sound like a social science undergrad who has taken only one stats class.
You’re one of the few people here who has never scored high on an actual IQ test & thus depend on proxy measures to boost your self-esteem & thus go ballistic everytime these proxy measures are questioned, however gently.
It’s so embarassing. You’ll never get over getting only one 19 on the WISC
one of the few? no one here has ever taken an IQ test except anime kitty.
do you even know when you’re lying?
Is 125 considered a high score on the WISC-3 age 12?
I guess not because I have only 16’s, never got even one 19
It’s not high enough for gifted programs but it’s what I estimate Mug of Pee scored at age 10. It’s rare that someone with only one 19 scores 130+
Our very own G-man got two 19s
that’s not true. i took an ‘official IQ test’ twice after being identified as a potential candidate for gifted education in elementary school and then the next time in middle school (we had moved to a different state). i was placed in gifted education both times. and the cut-off is typically 98th-tile.
i didn’t, and still don’t, care about it. i don’t have the records. my family didn’t care much beyond ‘hey, that’s great.’
only high neuroticism people or people concerned with status seem to care a lot about IQ.
and it certainly hasn’t saved me from being called stupid!
most people equate making mistakes with low intelligence, especially when new ideas are being brought out or communicated. but as with anything social, collaboration brings out the good in an idea.
imagine if Newton would have been a black guy who said he’d published calculus proofs some 20 years prior.
exactly.
i too was given an “official IQ test” and was put into the gifted program at age 8. that test was not the WISC.
[redacted by pp, july 13, 2018]
that’s not true…
again with the jewishness. the point is no one here except me and anime have talked about IQ tests we’ve actually taken until you just did. and both of us made high scores.
[redacted by pp, july 13, 2018]
but i will say this…it’s been true so many times i know it’s a thing…
i am a fast learner, but not especially fast. what i am is a very good learner. that is, i learn in a way such that once i learn it it’s with me FOREVER.
this is the learning style which leads to very high IQ and other achievement test and cumulative exam scores. it’s NOT everyone’s style.
1470 = IQ 138
0.72(41) + 97 = IQ 126.52
I got 120 on the Ravens
(g) is 130
0.76(41) + 97 = (g) 31.16
As Arthur Jensen has noted… and he’s wrong as usual.
peepee doesn’t even mention the raven’s low ceiling in the above plot [redacted by pp, july 12, 2018]
Actually I went into great detail about Raven ceiling effects
[redacted by pp, July 13, 2018]
31% of the SAT/RPM takers scored at or above 134.
the RPM is known to correlate with other IQ tests the worst.
the correlation of the SAT with the WAIS and SB should be higher than with the RPM because the latter two also include verbal questions like the SAT. what was the correlation between the SAT M and the RPM?
recall also that the BGI people are complete morons too.
peepee herself says the SAT correlates near perfectly with general intelligence but only in special populations.
[redacted by pp, july 13, 2018]
the population coyle studied is no more special than the one studied by f&d.
CHECKMATE
GAME OVER
[redacted by pp, july 13, 2018]
what is the difference between an “official IQ test” and an un-official Q test?
1. an “official IQ test” calls itself an IQ test.
2. an “official IQ test” is normed on no more than 2,500 people.
3. an “official IQ test” is normed on a representative sample of the entire population or perhaps of whites.
4. an “official IQ test” is expensive and administered by a psychologist one on one.
1. an un-official IQ test is not called an IQ test for political reasons.
2. an un-official IQ test is normed on millions.
3. an un-official IQ test is normed on a sample from a select population. the sample is a significant fraction of the select population.
4. an un-official IQ test is cheap and is administered in groups without any input from the examiner.
a battery of GCSEs was also found to have a g-loading nearly as high as any “official IQ tests”, but again GCSEs are taken by a select population.
In a longitudinal English study, g scores measured at age 11 correlated with all the 25 subject tests of the national GCSE examination taken at age 16. The correlations ranged from .77 for the mathematics test to .42 for the art test. The correlation between g and a general educational factor computed from the GCSE tests was .81.
the US isn’t a test-ocracy because high test scores are only necessary. they are NOT sufficient. all of america’s elite schools routinely reject applicants with very high scores, scores significantly above the mean of those they admit. i’m NOT the only one.
china, japan, s korea, singapore, india, the uk, france, russia, basically almost every other country IS A TESTOCRACY.
[redacted by pp, july 13, 2018]
The correlation between g and a general educational factor computed from the GCSE tests was .81.
pretty much identical to the 0.77 g loading I am claiming for the SAT. And notice that 0.81 is not the correlation between g and GSCE scores but g and the g of the GSCE scores (something that never gets calculated and is not used to get into university)
Is chess an unofficial IQ test too? It’s normed on millions of people in a select population.
yes! there is such a thing as chess talent, but chess is like the RPM, it’s like one subtest of a battery, one type of question.
so if the old SAT had just been antonyms then it would be like chess just more g-loaded.
oh believe me…you can study until you throw up…if you don;t have the talent you’ll never be a grandmaster…
of course this proposition does NOT hold if you start studying intensely at a very young age like the polgar sisters.
capablanca NEVER studied and he is still to this day the most accurate player of all time. at his best (in the 1920s!) he is still the best player who has ever lived.
I would say “end games” would be one subtest, like “antonyms”. Openings would be another subtest, like “reading comprehension:
The verbal SAT is analogous to a scrabble tournament and the math SAT is analogous to a chess tournament. In a society where these two games were taught all day in school from K to 12, a composite score of both of them might be just as g loaded as the SAT.
I do think the SAT is highly g loaded, just not as g loaded as the Wechsler, because the Wechsler contains more novelty, more diversity, and goes out of its way to be fair to people who didn’t learn much in school.
I could be wrong though because I’m estimating the SAT’s correlation with the Raven from regression, while the Wechsler’s correlation with the Raven was measured directly. Different methods can give different results.
I WILL REPEAT IT.
OFFICIAL IQ TESTS ARE SUPERIOR ONLY IN THAT THEY ARE BETTER AT ASSIGNING IQ POINTS TO PEOPLE WITH LOW IQs.
BUT THEY ARE INFERIOR AT ASSIGNING IQs TO PEOPLE WITH HIGH IQs.
IF THE SAMPLE IS ONLY 2,500 THEN ANY SCORE EXCEEDING 150 IS GOING TO BE FOUND BY EXTRAPOLATION.
THE OLD SAT ONLY HAD LIKE 2 PERFECT SCORES PER YEAR. THE GMAT STILL HAS FEWER THAN 10.
THE COMPUTER ADAPTIVE NATURE OF THE MODERN TESTS GIVES THEM A VERY HIGH CEILING.
No SATs are only better at comparing people with very similar education backgrounds. IQ tests are better at comparing Americans from wildly different walks of life.
and the fact that people prep for a test is irrelevant because…
1. almost everyone preps for high stakes tests.
2. the evidence is it has little effect on scores. (this doesn’t mean it can’t help a few people a lot. it just means the average improvement is close to 0.)
3. people vary in their preparation for “official IQ tests” just by living in the country the test was made in. they will have done similar (just not identical) things before, or not.
Conventional IQ tests have so much diversity and include so many relatively novel items that preparation is less of an issue than for the SAT which measures only reading and math. And the college board has a vested interest in saying test prep doesn’t work. I don’t buy it. Everyone in the chess club prepares for chess tournaments. Are chess ratings a valid IQ score?
They’re still tests of middle class knowledge and skills.
Oh god…
It would be interesting to try to understand why some people benefit a lot from test prep and others don’t. From what I’ve seen online discussion forums and in real life, anywhere from10-20% of test peppers improve more than a standard deviation on tests like the GMAT, LSAT, GRE because of prep. But why? The correlation with time spent prepping seems weak (based on what I’ve seen).
And for grad level tests, it’s true that most of the test-taking population engages in some form of prep. Probably around 80%.
I don’t think there’s ever been any wide-scale study of test-prep because the companies are financially committed to the idea it doesn’t do anything.
companies meaning the test-makers….
by “prep” i just mean hardly anyone goes into the test not knowing anything about it. ETS sends example questions to everyone.
the fraction of SAT takers who don’t know beforehand that there’s a verbal section and a math section has got to be close to 0%.
IQ experts seem to underestimate the eliteness of the samples for those who take tests like the SAT, LSAT, GMAT
I wouldn’t be surprised if the real testing pool IQ of the GMAT had a mean of something like 115 — even though it’s probably not generally thought of as that high.
perhaps especially considering that something like 1/4 of MBA applicants have UG degrees in engineering, much higher than that of UG degrees in general.
and applicants to law school will have a mean of 125 VIQ maybe.
a perfect score on the LSAT is also extremely rare…or used to be.
My renormed SAT score a few years back before they changed it was a 730 in Math and a 710 in Reading. Its true though that studying affects the Math portion more than the Reading. Reading is fairly stable when retaken in my observation.
I had the exact opposite experience with the SAT verbal. In high school i memorized some vocab lists and my score shot up 100 points in a few weeks.
Meanwhile my math score barely budged even tho I was taking Calculus and SAT practice tests.
Apparently improvements can only happen if you are reviewing answers you got wrong. Just doing shit over and over again doesn’t help.
Cambridge university has a psychometrics center that proposé many tests on face recognition. I started bottom 10% with severe prodopagnosia. Second test I was slightly above average . Third one I was in top 10% with high facial abilities .
The truth is that I was concentrating myself on details but I had never the feeling I was actually « recognizing » the people. I am pretty sure of what means recognizing two faces are the same and I never really had that while getting good results .
That could be the same for prep. Maybe people can simulate logical reasoning without really getting it …
What about the l study where Harvard students regressed to the mean with respect to their SAT scores (I’m assuming they scored 1400-1500) to an average IQ of ~122.
Side note: couldn’t find the comment but remember reading something about figure weights g-loading. To me it looks the same as asking algebra equations. If similar problems were given on the SAT, that is, instead of figure weights the algebraic representations, would you expect the g-loading to be high, similar to 0.7 like figure weights? I’m assuming everyone who takes the SAT knows basic algebra so that wouldn’t be a conflating factor
Regarding the study I just mentioned, maybe that would rule out your regression to the mean argument of raven’s lower validity because it under predicts the iq scores of those high sat people. The other study showing the actual g loading is def stronger evidence.
That study suggests a lower g loading for the SAT.
Most of the folks who get into Harvard study for the SAT, hence, the IQ to SAT estimate isn’t good in this situation. However, I’d think that if these folks took the SAT without studying, they’d be in the 120s.
Pumpkin, if you were to study your ass off for the SAT, improved your score from 1200 to 1400, if you take the SAT a year later, would you still get a 1400, or will it regress back to 1200.
the fact that your denying IQ paradoxically means you have hi IQ.
Puppy if a man takes the SAT on tuesday, the LSAT on wednesday and the GRE on friday, does that mean the man should take the GMAT on Sunday?
Did you know Paul Cooijmans’ has estimated that RAPM has a negative g loading, at least in the high range?
https://iq-tests-for-the-high-range.com/statistics/others/rapm.html