
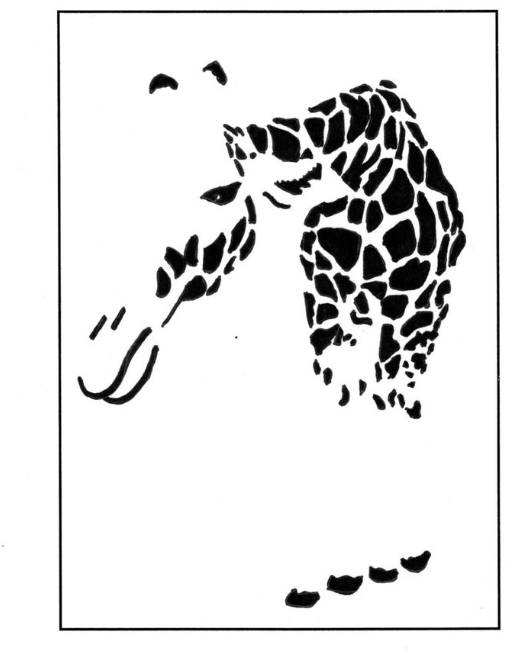
As part of my research for an imminent article on commenter Bruno’s IQ, I decided to try to norm brief little test he took which was posted by commenter Mug of Pee. The test requires you to correctly perceive what’s in each of the following images. Unfortunately the test was too easy to say much about someone as brilliant as Bruno but most people find it challenging , so try it on yourself for fun before looking at the answers and scoring which are located way below the four images:
Item 1
Item 2

Item 3

Item 4

Scroll down if you are ready to see answers
.
.
.
.
.
.
.
.
.
.
.
.
Scoring
Item 1: If you correctly identified this as a giraffe, you get 1 point. If you identified it as some other striped or spotted mammal like a cheetah, a leopard (including panther), or a zebra, you get 0.5 points. Preliminary research shows that somewhere between 93% to 100% of white adults can get at least half-credit on this item, and 86% can get full credit.
Item 2: If you correctly identified this as a dog, you get 1 point. If you identified it as some other four legged mammal like a pig, you get 0.5 points. Preliminary research shows that 36% of white adults can get at least half-credit on this item, and 29% can get full credit.
Item 3: If you correctly identified this as a man on a horse, you get 1 point. If you could only see a horse but not the man on it, you get 0.5 points. Preliminary research shows that 29% of white adults can at least get half-credit while only 14% can get full credit. No credit for seeing a man but not a horse.
Item 4: If you correctly identified this as Jesus, you get 1 point. If you could only identify it as a human face, without know who’s, you get 0.5 points. Preliminary research suggests that 21% of white adults can at least get half-credit, while only 14% can get full credit.
Note: Give credit if you could see a credited answer, even if you also saw a few wrong answers, and weren’t sure which was correct
Total raw score: Sum of partial and full credits on all 4 items.
Maximum raw score: 4 points
Norms
My stats for this test are based on the fact that earlier this month, I tried this test on a relatively random sample of 14 white adults in different parts of Ontario.
Their scores out of 4 listed from highest to lowest were: 3.5, 3, 2.5, 2.5, 2, 2, 1.5, 1, 1, 1, 1, 1, 0.5, 0.5. The mean was 1.64 and the population standard deviation was 0.95. Using the mean and SD, any raw score can be converted to a Z score and Z scores can be converted to IQ equivalents by multiplying the Z score by 15 and adding 100, but don’t take the results too seriously because this test is way too short and simplistic to be meaningful and I’m not a professional.
But for entertainment purposes only, here are what the IQ equivalents would be:
Raw score 0 = IQ 74 or lower (borderline mental retardation)
Raw score 0.5 = IQ 82 (Dull)
Raw score 1 = IQ 90
Raw score 1.5 = IQ 98 (Average)
Raw score 2 = IQ 106
Raw score 2.5 = IQ 114 (Bright)
Raw score 3 = IQ 121 (Borderline Genius)
Raw score 3.5 = IQ 129
Raw score 4 = IQ 137+ (Mild Genius)

I don’t know if it makes any sense to comment here, now, but I either got 3 or 3.5 if my thinking the horse (which was my first guess) was a zebra (because of the stripes-like shapes, similar to the giraffe) counts as correct. Or even 3.75 or 4 if my thinking that because it’s a zebra, there couldn’t possibly be anyone on top of them excuses my blindness to the human. But let’s be honest..it’s 3.5 at best. More importantly, I’m obsessed with this site. Fascinating work through the years. Thanks, pumpkinperson!
PS: It’s funny how some people didn’t see Jesus yet he sees us aaallll haha
How did you get average of 126 here? I tried to do the averaging and got a 120.
You are right Rahul it has probably moved and it’s 120,19 now. And even if you unlock ceiling effets you supposed that the top group had an average of 150 – wich I doubt – it would to 123.59.
Maybe the 352 test takers don’t exactly reflect the usual readers and commenters (who are more like the 174 Patma scores test takers).
It would make sense to have a 125 average IQ core readership and an equal amount of people who sometimes are attracted by google to a catchy post or by a funny test, and those would have an average 115 IQ.
More people might have taken it the last time Pumpkin counted.
even in Pumpkins original norms, how did he get a 126? The median of the gestalt data is still at a 121. The median is probably the best measure for the average since we the distribution on the blog probably isn’t normal
Pingback: Anecdotes re: autism, number of details in a Gestalt test, cartoons, and real-life functioning | Aeoli Pera
That was quite fun. I’ve been looking on the internet for more after doing this. I didn’t get the man on the horse, all I could see was an exasperated woman haha. I saw it once it was pointed out in the answers though. I imagine there is a cultural thing at play here because the man on the horse was, to me, the most abstract of the lot in terms of design and concept. We’re used to faces/animals so we’re primed to see them. Anyways, I really enjoyed the test and have been enjoying your blog too. 🙂
Fantastic!