Great of Chris to respond because there’s not a person I can think of whose World class IQ has been more authenticated, first by the legendary Ron Hoeflin and than independently by ABC news! I encourage everyone to check out his X account and let me know what you think about the extremely provocative content. It makes sense that Oprah wouldn’t have him on but he’d be perfect for Tucker Carlson, Joe Rogan, Candace Owens or even Breaking Points.
Speaking of Oprah, recently not even a professional psychotherapist was any match for the wit and wisdom of brain that at its peak probably weighed over 2000 grams:
Davide Piffer claims that from the year 700 to 1850, Northern Europe saw a 0.78 standard deviation (SD) Increase in polygenic scores that predict education, and by extension IQ. But does that mean early Medieval Europeans were genetically 0.78 dumber, by which I mean that if we cloned them and raised them in today’s Northern European homes, they would score close to 0.78 SD lower than the average White? IQ 100 vs IQ 88 (U.S. white norms which yield IQs somewhat lower than those normed on the full U.S. population).
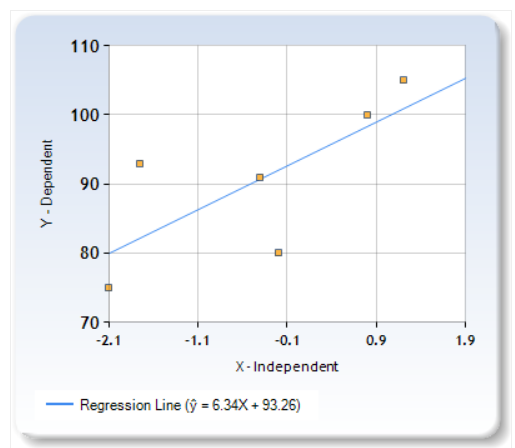
To answer this question, we need to look at the polygenic scores of extant populations we can actually test. Figure 12 shows the polygenic scores Piffer found for seven racial groups expressed in standard deviation units. Note that global samples are more genetically diverse than exclusively Northern Europeans so the SD here might be a bit inflated, thus overestimating gaps when applied within Europe.
Nonetheless, when we compare these polygenic scores (PG_Z) with Lynn’s 2006 IQ estimates based on actual IQ scores, we get a 0.58 group level correlation. If we crudely attempt to correct these numbers for the fact that some races suffer from Third World environment (which Lynn estimated subtracts 13 IQ points) or Second World type environments (7 points?), the correlation rises to 0.85.
PGS_Z
IQ estimates derived from Lynn (2006)
Estimated IQ if everyone lived in First World
Oceania
-2.1
62
75
Middle East & South Asia
-0.4
84
91
Europe
0.8
99
99
East Asia
1.2
105
105
America
-0.75
86
93
Africa
-0.2
67
80
When we plot the six races on a simple graph, we see that a 1 SD change in this type of polygenic score predicts a 6.34 point change in expected IQ if raised in First World environments. So if we treat early Medieval Northern Europeans as just another race, their expected IQ in the First World would be 95 because their PGS are 0.78 SD lower that their modern IQ 100 counterparts, thus predicting an IQ that’s 0.78(6.34) = 5 points lower .
Now Piffer might argue that the PGS used in the above graph are low coverage genomes and thus less reliable but the Medieval genomes Piffer uses are also largely low coverage. Piffer might further argue that the races being compared in the graph are too genetically different to be compared on PGS, unlike Europeans separated by only 1000 years. Maybe, but I doubt there’s been enough research on low coverage genomes to say either way and if this method is not yet robust enough to compare extant populations in a species as genetically homogenous as our own, then what hope is there for guessing Neanderthal IQ?
Just wanted to take a moment to wish a happy birthday to one of my favorite journalists Krystal Ball. I just think she and her co-host to an excellent job analyzing the political events of the day. Here they discuss Trump’s fascinating first meeting with Zoran Mamdani. Vivek Ramaswamy mut be so jealous. He spent years kissing Trump’s ass and tolerating MAGA’s anti-black racism, only to be kicked to the curb like yesterday’s trash and told to his face by baby faced MAGA college kids that his Hindu Gods are demons.
Meanwhile his fellow Indian American Mamdani stands up for working people, blacks and Palestinians, threatens to arrest Netanyahu and calls Trump a fascist and suddenly he’s the one who gets Trump’s seal of approval as the newly minted mayor of the most influential city on the planet.
But at least Ramaswamy’s a billionaire, something Mamdani will never be.
Recently Davide Piffer and I had a disagreement on X over recent selection for IQ in Britain. The below chart someone posted on X shows British education polygenic scores expressed in standard deviation (SD) units over 1000 years :
His point about polling is well taken which is precisely why I asked him in the above the X thread whether Harvard students would score just as high on a five minute version of the SAT. A pollster doesn’t have time to poll hundreds of millions of Americans so they sample a few thousand. Similarly, if we don’t have time to give all two hours of the SAT, one could give a five minute sample of all the SAT questions. So if anyone knows why Piffer didn’t find this example analogous, please enlighten me.
But Piffer also says:
So here Piffer is saying that if one of the causes of a phenotype has increased by X SD, then we might correctly assume the entire phenotype has increased by the same degree, even if the correlation between the part and whole is very imperfect among individuals. Okay! There’s been no increase in British brain size (a cause of intelligence) since Medieval times (excluding post-WWII nutritional gains related to the Flynn Effect), thus there’s been no increase in genetic IQ.
If Piffer wants to analogize to polls, that’s fine with me, after all brain size can be considered a sample of the full population of neurological traits (brain folds, myelination, nerve conduction speed, reaction time etc) that cause IQ, but what do pundits do when the polls conflict? They average them.
So let’s say the polygenic poll Piffer did implies a 0.6 SD increase in IQ, but a poll of neurological properties (with brain size being the sample) suggests a 0 SD increase in IQ. Averaging them together suggests a 0.3 SD increase in genetic IQ and generously assuming an adult IQ heritability of 0.8 (Jensen, 1998), and thus a genotype-phenotype correlation of 0.89 (the square root of heritability). Thus if we cloned Medieval Brits and raised them in today’s UK, they’d probably average 0.3 SD(0.89) = 0.27 SD (about 4 IQ points) below today’s white Brits (or they might even score higher than today’s white Brits if you believe Michael Woodley’s dysgenic theories).
I thought y’all could use a break from all these cognitive tests and might like to take a personality test which can be found right here. Please take it before reading the comments or researching personality tests because that might influence your scores which I would love for you to post in the comment section given all the interesting characters we have here. The great thing about this test is not only does it give you scores on six broad personality traits (written on the score report in capital letters) but also 25 subscales.
The broad personality traits are probably more reliable since they’re an aggregate of four subscales each but the subscales are interesting too.
Both the broad traits and the subscales are scored on a scale where Canadian university students (an equal number of men and women) have a mean of 5 and a standard deviation of 1. Since university has become so common, I assume the sample is somewhat representative of young Canadian adults on the whole.
The below table is based on the first 29 people to take the Pieces test (excluding likely repeat attempts and people who spent less than 2 minutes). Since the totality of evidence now suggests that relative to their non-clinical general U.S. population, my sample has a Wechsler full-scale Z score of 1.93 (SD = 1.33) this distribution was then adjusted by the 0.6 correlation (no contamination) between WAIS-III full-scale IQ and Object Assembly (similar to Pieces) and then equated to the sample distribution to estimate the general population Z scores.
Out of all the subtests I have added to the PAIS, perhaps none were harder to construct than the multiple choice test Pieces. I wanted at least one subtest that measured pure spatial reasoning. I had already added cubes, however cubes is kind of a hybrid of spatial and working memory. Pieces was inspired by the Object Assembly subtest in the early versions of the Wechsler, which itself was inspired by the feature profile test used to screen out low IQ immigrants at Ellis island. However unlike these tests, you don’t actually put anything together in Pieces, you just answer 21 questions in 20 minutes about how you would do so which makes the test much more difficult and reliable though perhaps less fun and clinically informative.
Is the above picture not just the coolest thing you’ve ever seen in your life? I love old school psychometrics.
A much more detailed cardboard version of this profile puzzle would appear on the WAIS-III, WAIS-R, original WAIS and the granddaddy of all Wechsler scales: the ancient WBI, reminding us once again that Wechsler, who ironically was an immigrant himself, invented almost nothing. His genius was not creation, but curation. His tests became so popular because he did a brilliant job selecting his original 11 subtests and he did so based not exclusively on psychometrical criteria, but on his own intuition of what it meant to be an intelligent adult in 20th century America, which he defined as one who knows and understands the World around them, and has the resourcefulness to cope with its challenges. For Wechsler, clinical psychology was as much art as science and these old school hands on performance tests really measured if you could adapt to your environment in a creative way.
But their Achilles’ heel was low reliability which is probably caused by the luck factor of randomly fitting pieces together. It was also inconvenient to psychologists to lay out all the puzzle pieces in just the right position, so shortly after Wechsler died, newer WAIS revisions discontinued the subtest.
Using data from the first 55 unique individuals to take the sequence addition test, a cumulative frequency table was made:
This allowed me to convert raw scores on the test percentile equivalents and these percentiles were then assigned normalized Z scores (the Z scores they would equate to in a perfectly normal curve) relative to the test taking population, not the general population.
Raw
Percentile (%)
Z-Score (relative to the test-taking population NOT the general (U.S.) population
0
1.8
−2.08
1
4.5
−1.69
2
10.9
−1.23
3
20.9
−0.81
4
29.0
−0.55
5
36.0
−0.36
6
44.0
−0.15
7
59.0
+0.23
8
83.0
+0.95
9
96.0
+1.75
10
99.0
+2.33
The next question is how self-selected is the test taking population. On a scale where Americans average IQ 100 (SD = 15), those test takers who reported Wechsler IQs had a mean of 127 (SD = 24) suggesting they are much brighter and much more variable than the general U.S. population. There is no reason to think the test takers who reported Wechsler IQs are brighter than the test takers in general; in fact the latter scored higher on the sequence addition test (mean 5.65 SD = 2.51 vs mean 4.2 SD = 3.19) though given the small sample size of those with self-reported Wechsler scores (n=5) it’s not statistically significant.
Now when Ron Hoeflin normed the Mega Test, he used equipercentile equating, meaning that even though the two tests are imperfectly correlated, he assumed that the percentile distribution of the two tests would perfectly match. So if the highest SAT score among his Mega takers was one in a million, then the highest Mega score among the Mega takers was one in a million, even if they were not the same person.
Hoeflin’s approach makes sense IF one assumes self-selection for taking the Mega Test correlates about as well with Mega scores as it does with SAT scores, however I highly doubt my test correlates about as well with self-selection as the Wechsler does, and the reason is a comprehensive test like the Wechsler is going to be much more reliable and valid than my brief test is, and thus correlate better with most external criteria. So assuming my sample averages +1.8 SD on the Wechsler, I’d expect them to average (0.58)(1.8 SD) = 1.04 on sequence addition. Why 0.58? Because before contamination, that’s the correlation between WAIS-R full-scale IQ and Digit Span (the subtest most similar to sequence addition). Also, if my sample has a Wechsler SD that is 160% the U.S. SD, on this test they should be 160(0.58) = 93% of the U.S. SD.
Armed with these statistics, I transformed the normalized Z scores calculated with reference to the test taking population to Z scores with reference to the U.S. population.
U.S. population Z score = (test taker Z score)(0.93) + 1.04
Raw score on sequence addition
Estimated Z score relative to the U.S. population
0
−0.8944
1
−0.5317
2
−0.1039
3
+0.2867
4
+0.5285
5
+0.7052
6
+0.9005
7
+1.2539
8
+1.9235
9
+2.6675
10
+3.2069
I deliberately did not convert these scores to IQ equivalents because people shouldn’t get the impression that a simple test like this measures overall IQ but if I had, I would have done so by multiplying them by 15 and adding 100.